

National Market Insights
Monthly real estate intelligence, key trends in pricing, inventory, mortgage rates, and buyer behavior, curated to help you look beyond the headlines

National real estate trends help explain the bigger picture, but every local market moves differently. This monthly archive highlights key shifts in home prices, inventory, mortgage rates, inflation, and buyer activity, with context for Jupiter, Palm Beach Gardens, Tequesta, Juno Beach, North Palm Beach, and Northern Palm Beach County. Our goal is to help you look beyond the headlines and understand what the data may mean at the local, neighborhood, and property level.
Market Insights Archive
National real estate trends help explain the bigger picture, but every local market moves differently. This monthly archive highlights key shifts in home prices, inventory, mortgage rates, inflation, and buyer activity, with added context for Jupiter, Palm Beach Gardens, Tequesta, Juno Beach, North Palm Beach, and the surrounding Northern Palm Beach County market.
Our goal is to help you look beyond the headlines and understand what the data may mean at the local, neighborhood, and property level.
How We Use This Data
National market reports are helpful for understanding broader economic and housing trends, but they are only one part of the decision-making process. John and Amy Simmonds use this data as a starting point, then compare it with local inventory, buyer activity, property condition, insurance considerations, neighborhood demand, HOA structure, and pricing trends across Jupiter and Northern Palm Beach County.
Browse Monthly Market Insights
Tap any available month to load that edition instantly below — no new windows, no wait.
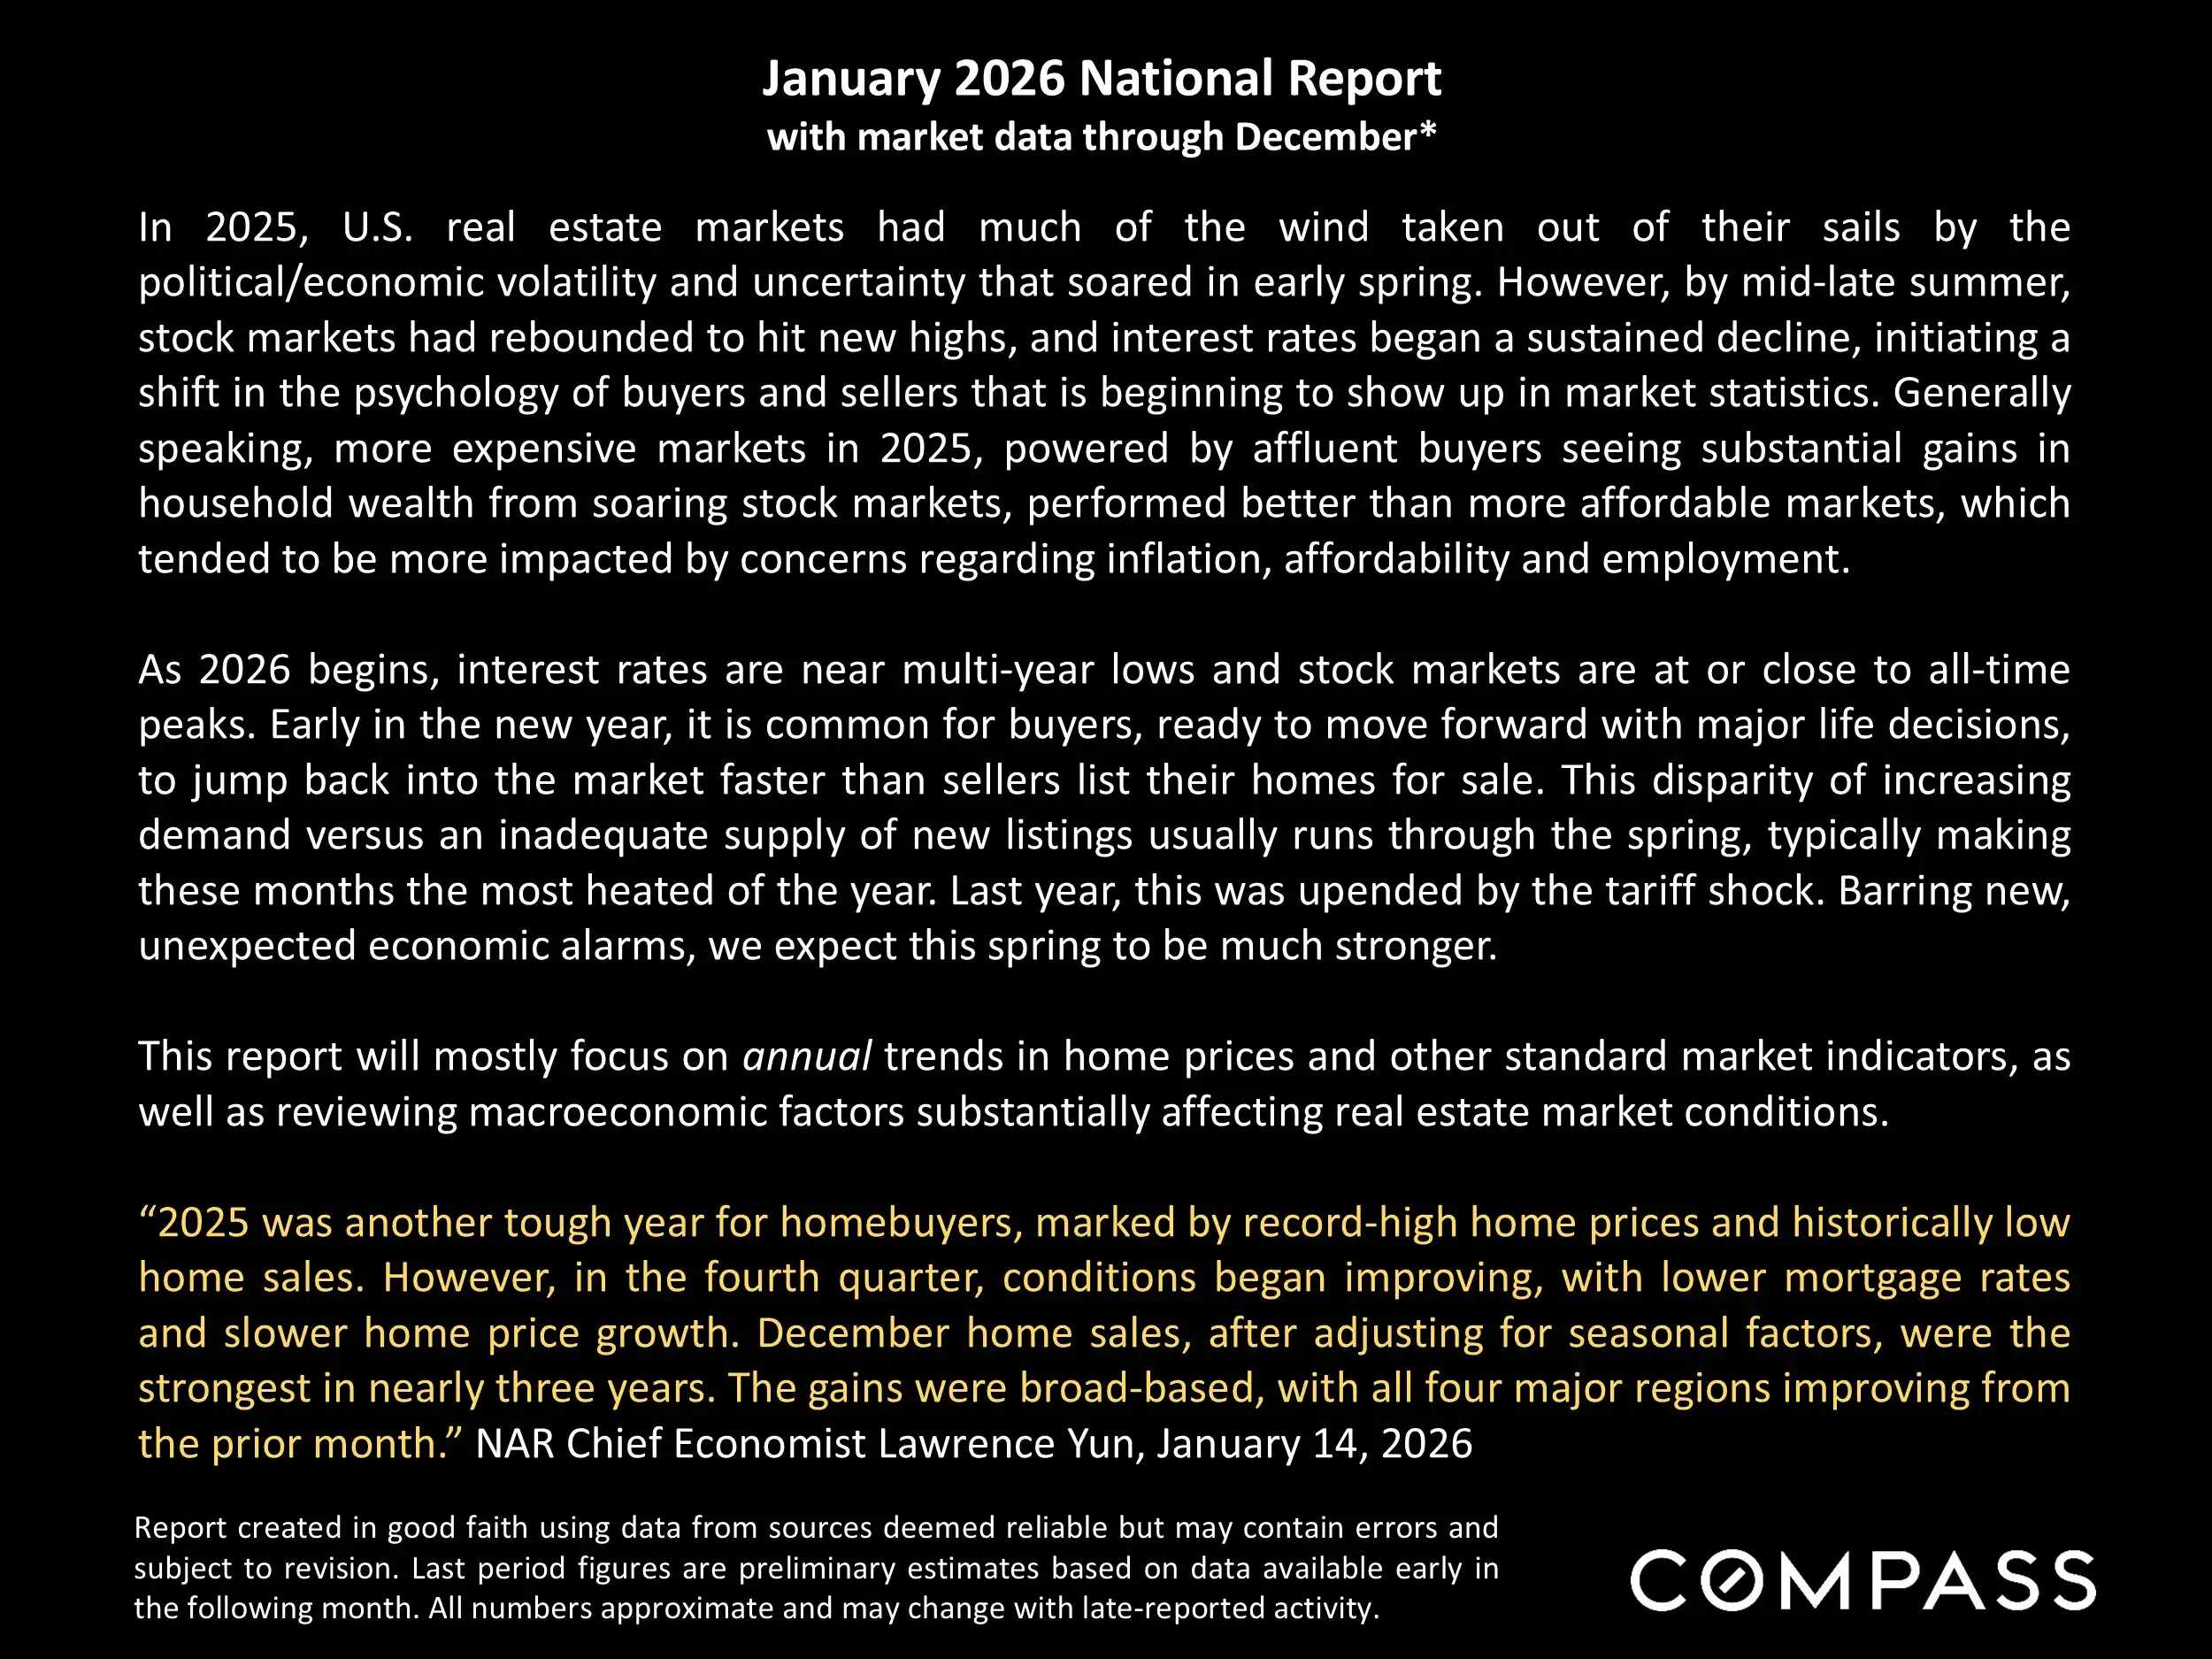
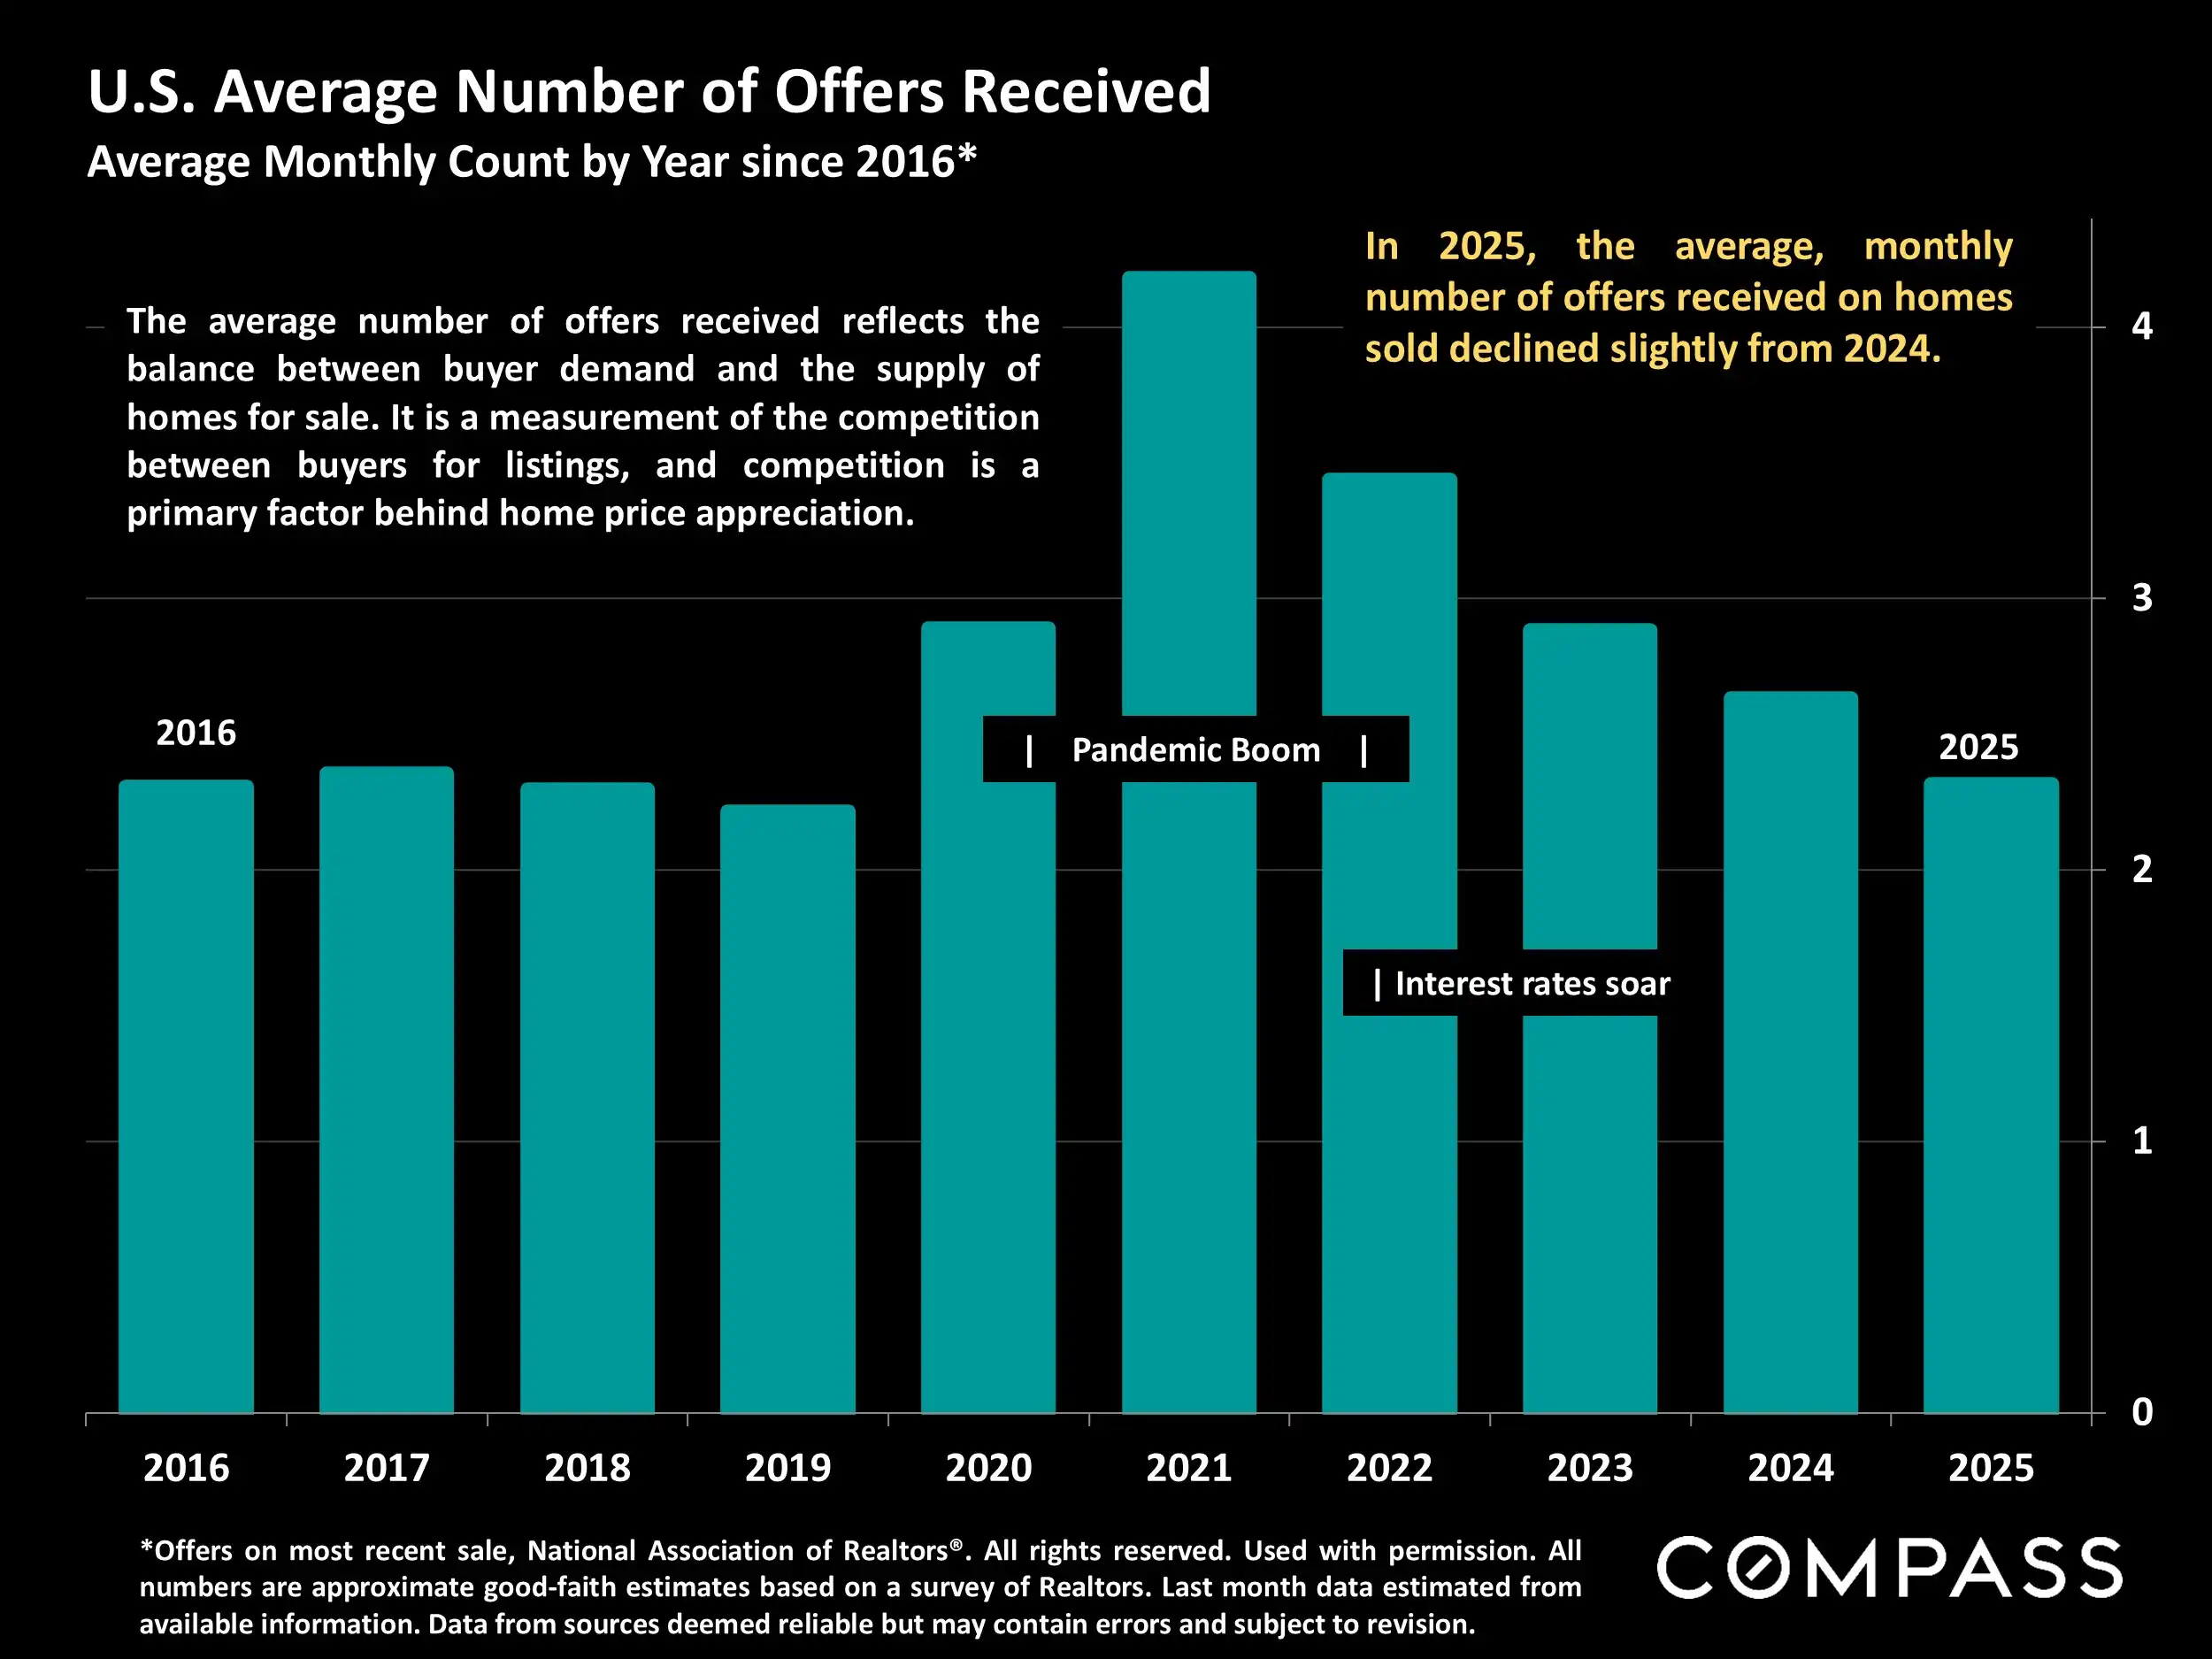
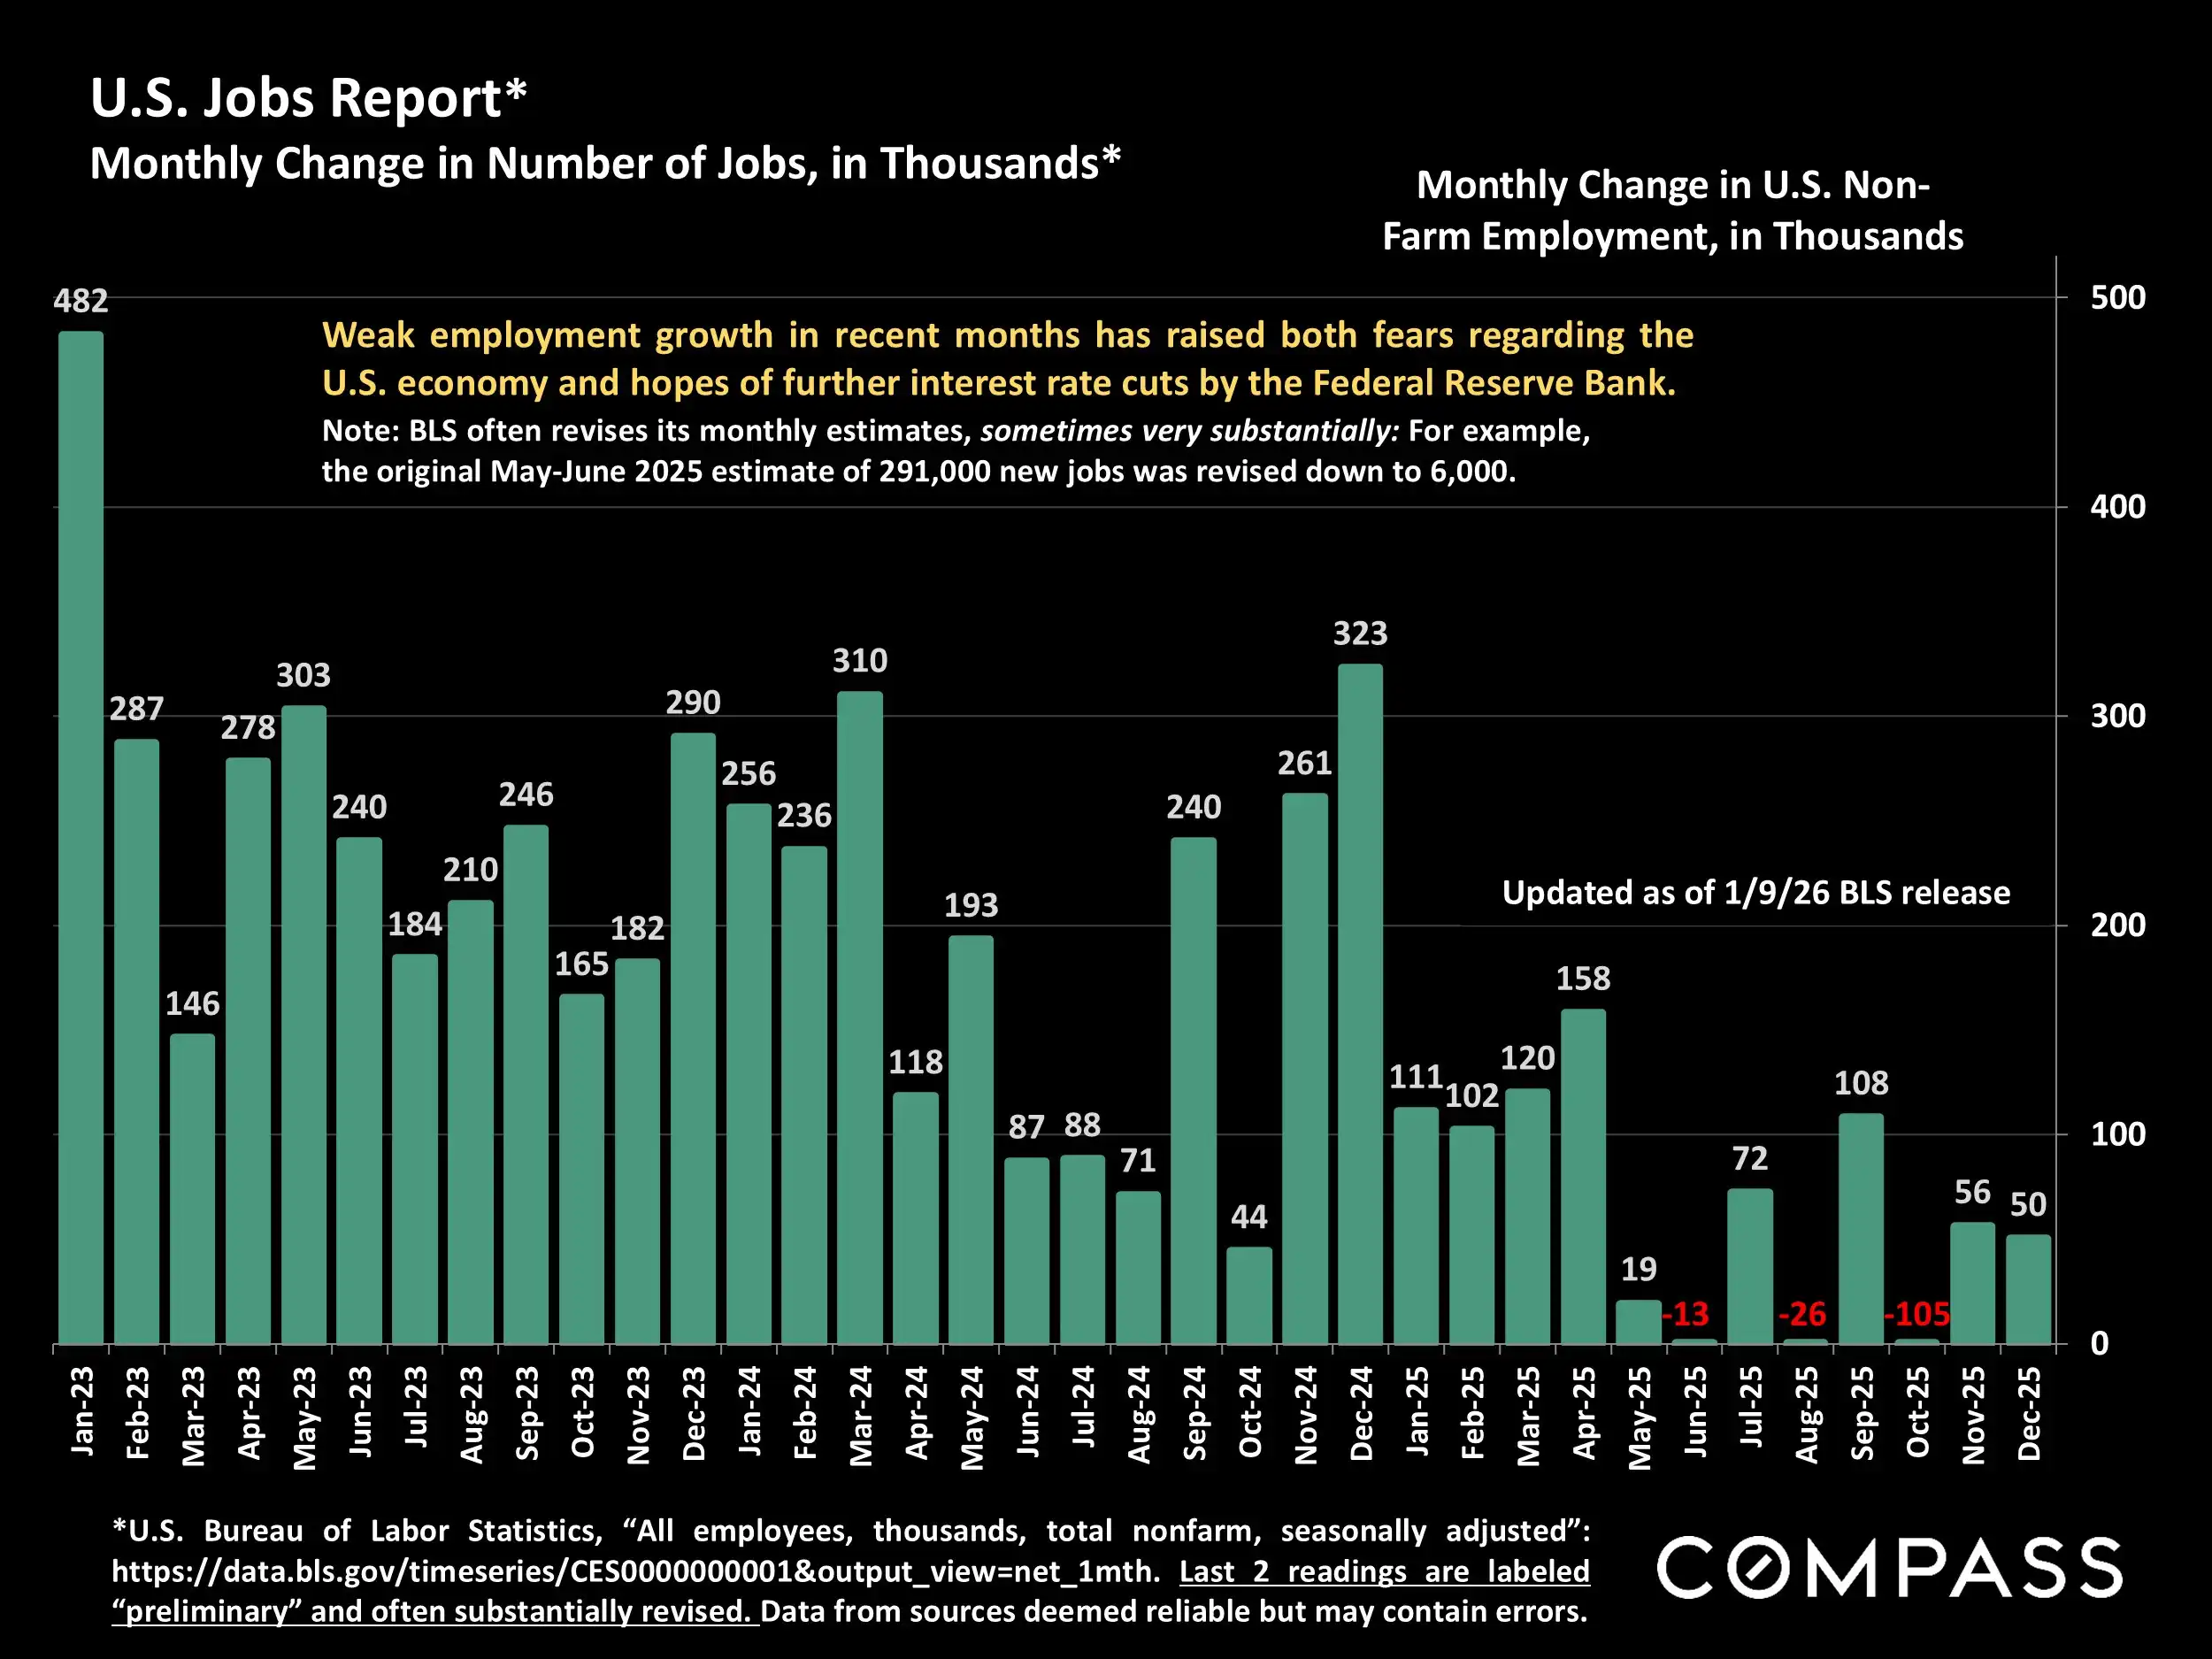
The January 2026 Compass National Real Estate Insights report shows a housing market entering the new year with improving momentum after a challenging 2025. While affordability, inflation, mortgage rates, and employment concerns continued to influence buyer behavior, several key indicators began moving in a more constructive direction by the end of the year.
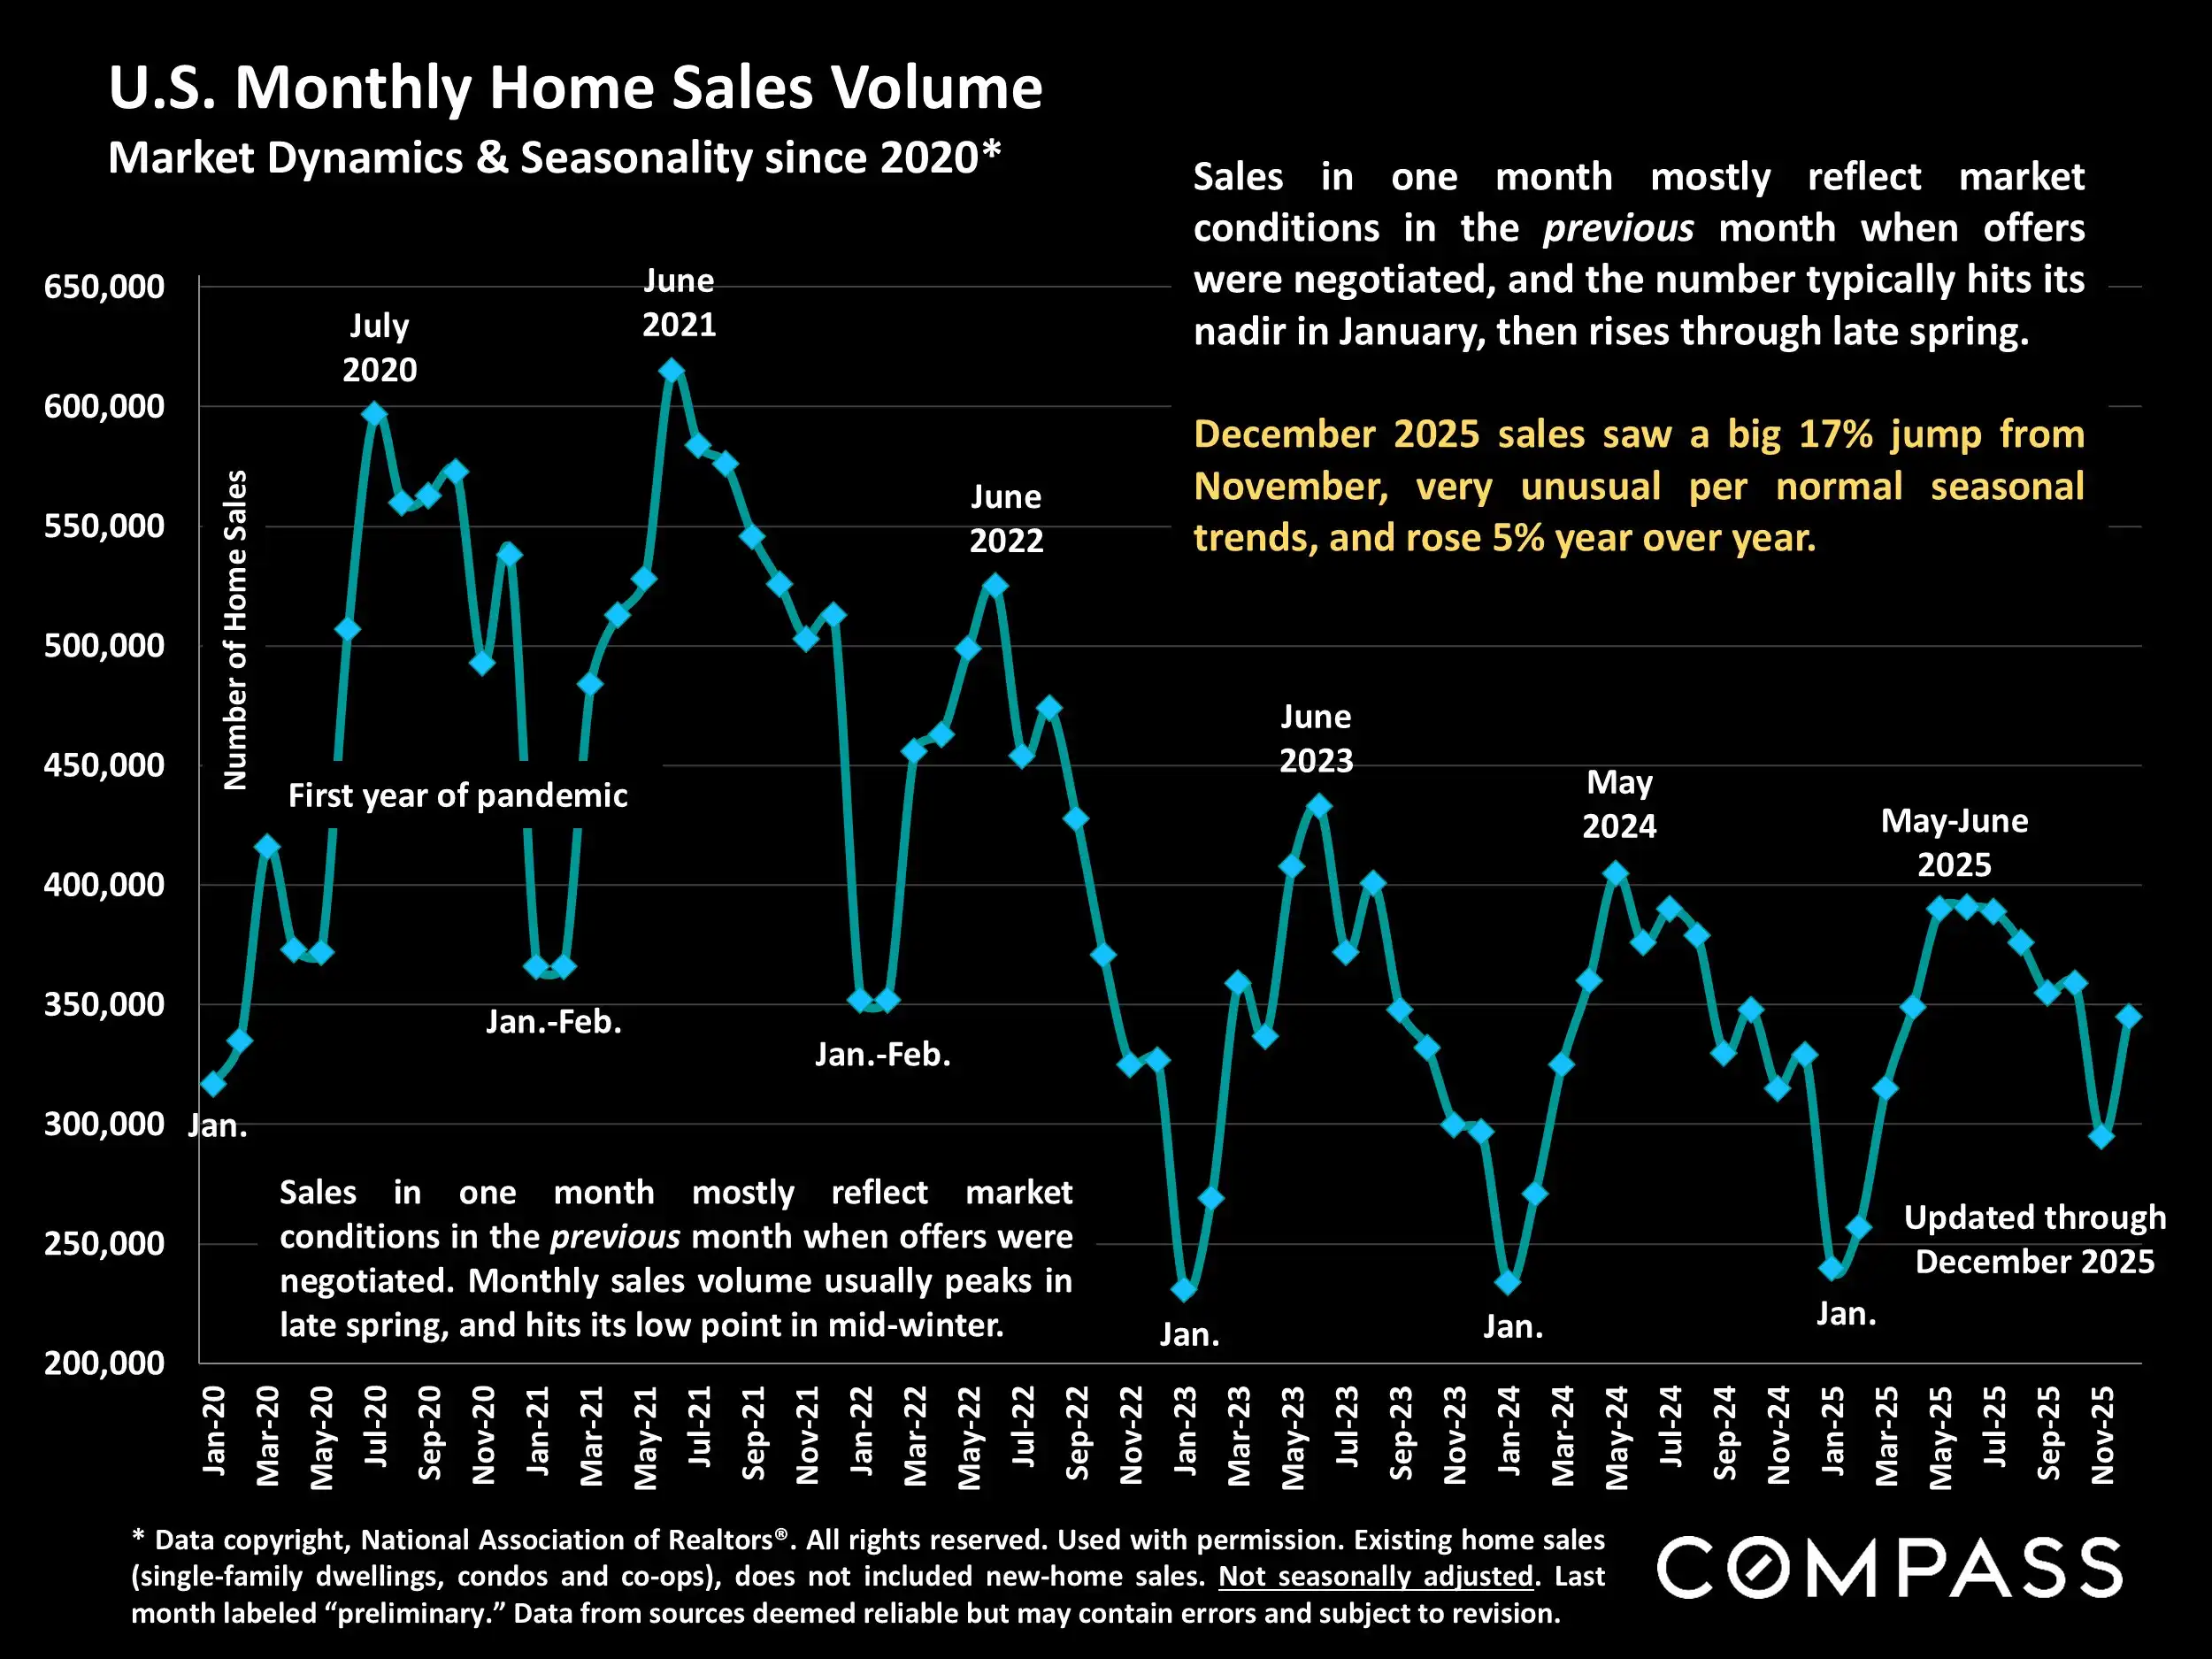
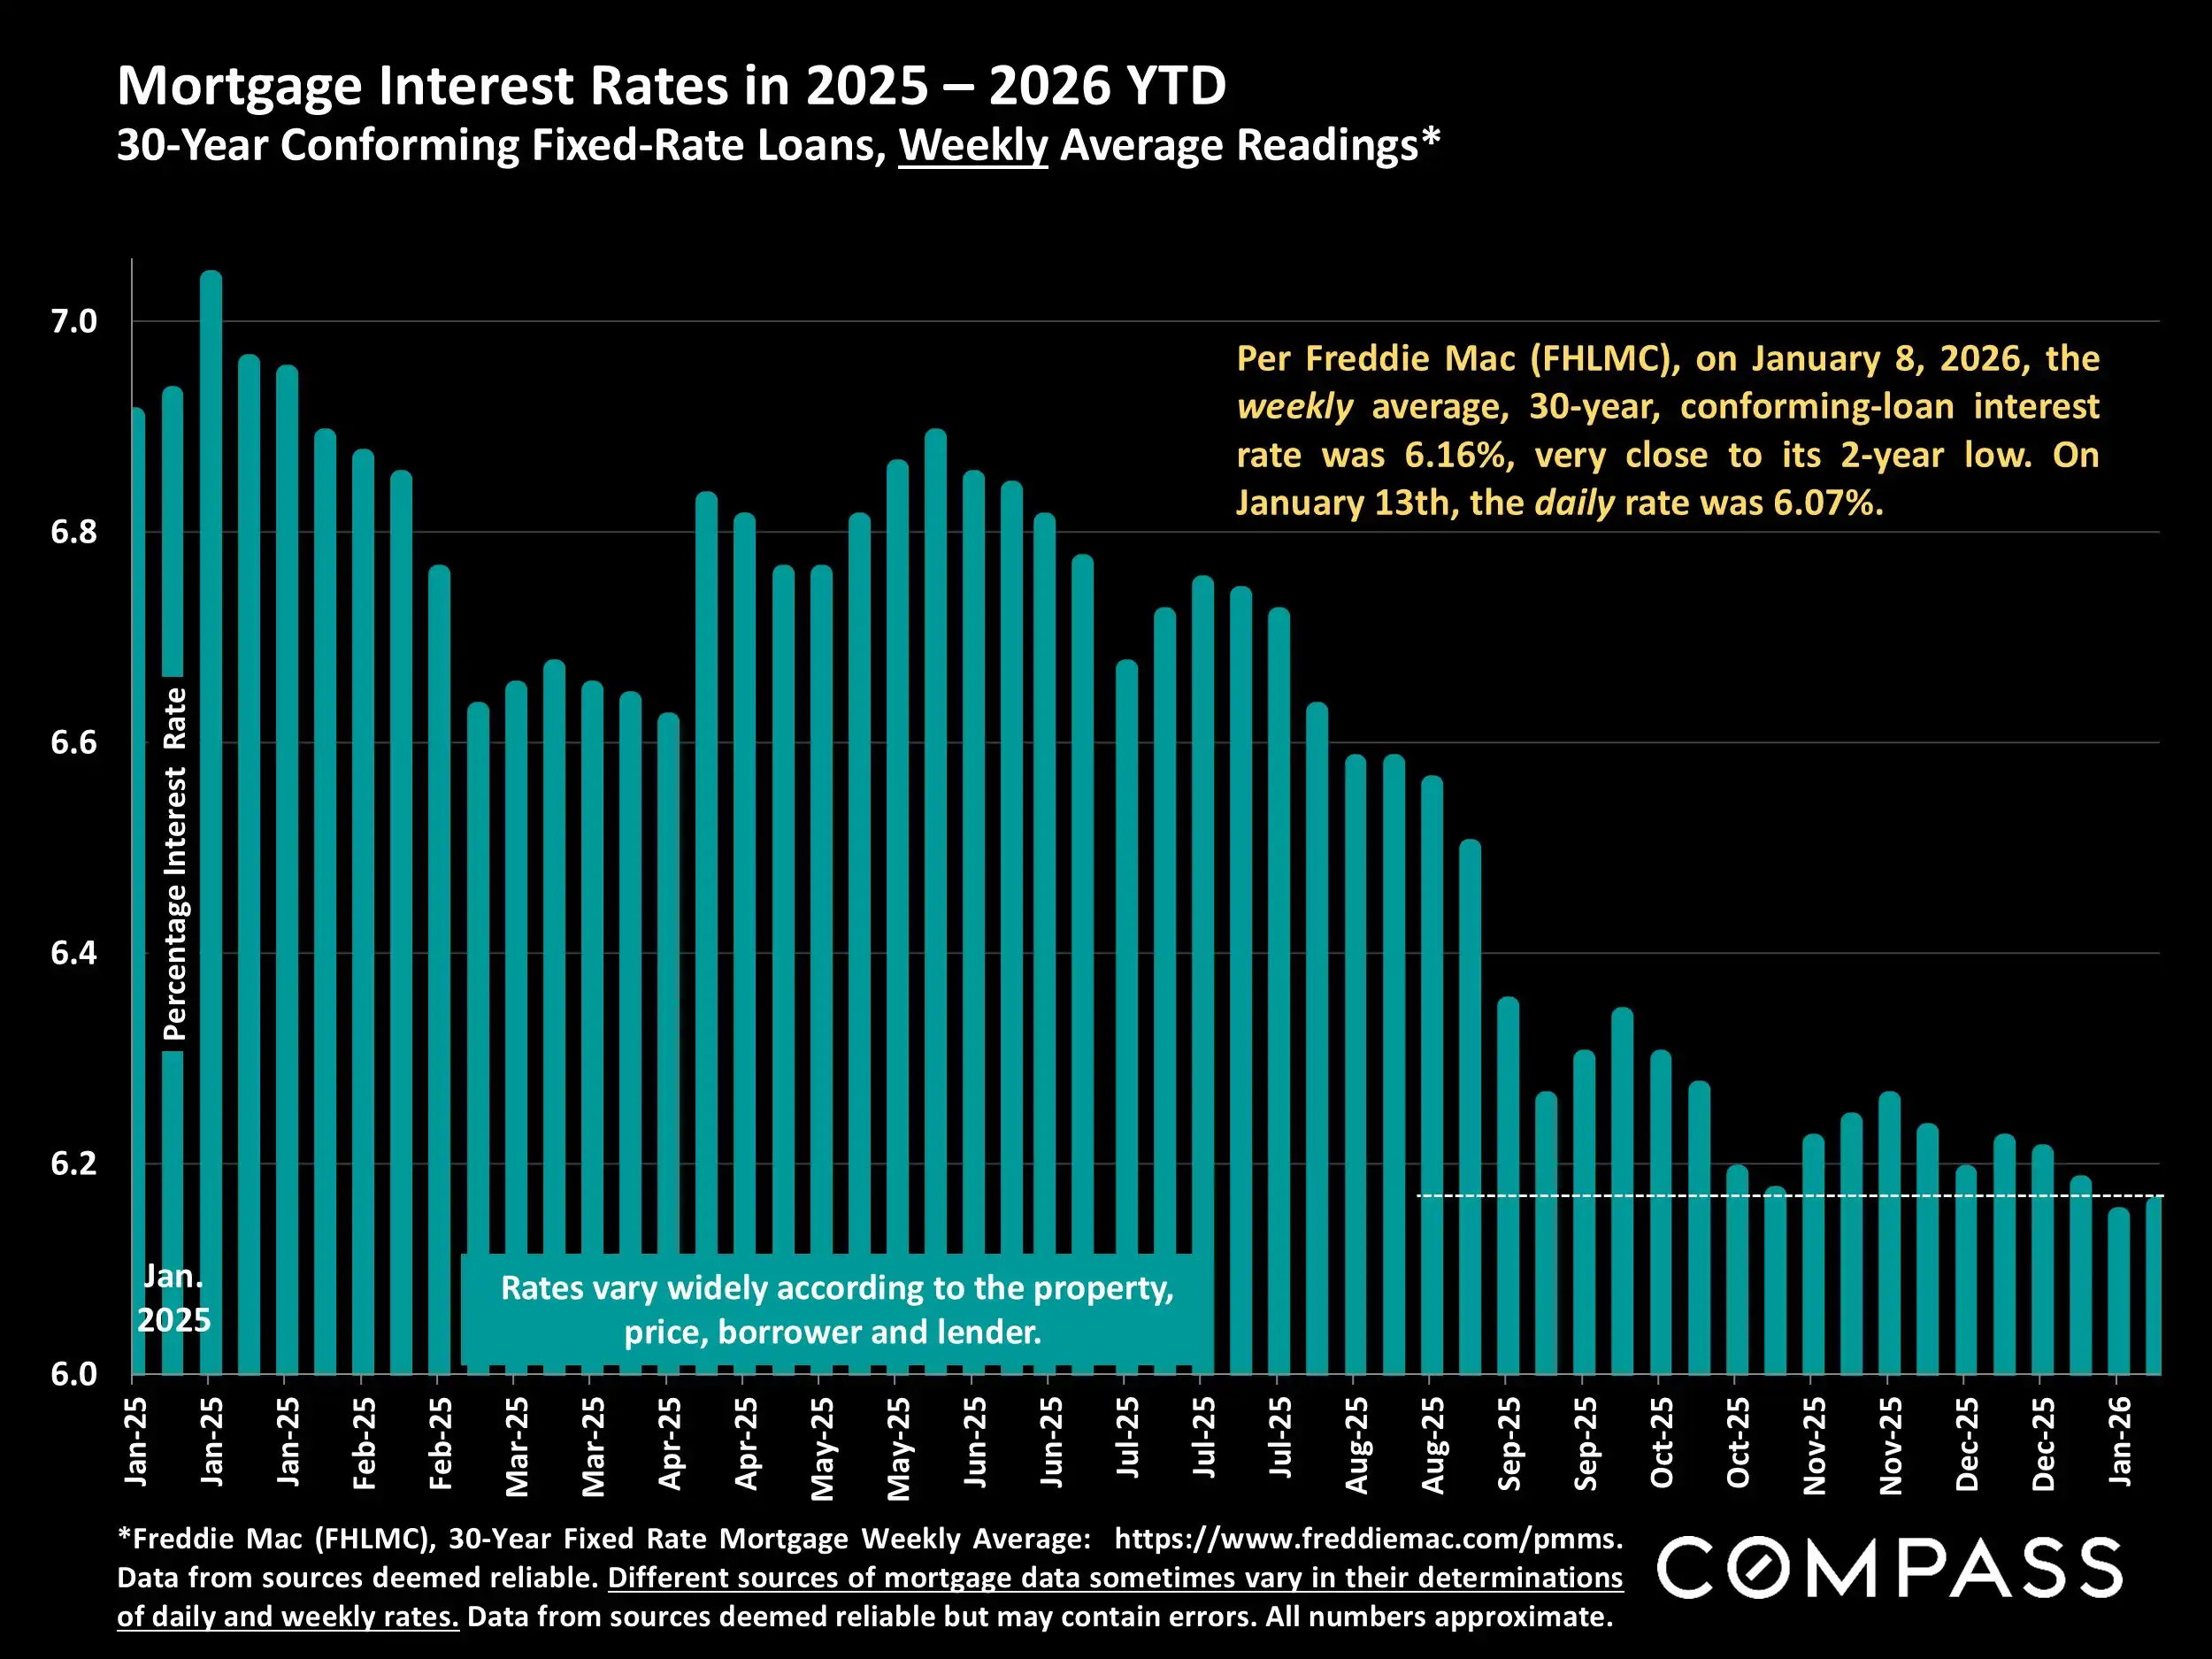
Mortgage rates declined from earlier 2025 levels, helping improve buyer confidence and supporting stronger late-year sales activity. December sales rose sharply from November and were also up year over year, an unusual seasonal improvement that suggests some buyers were beginning to re-enter the market as financing conditions eased.
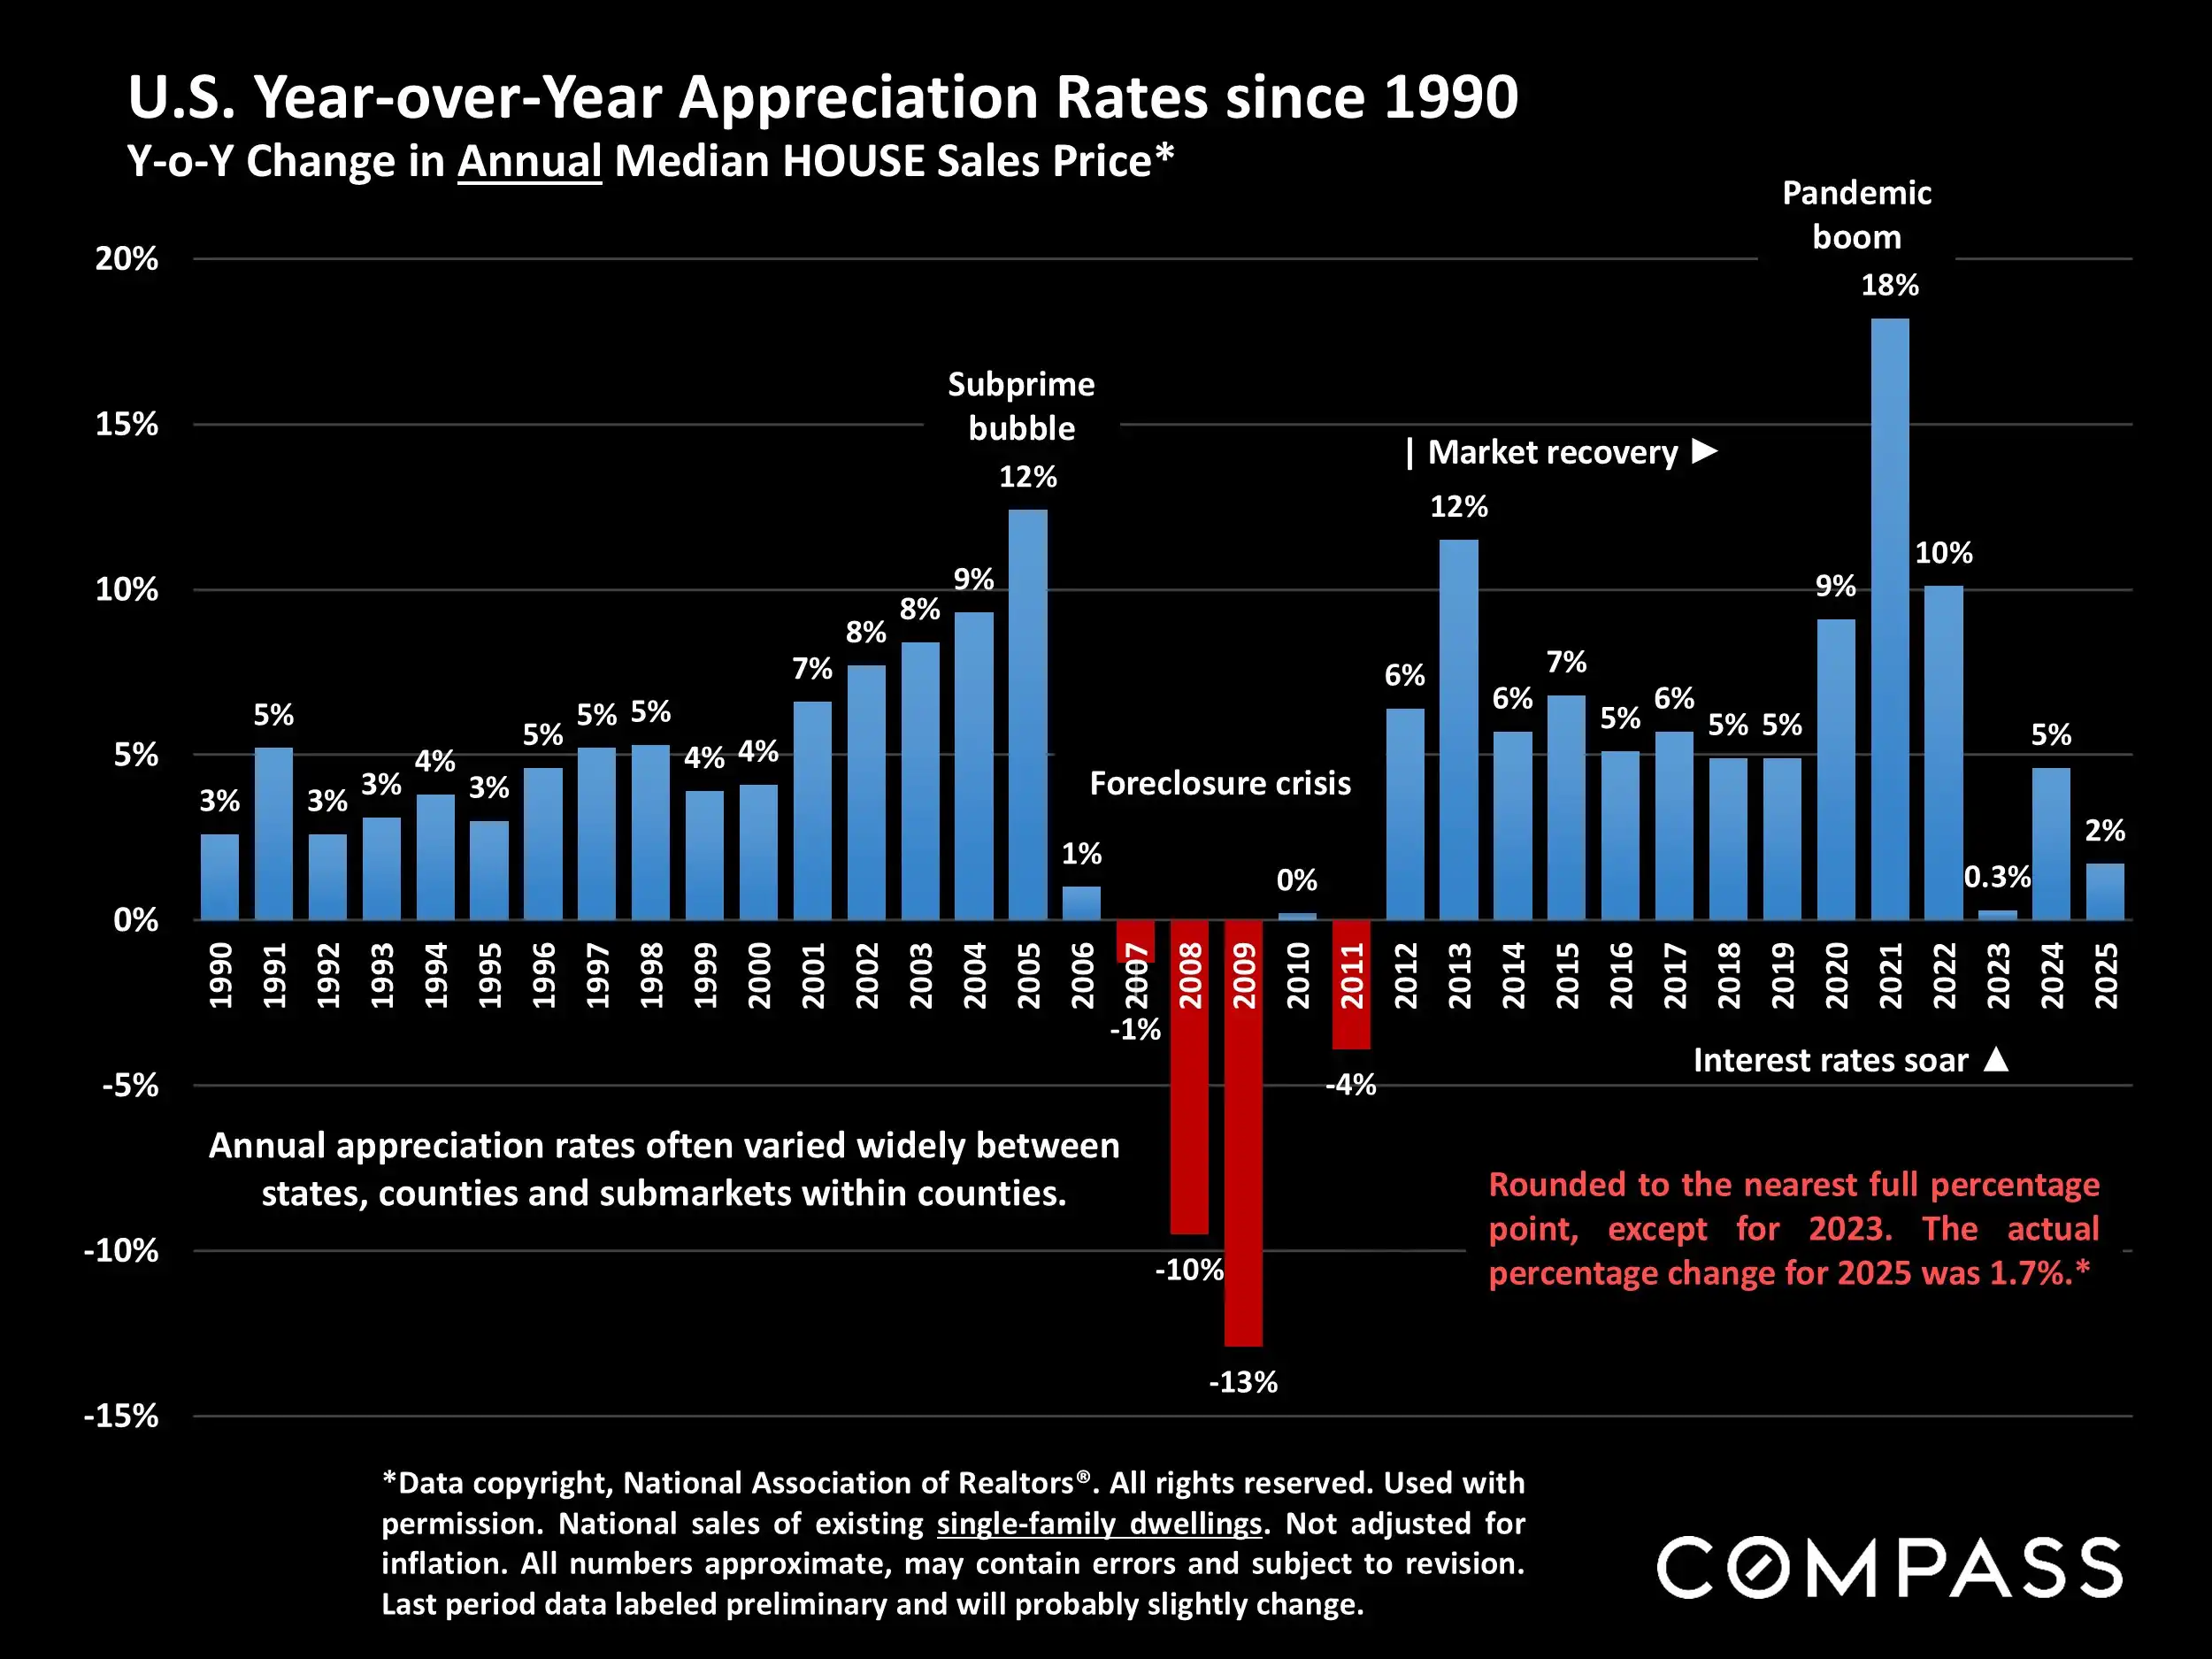
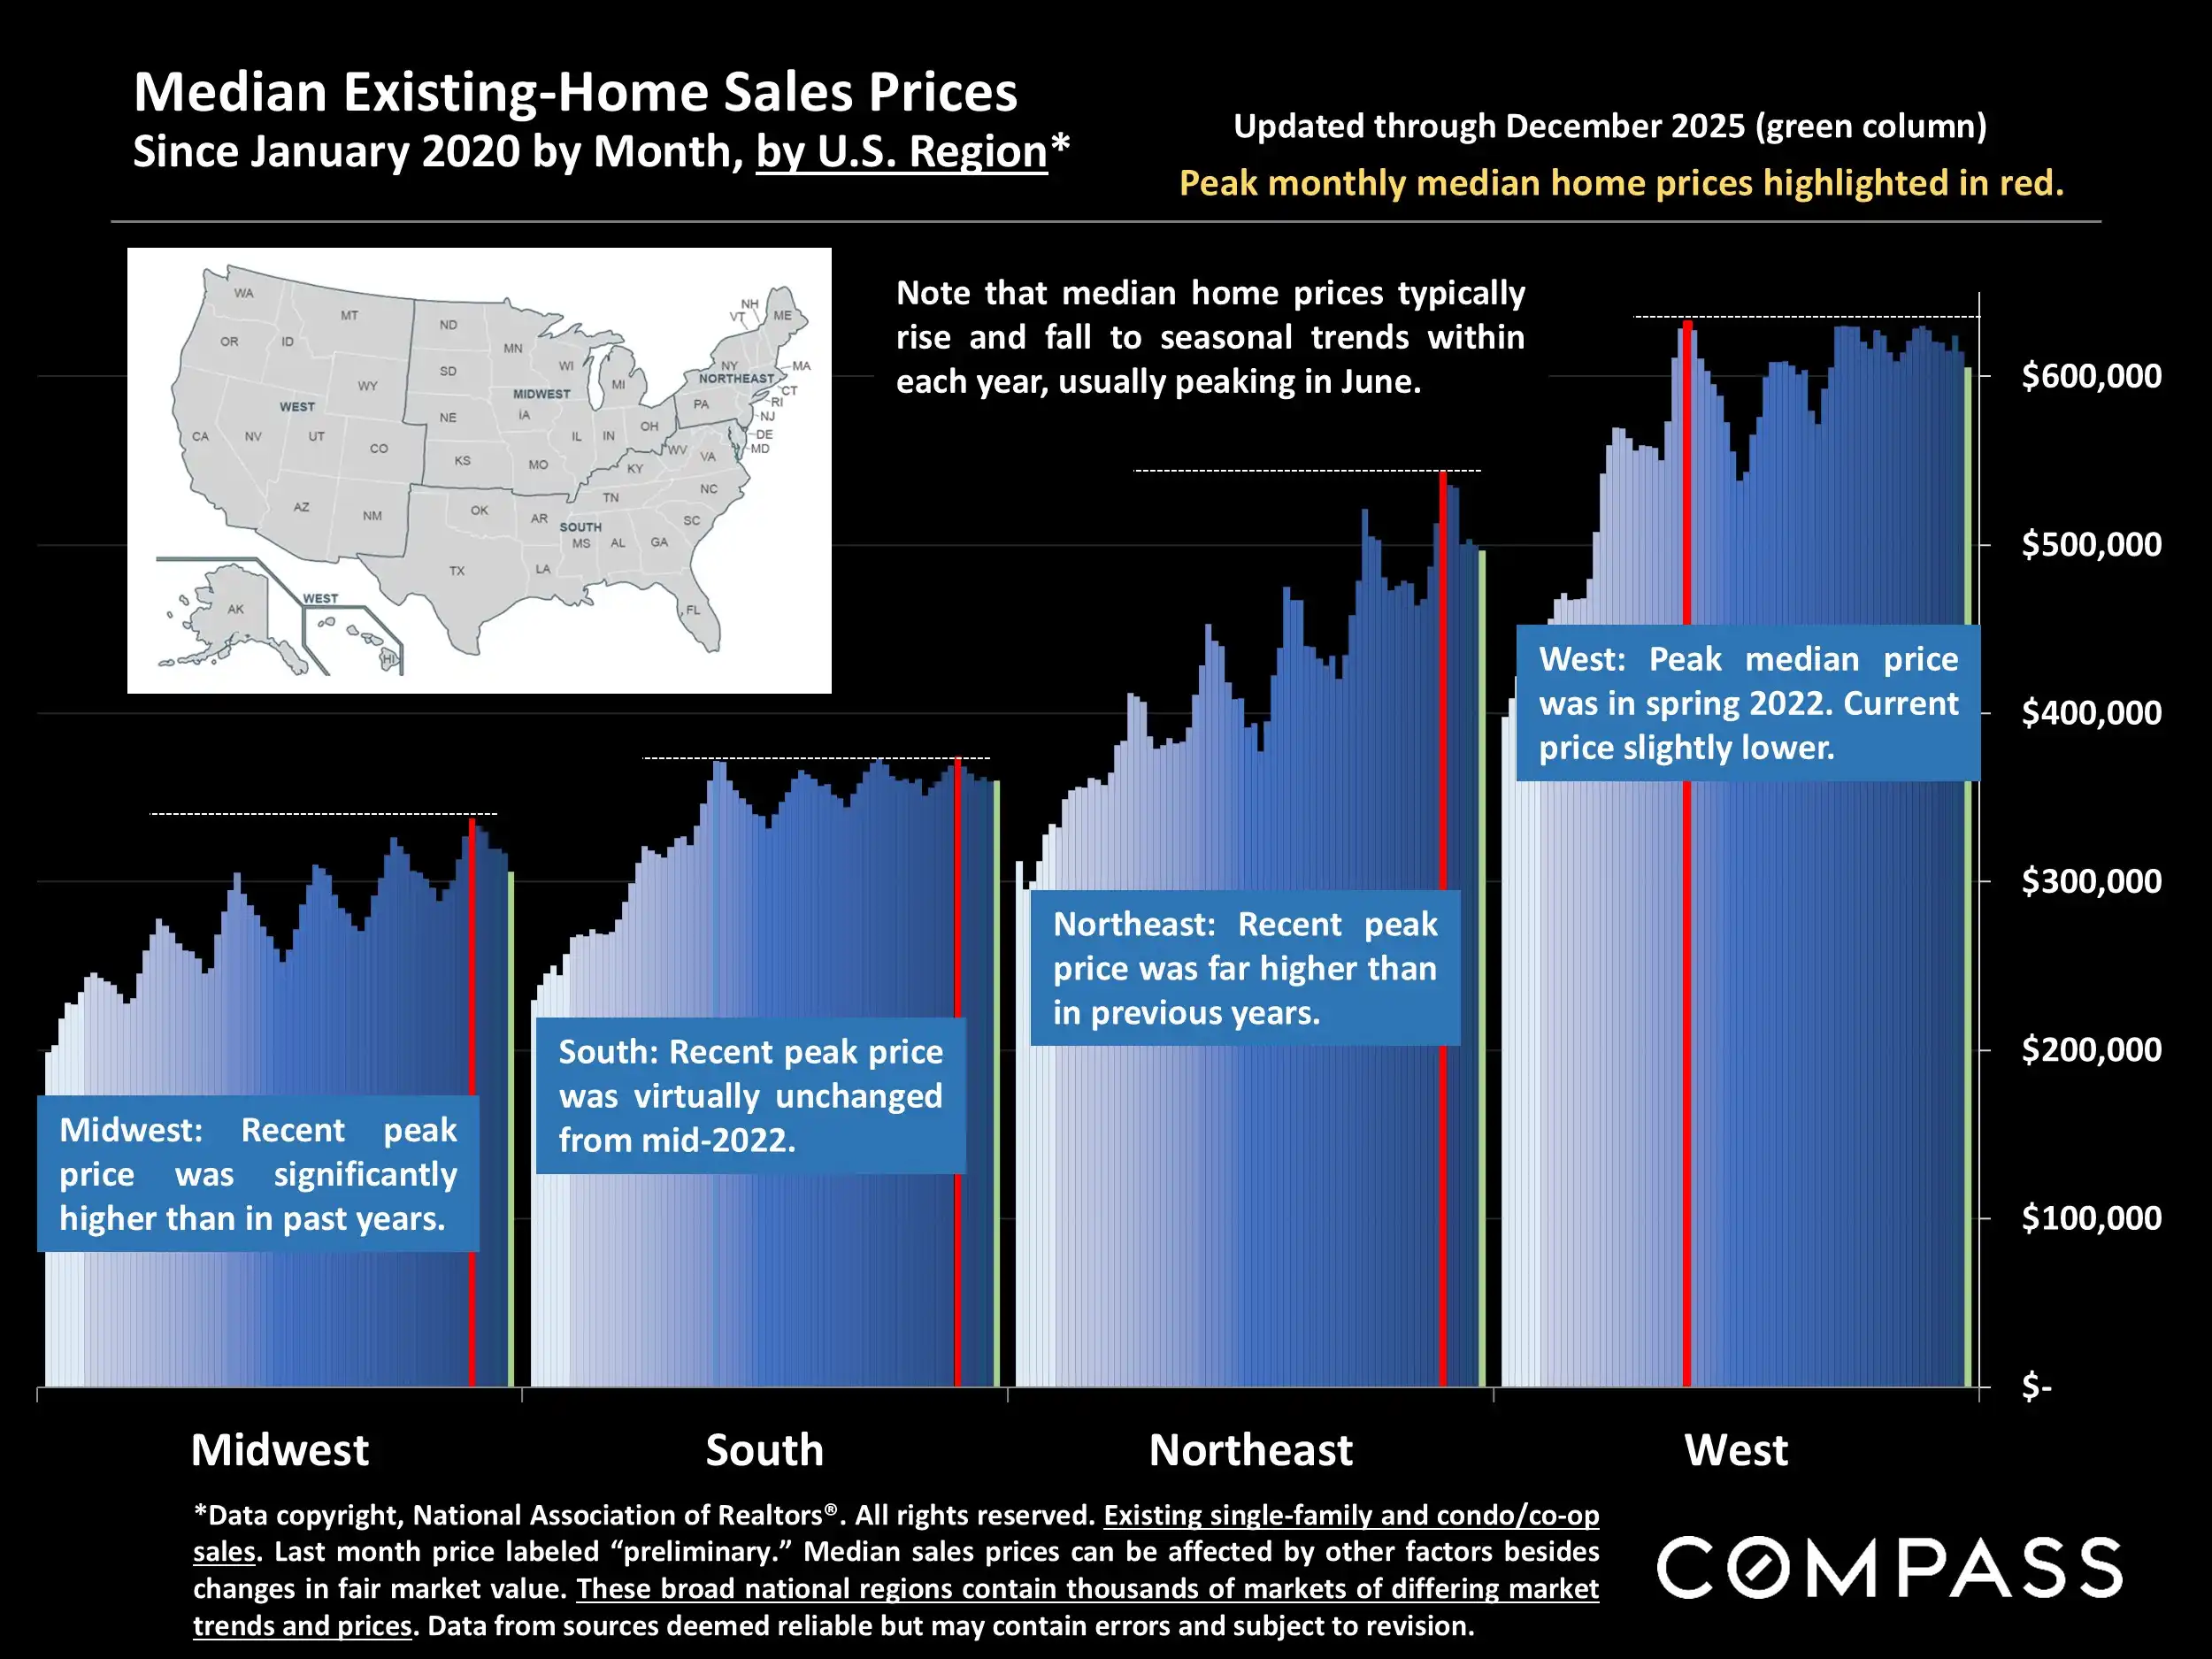
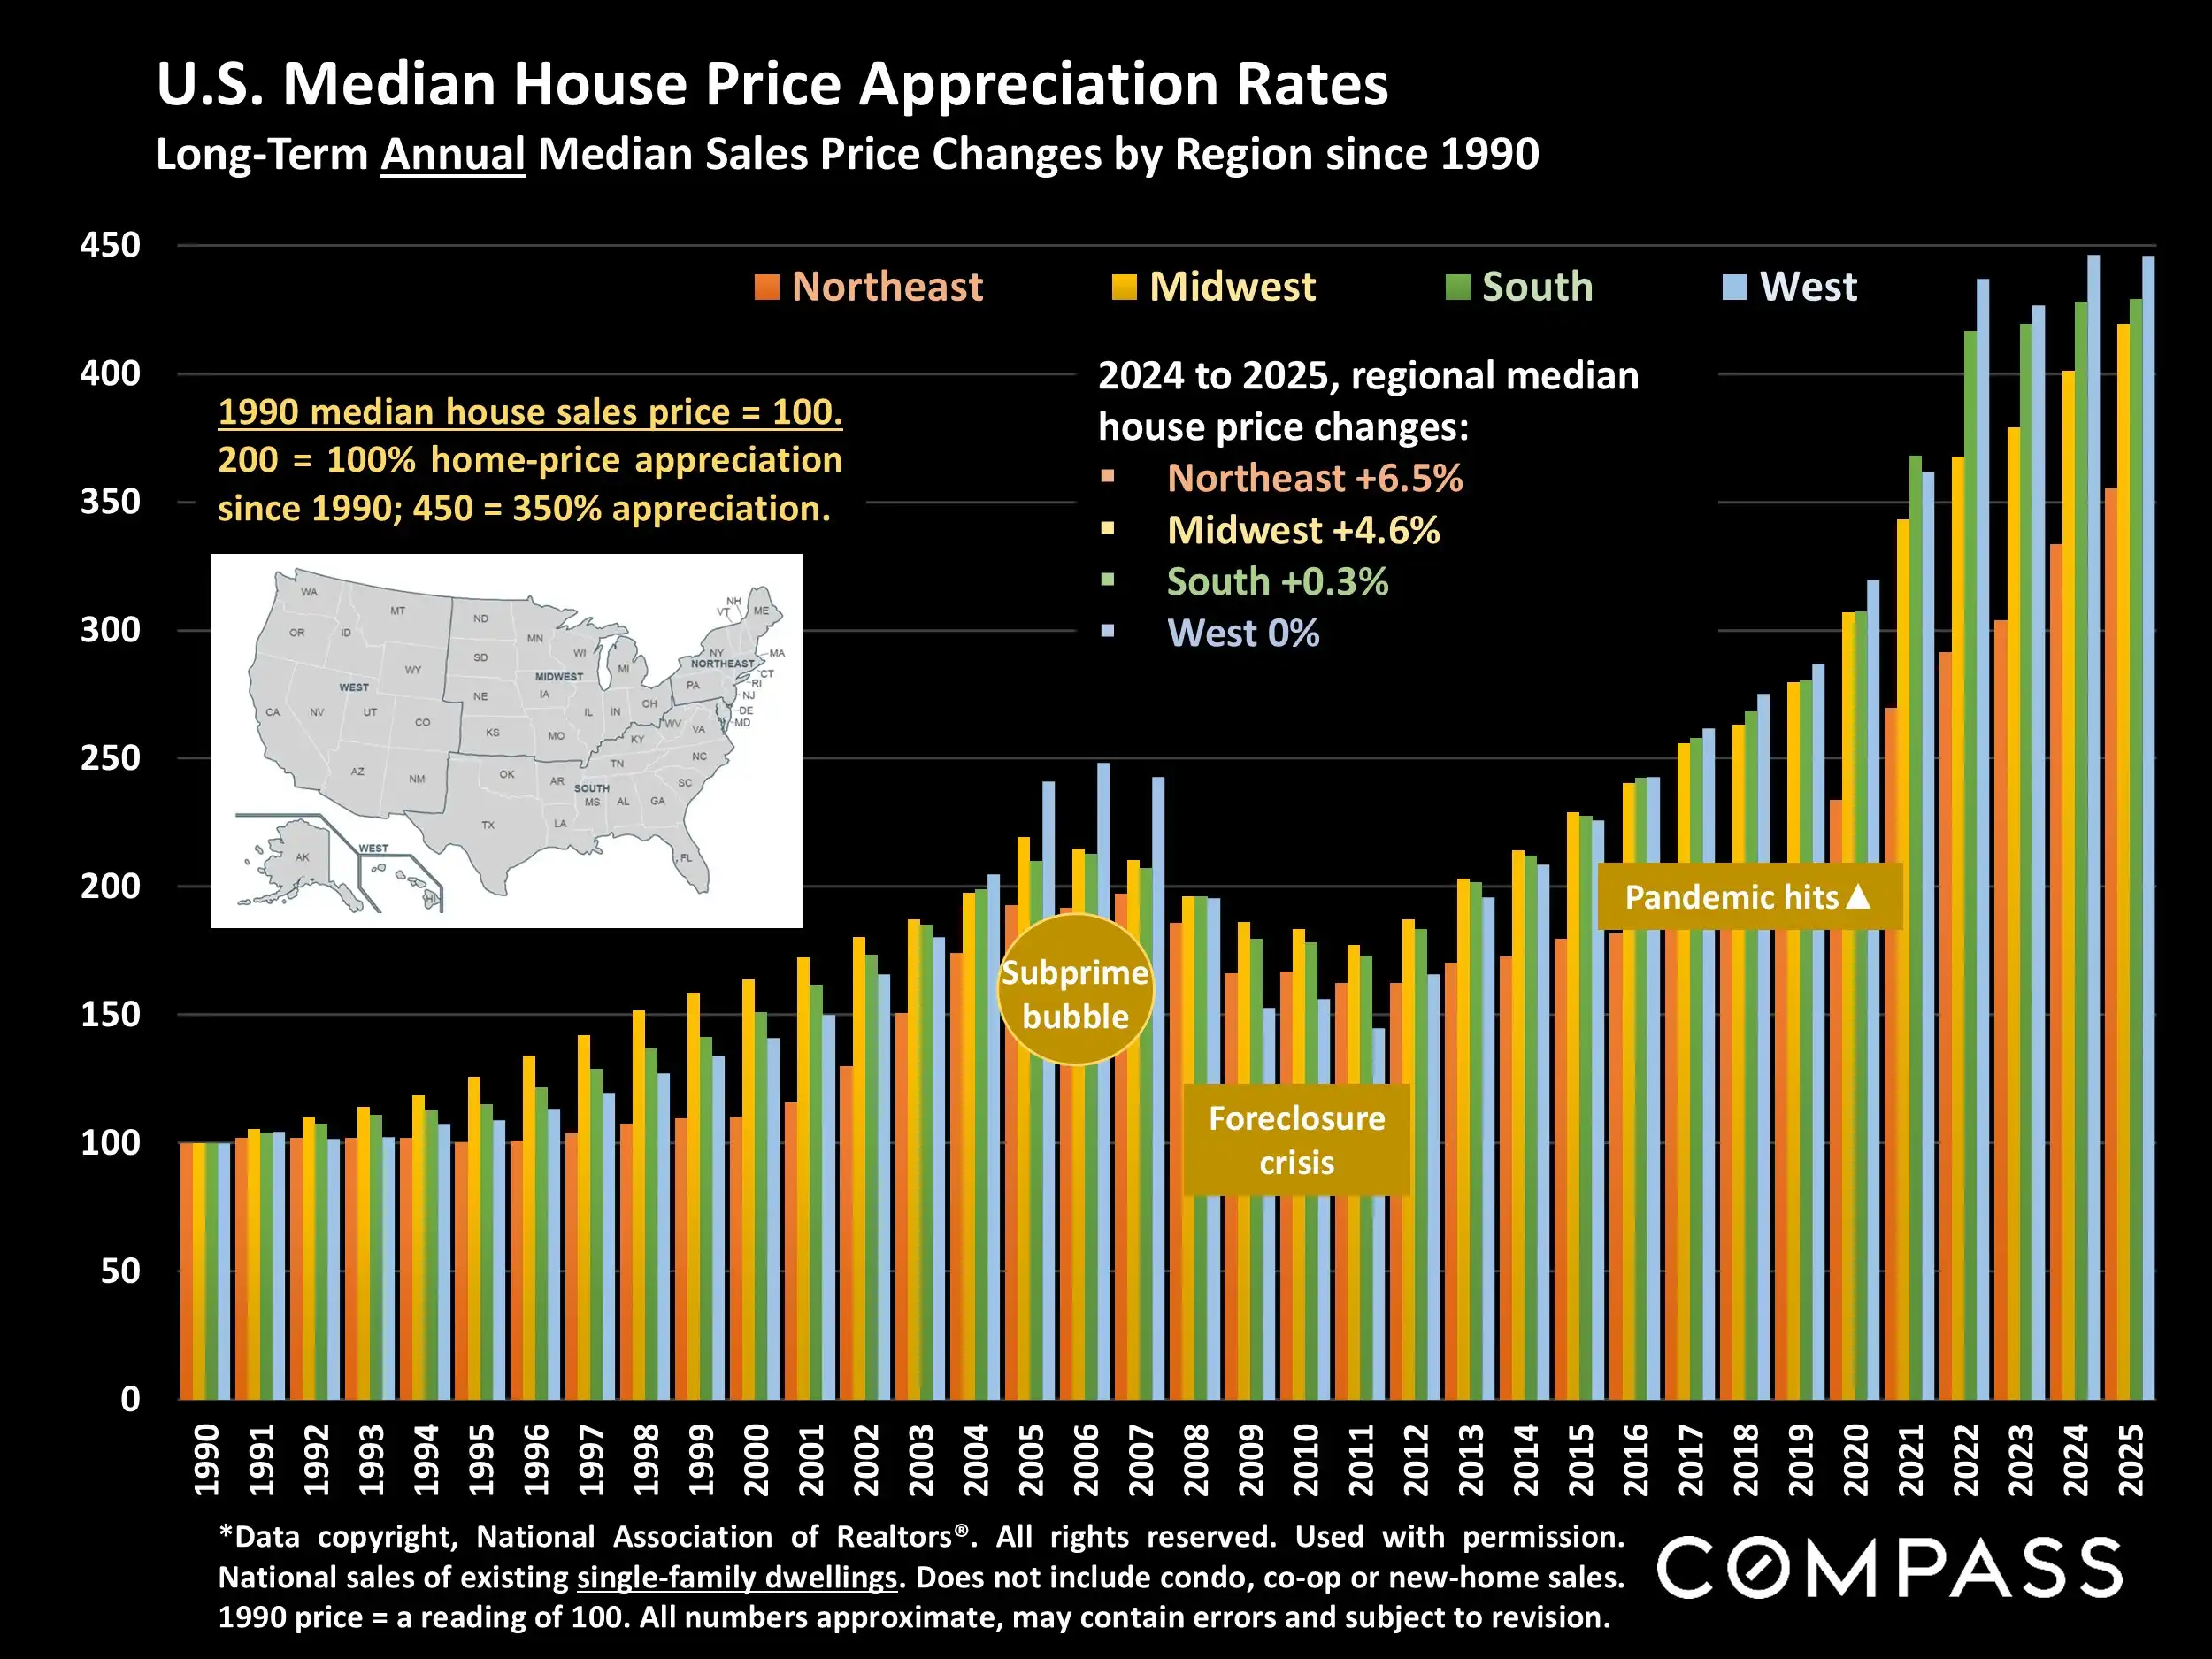
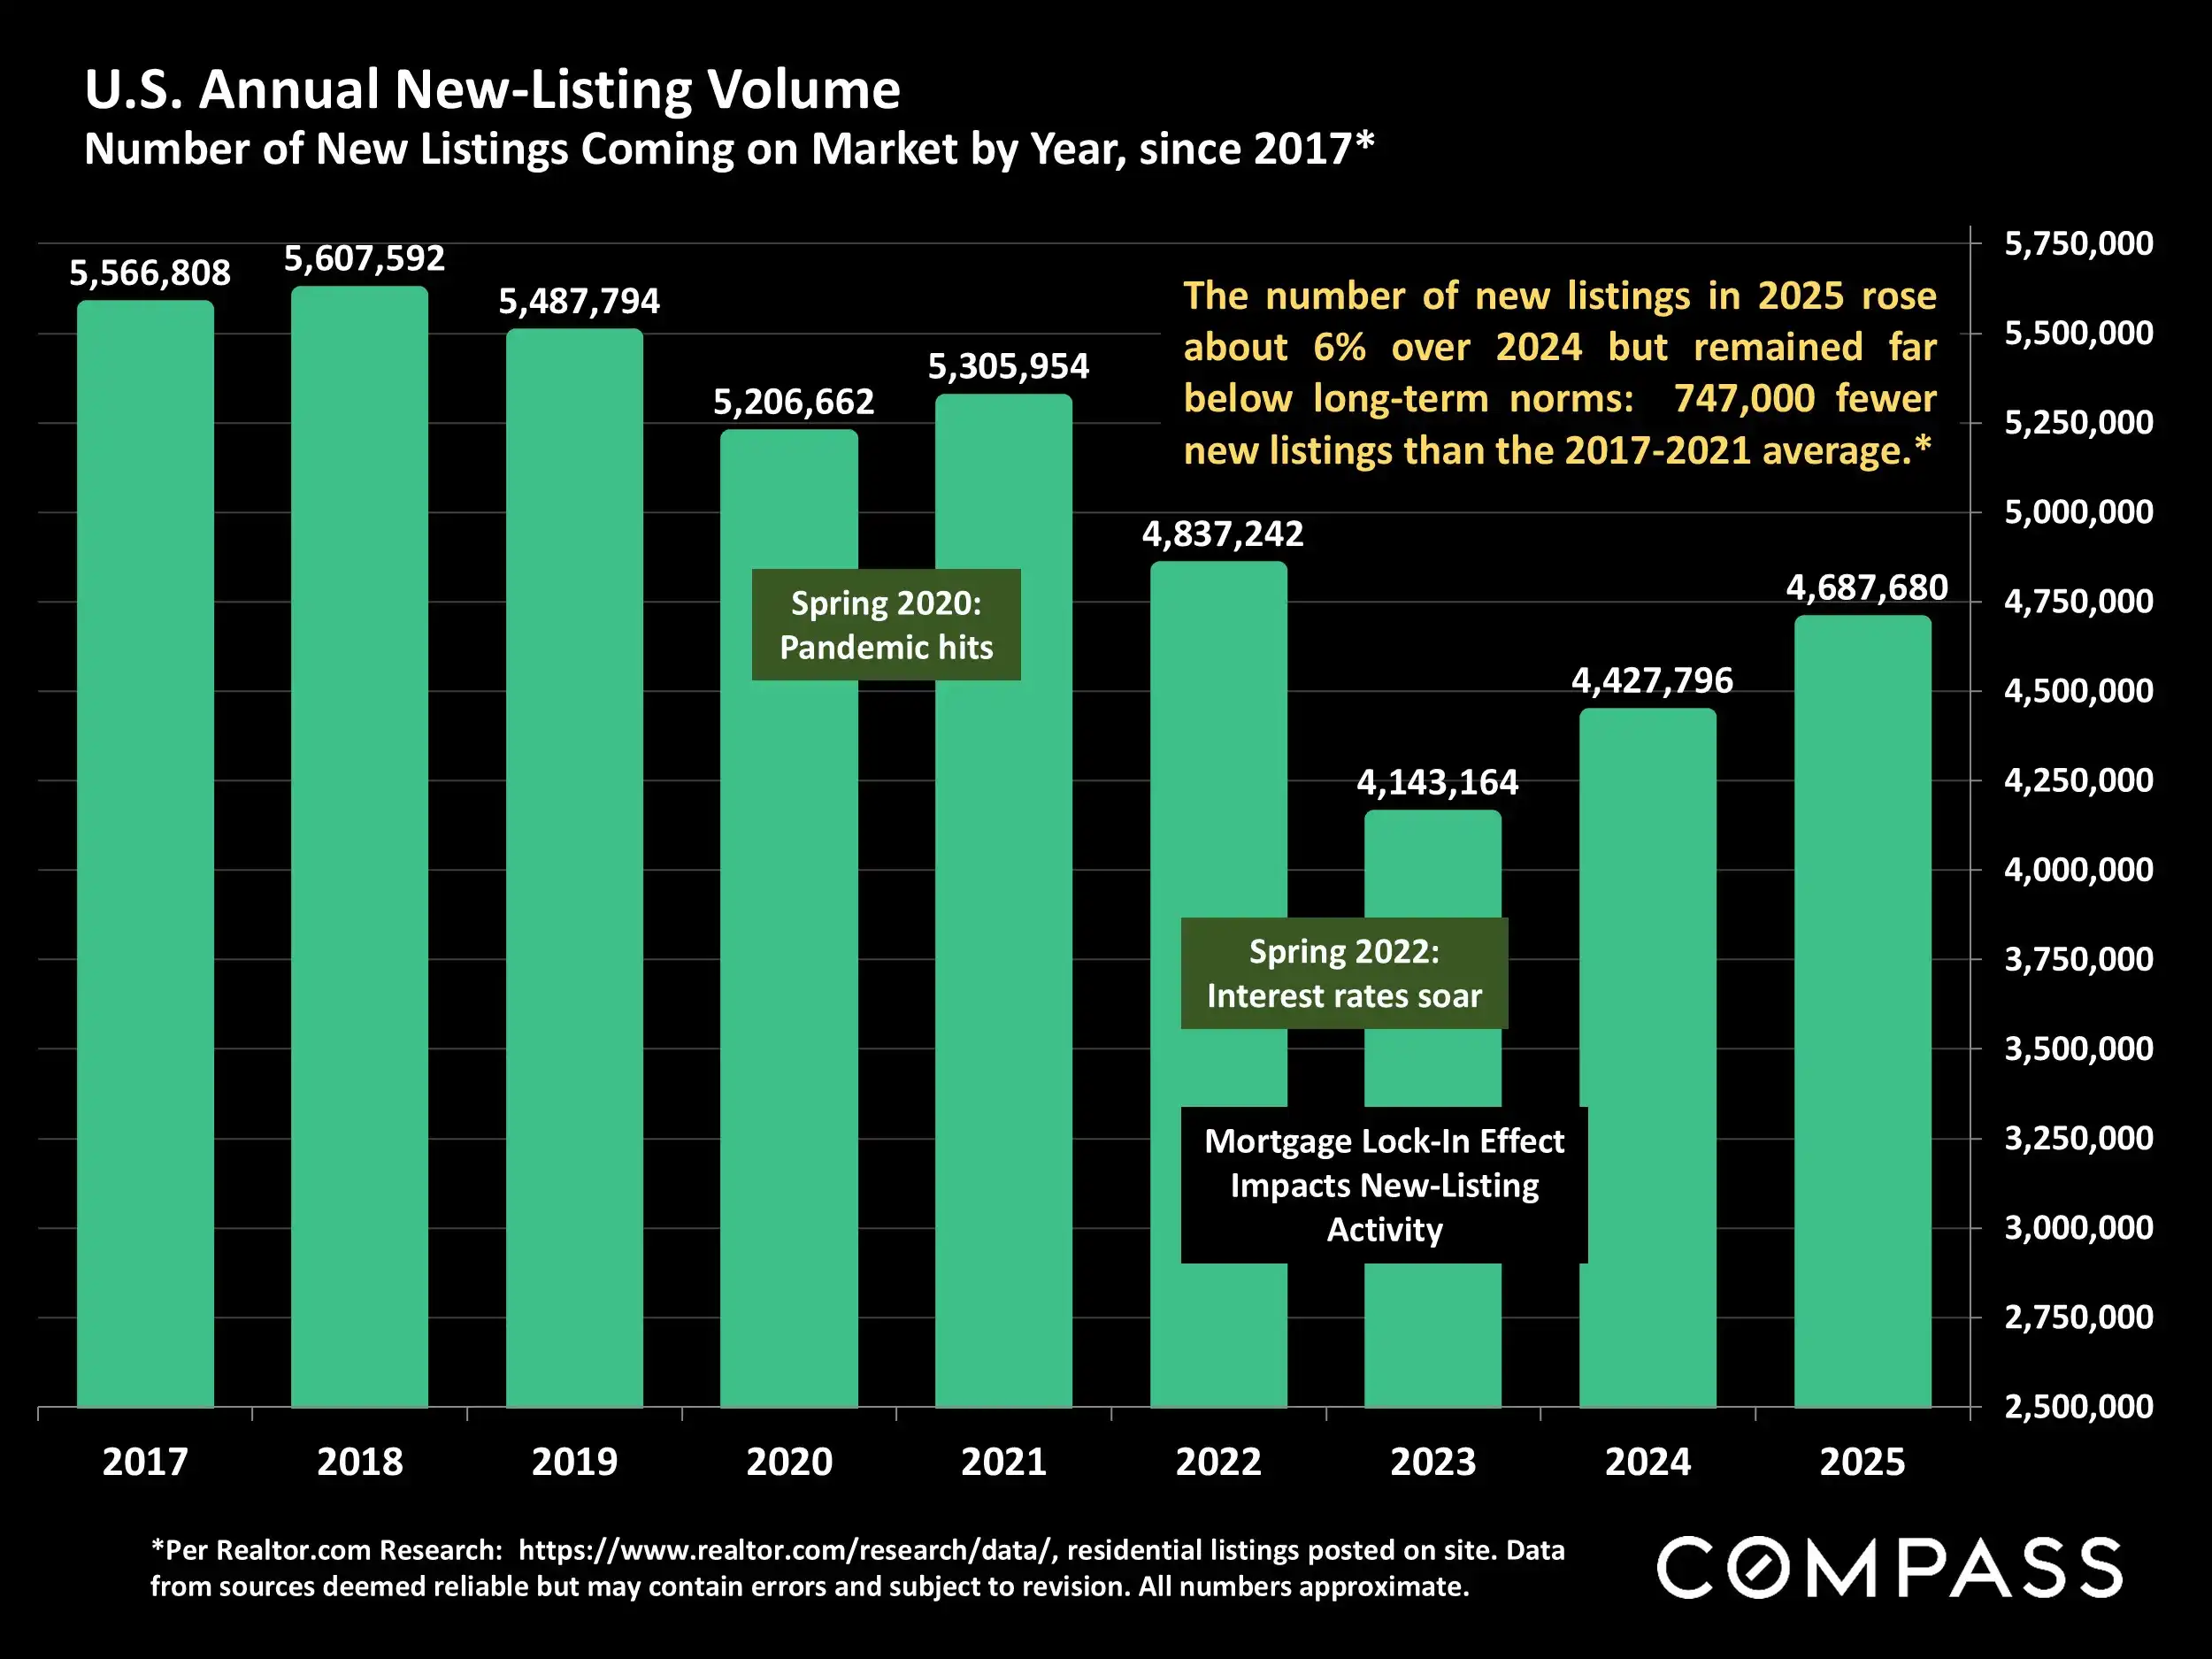
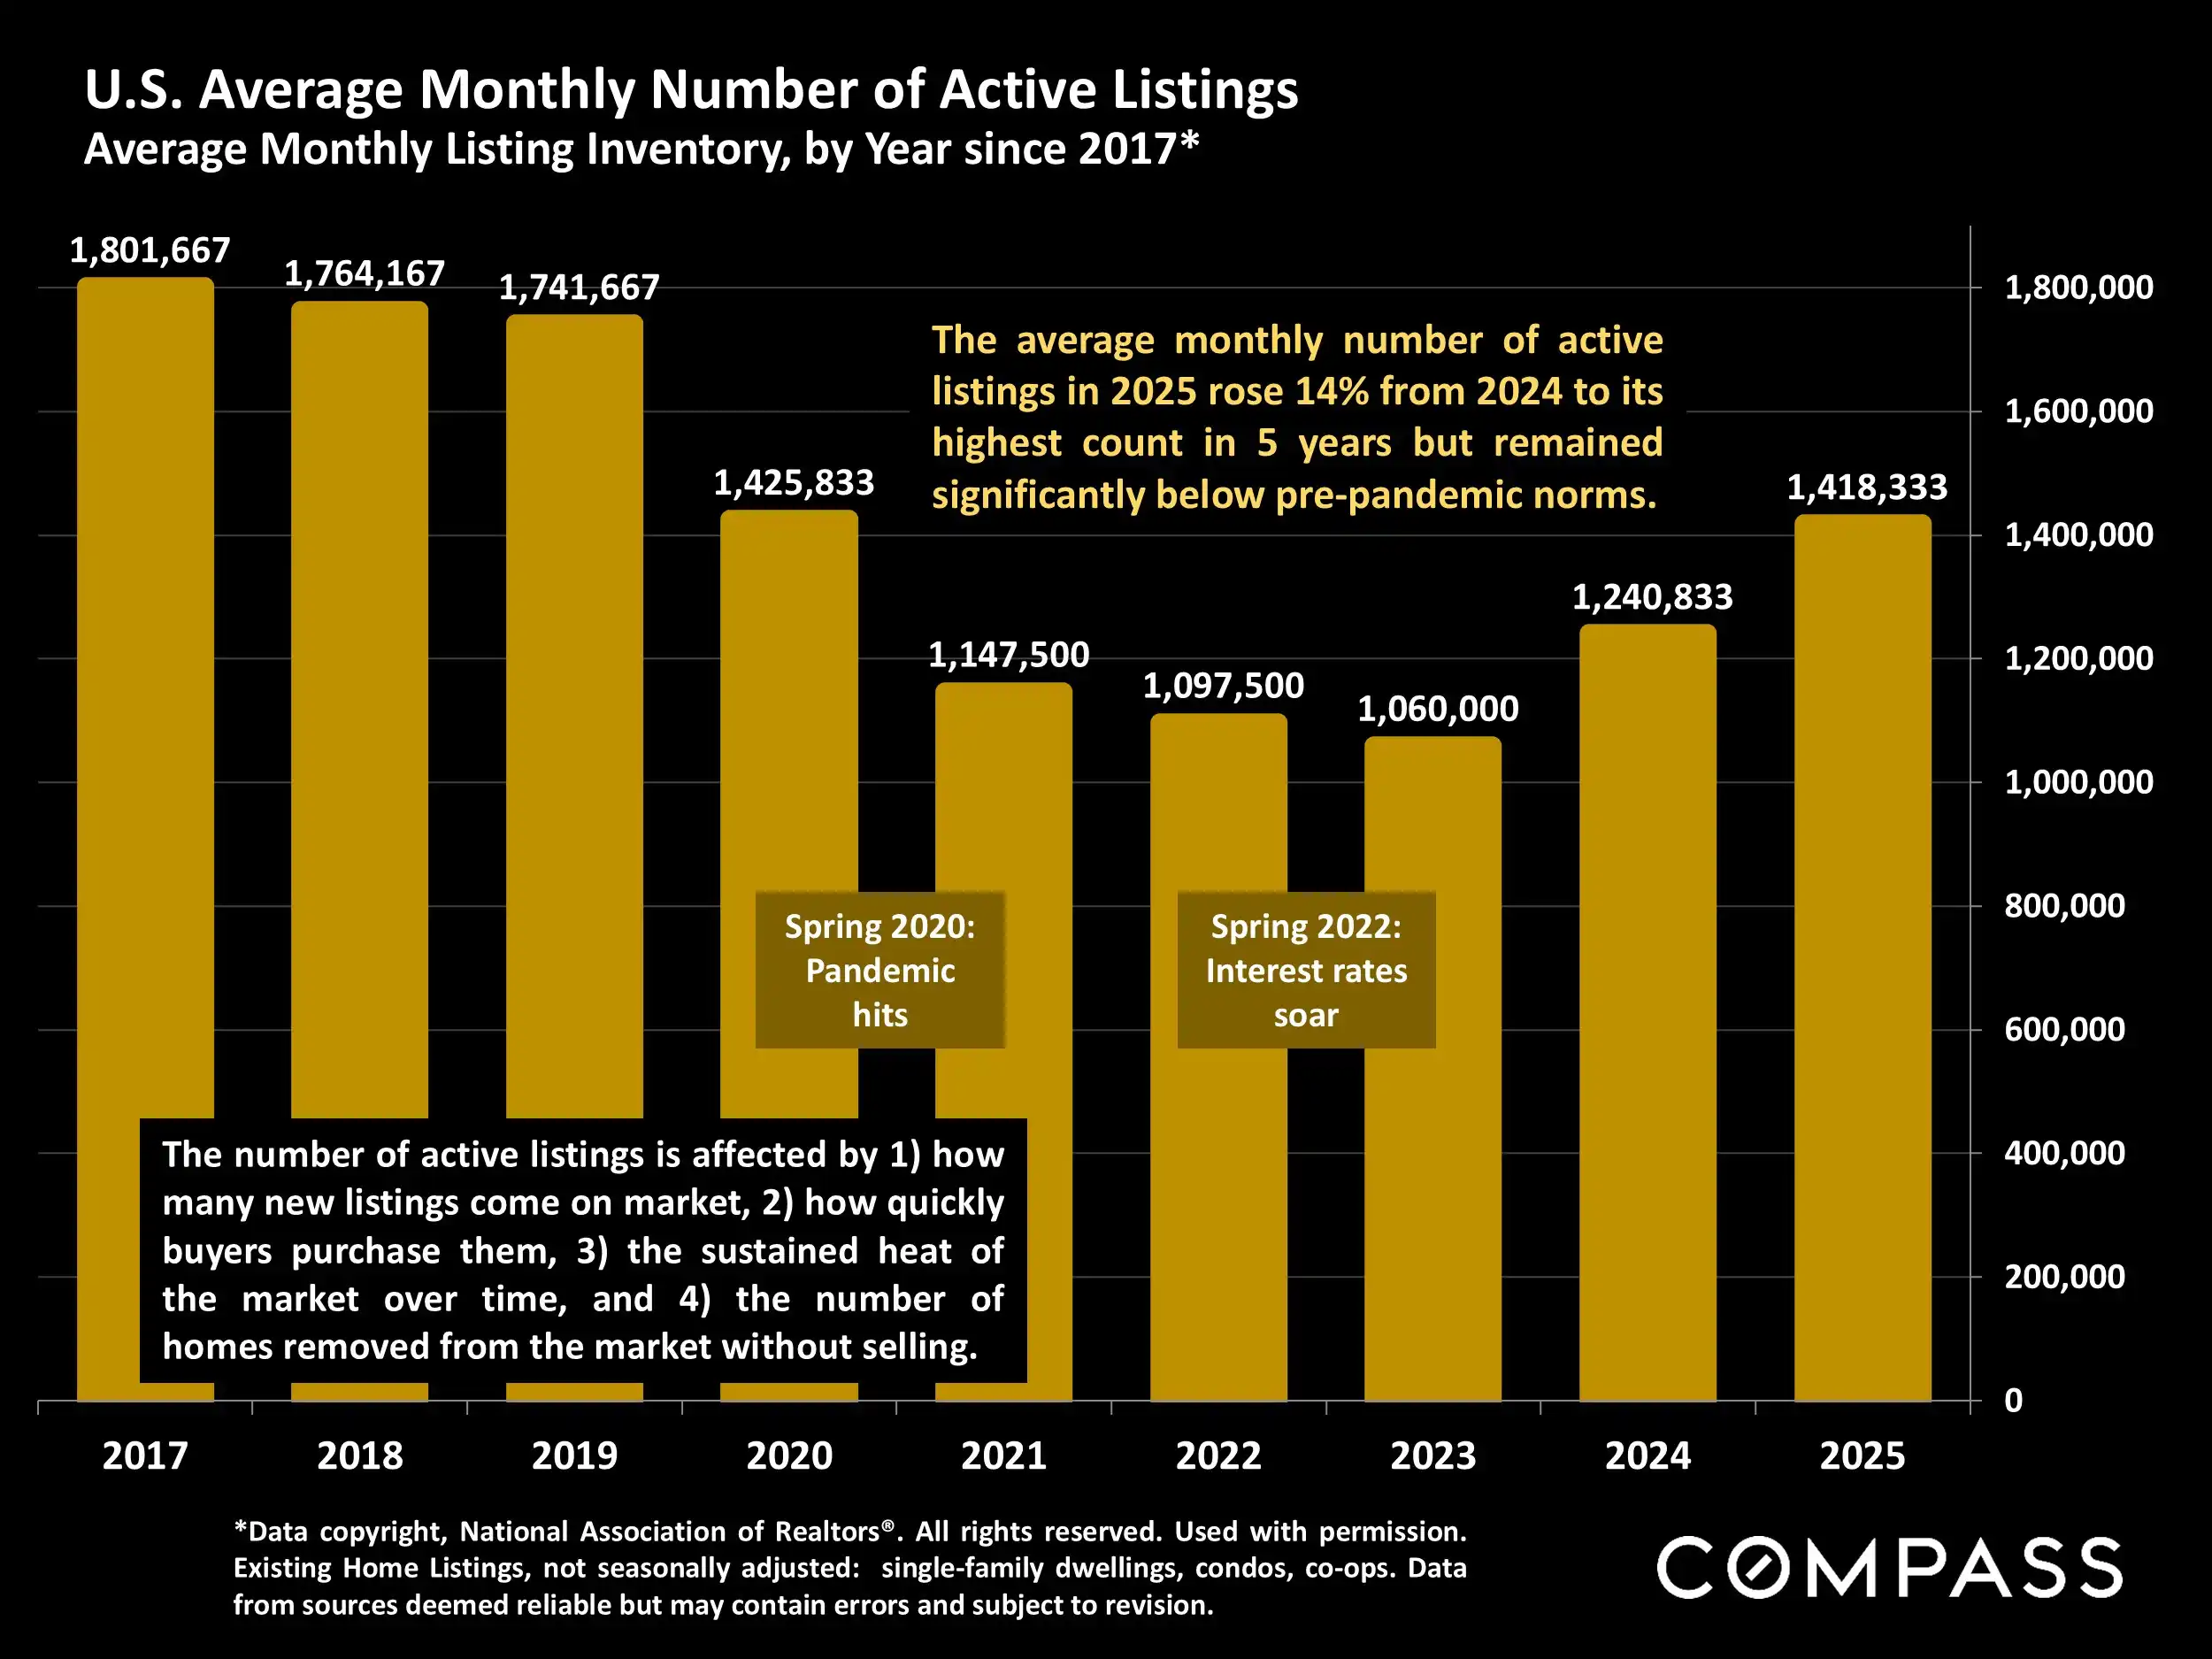
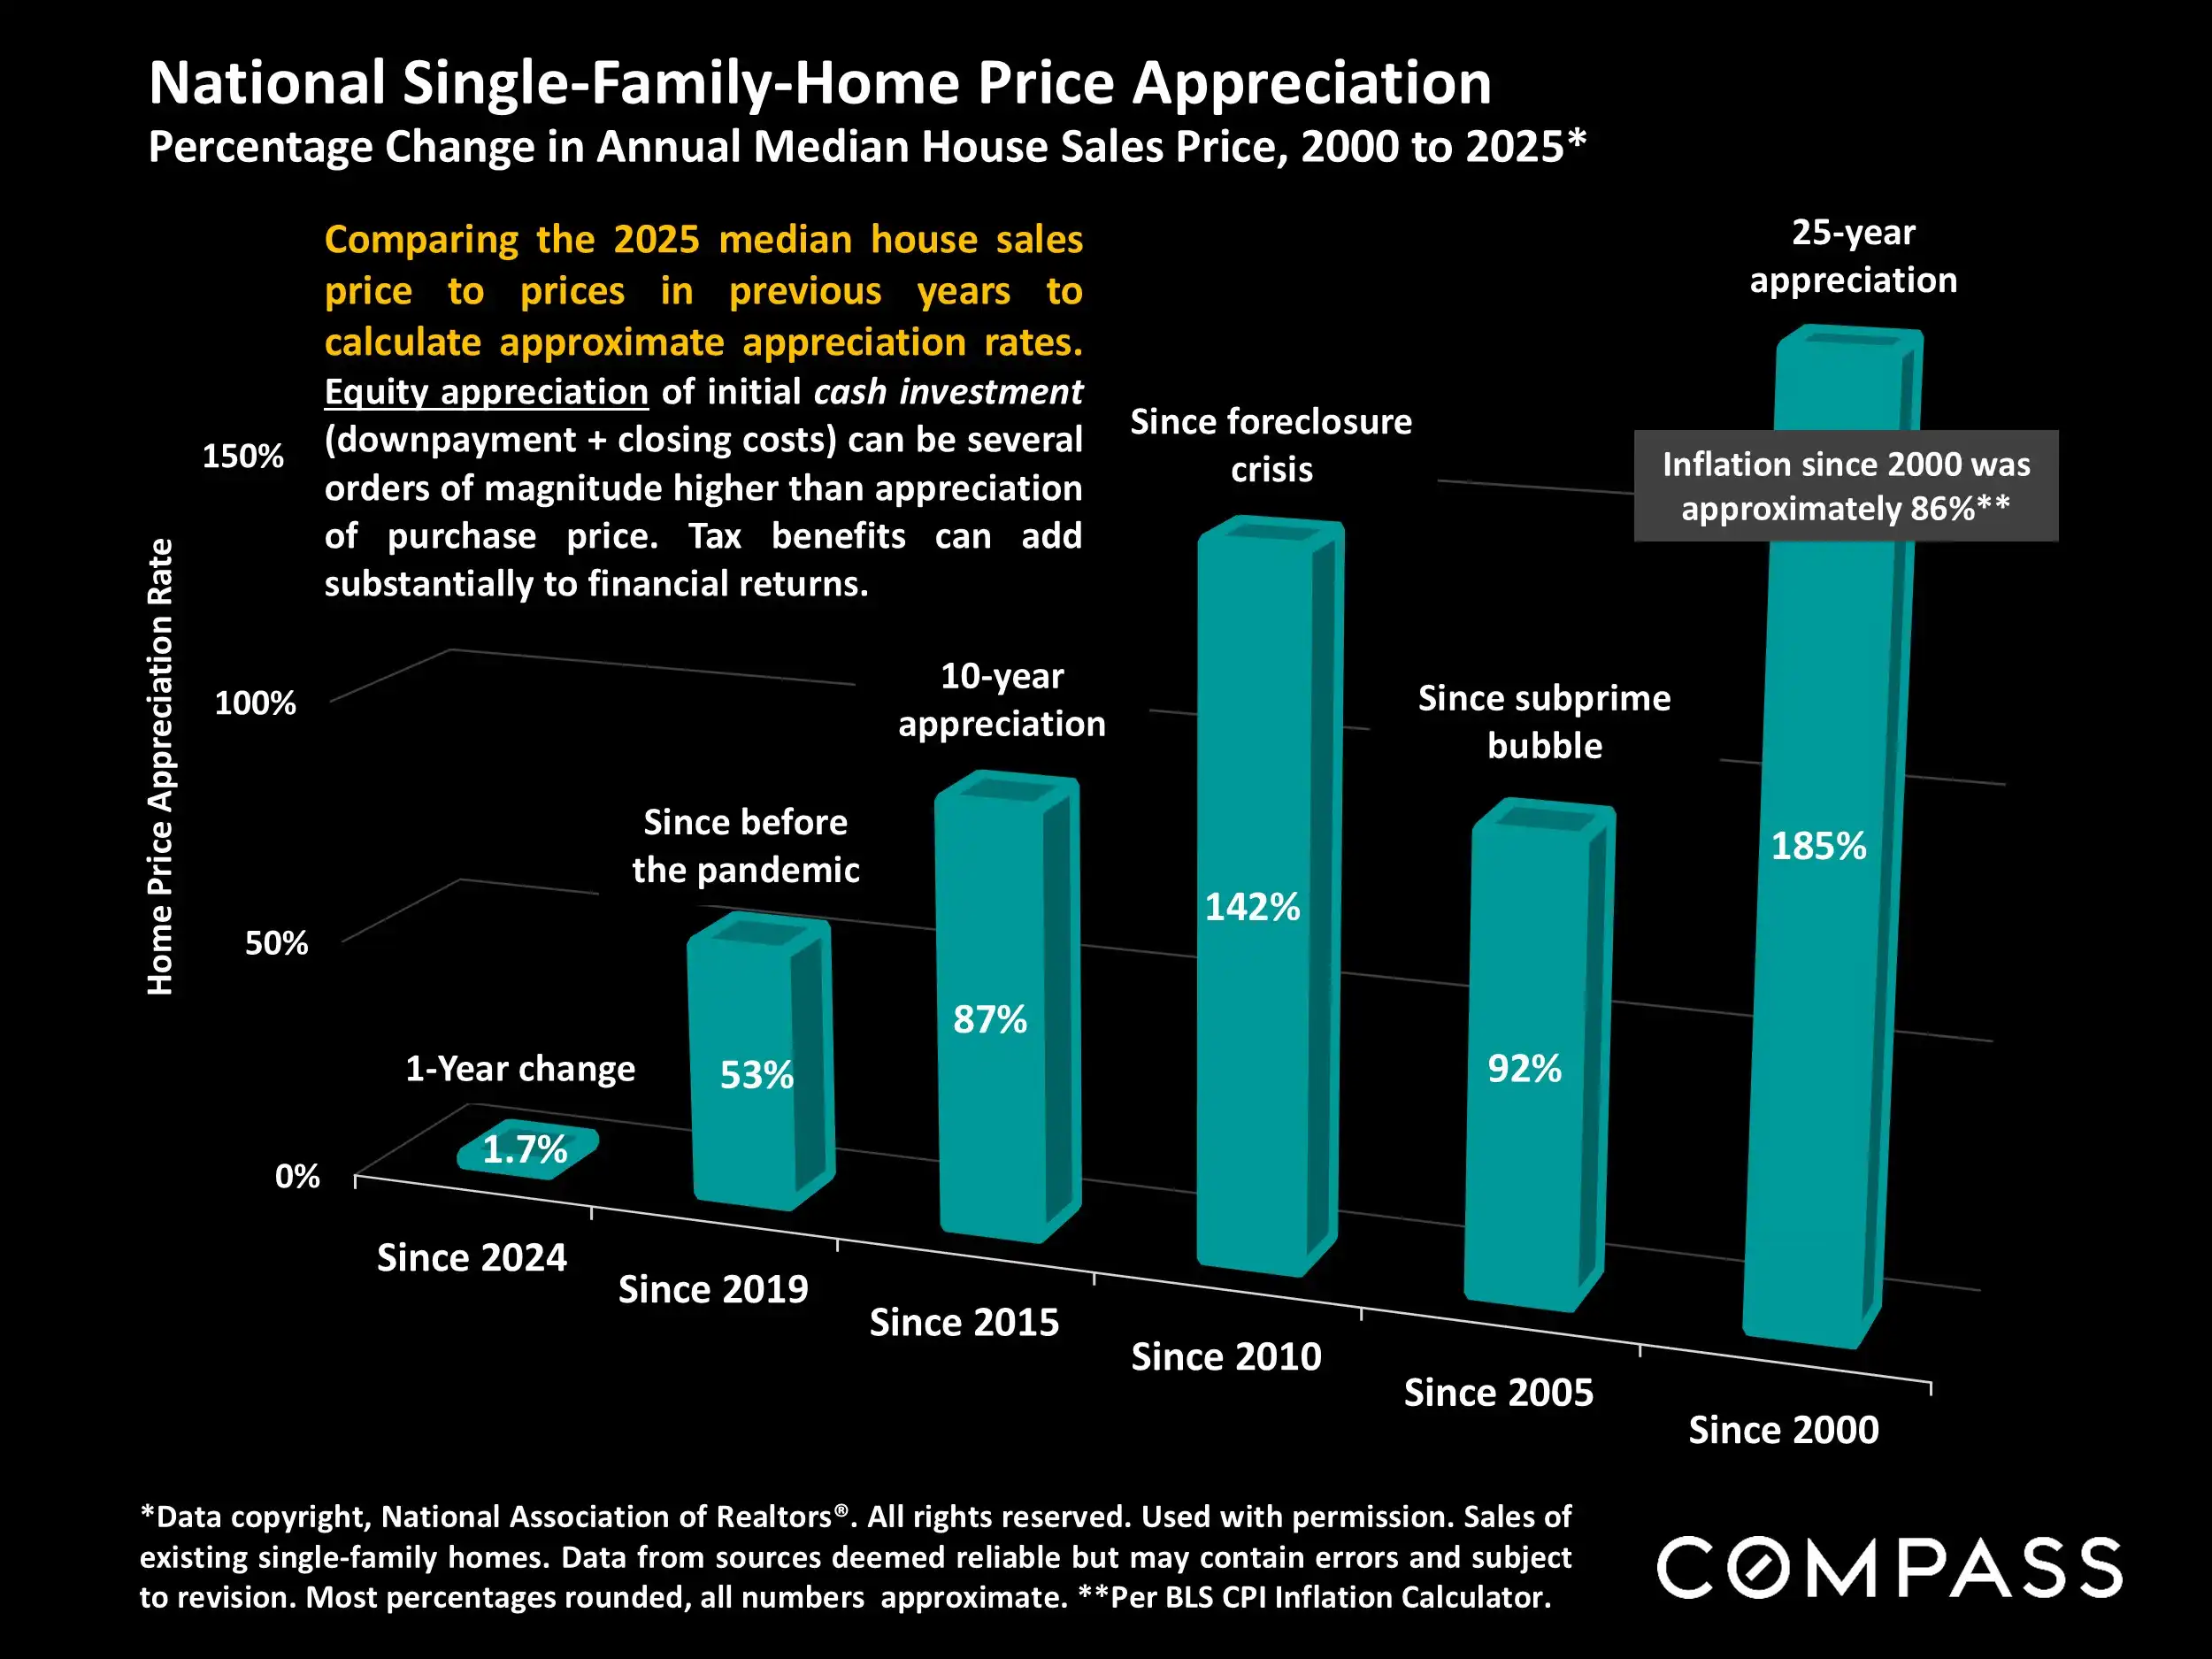
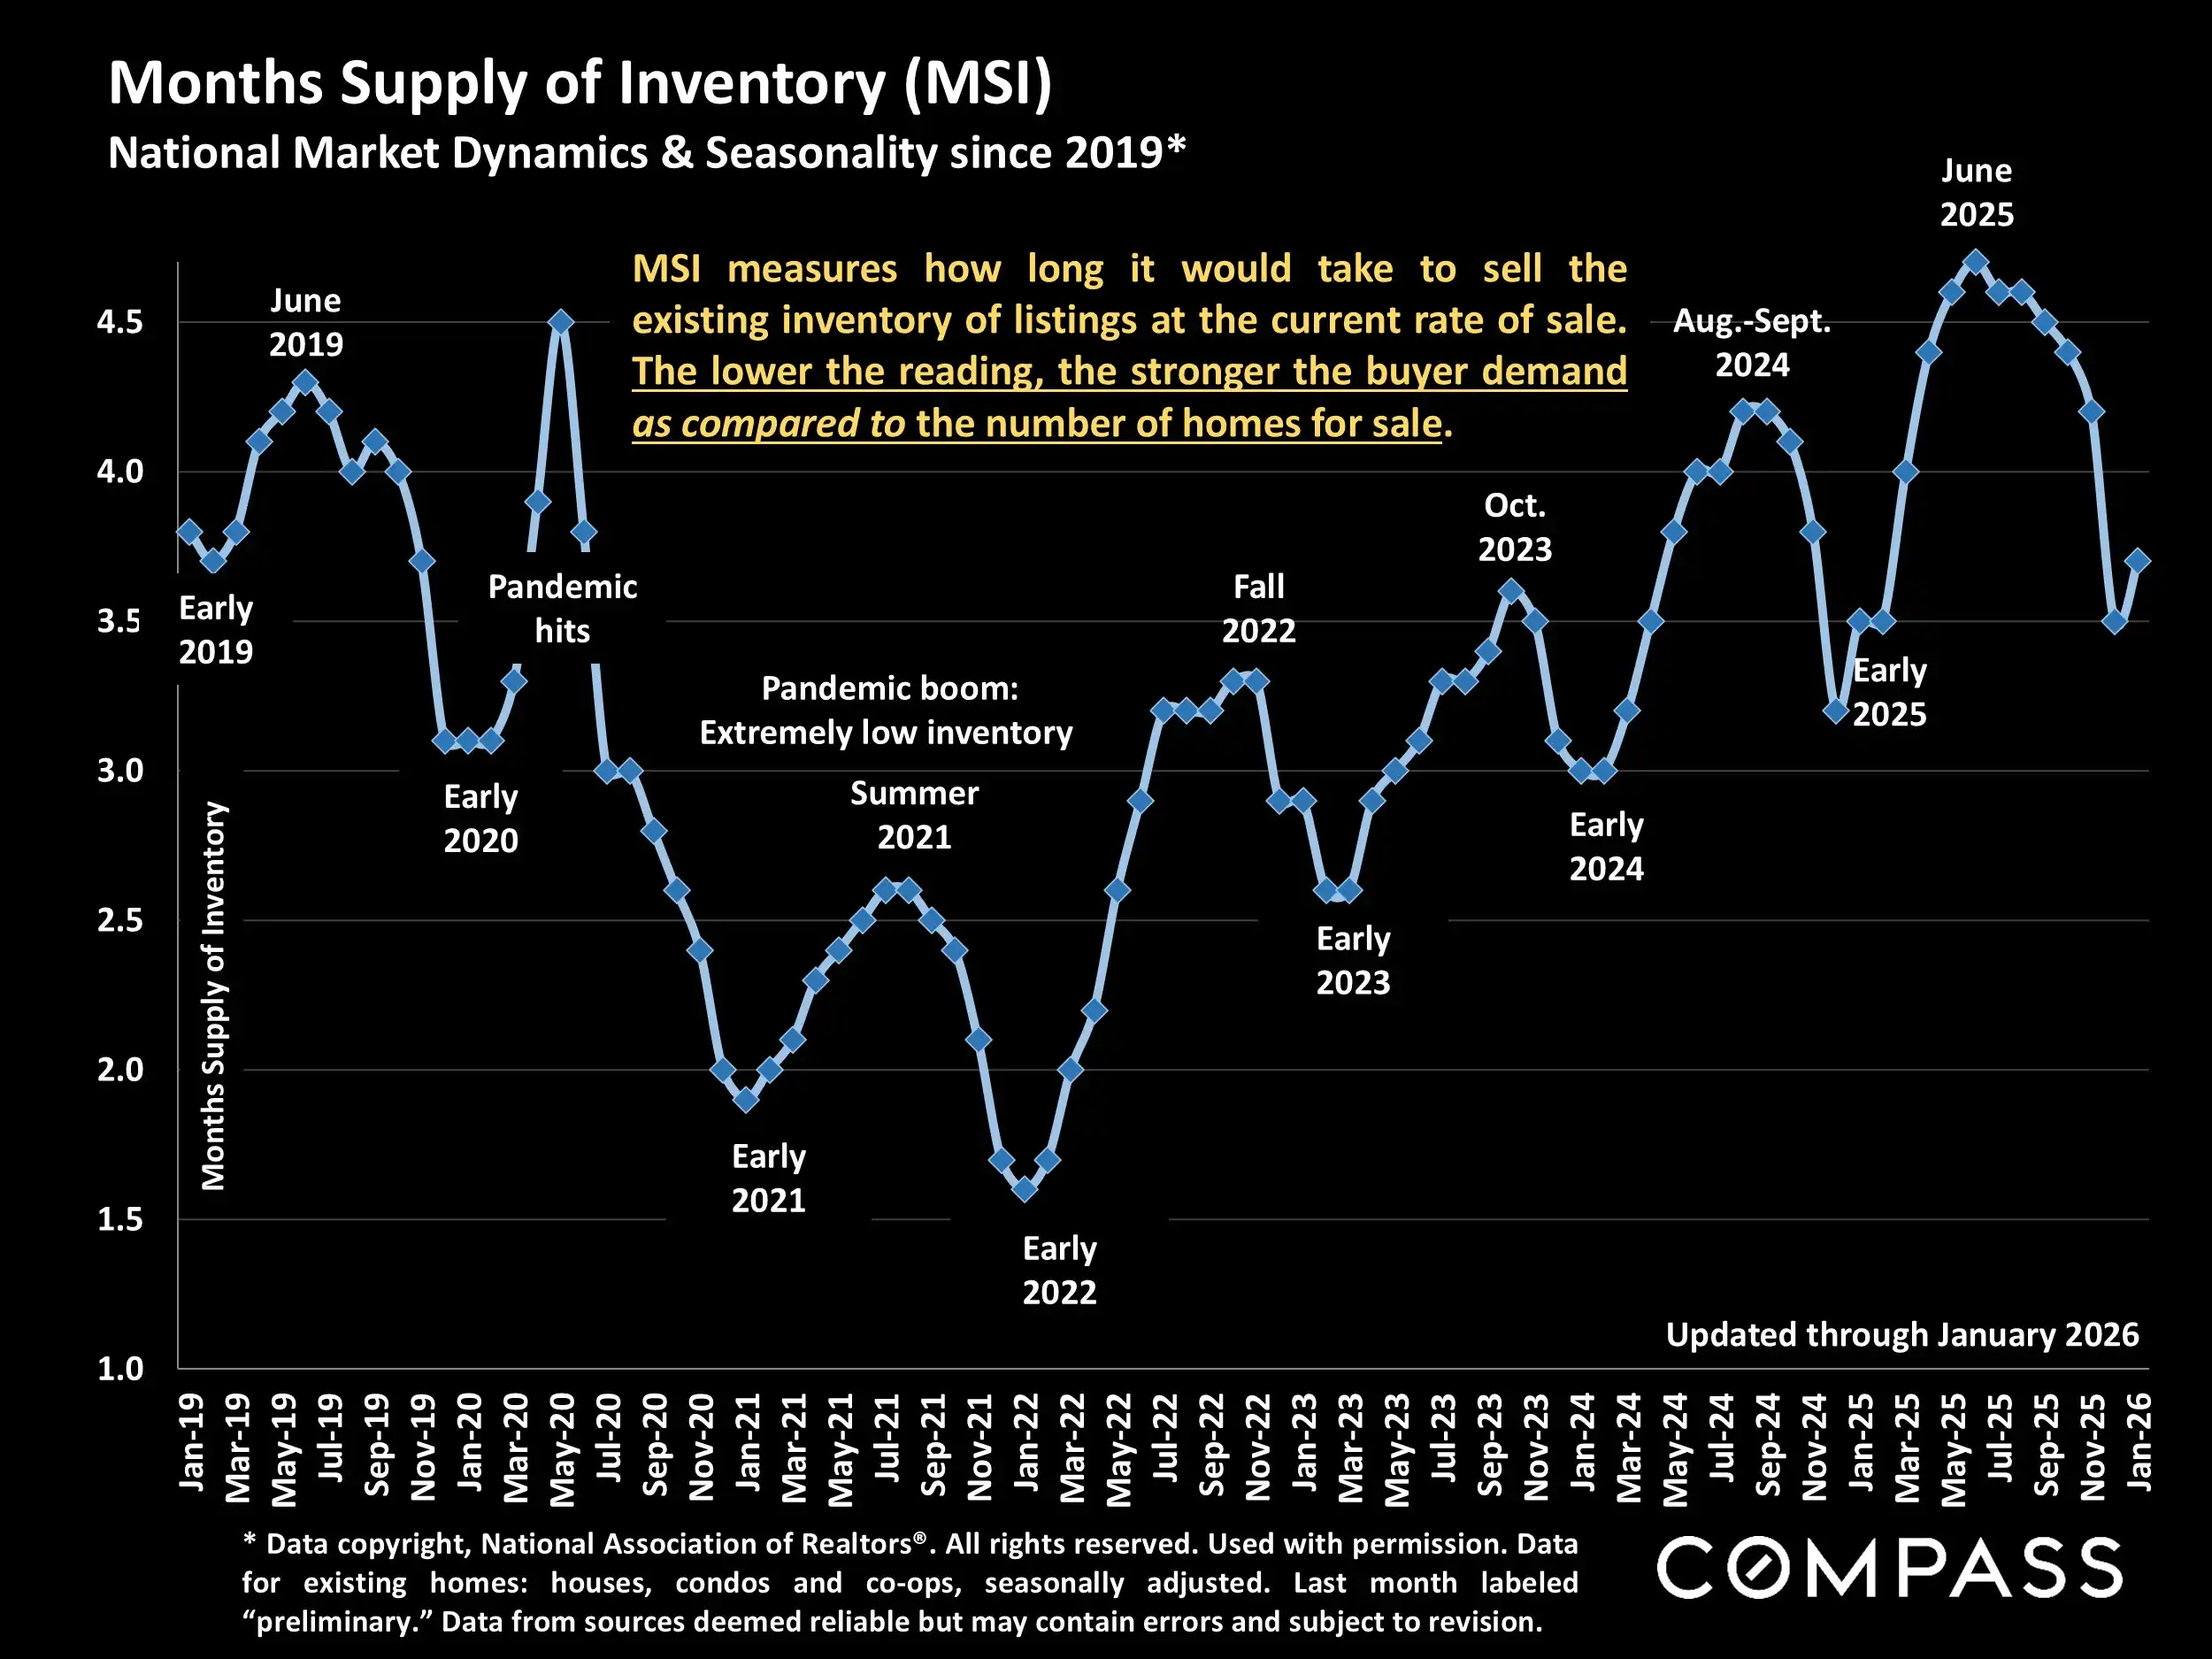
Home prices remained resilient nationally, although appreciation varied by region. The Northeast and Midwest posted the strongest annual gains, while the South saw more modest growth and the West remained essentially flat. Inventory also improved, with both new listings and active listings rising from 2024 levels, although supply remained below pre-pandemic norms in many markets.
Overall, the January 2026 housing market reflects a gradual shift toward better balance. Buyers are seeing more options than they had during the tightest inventory years, while sellers continue to benefit from historically strong long-term home values. For both buyers and sellers, the key takeaway is that market conditions are improving, but strategy still matters. Pricing, preparation, timing, and local market knowledge remain essential as 2026 begins.
Market at a Glance
Mortgage Rates: Rates moved lower heading into January, helping improve buyer confidence.
Sales Activity: December sales rose sharply from November and were up year over year.
Home Prices: National home prices remained resilient, with appreciation varying by region.
Inventory: New listings and active listings improved from 2024 but remained below pre-pandemic norms.
Buyer Demand: Demand showed signs of strengthening as affordability conditions modestly improved.
Regional Trends: The Northeast and Midwest saw the strongest price gains, while the West remained mostly flat.
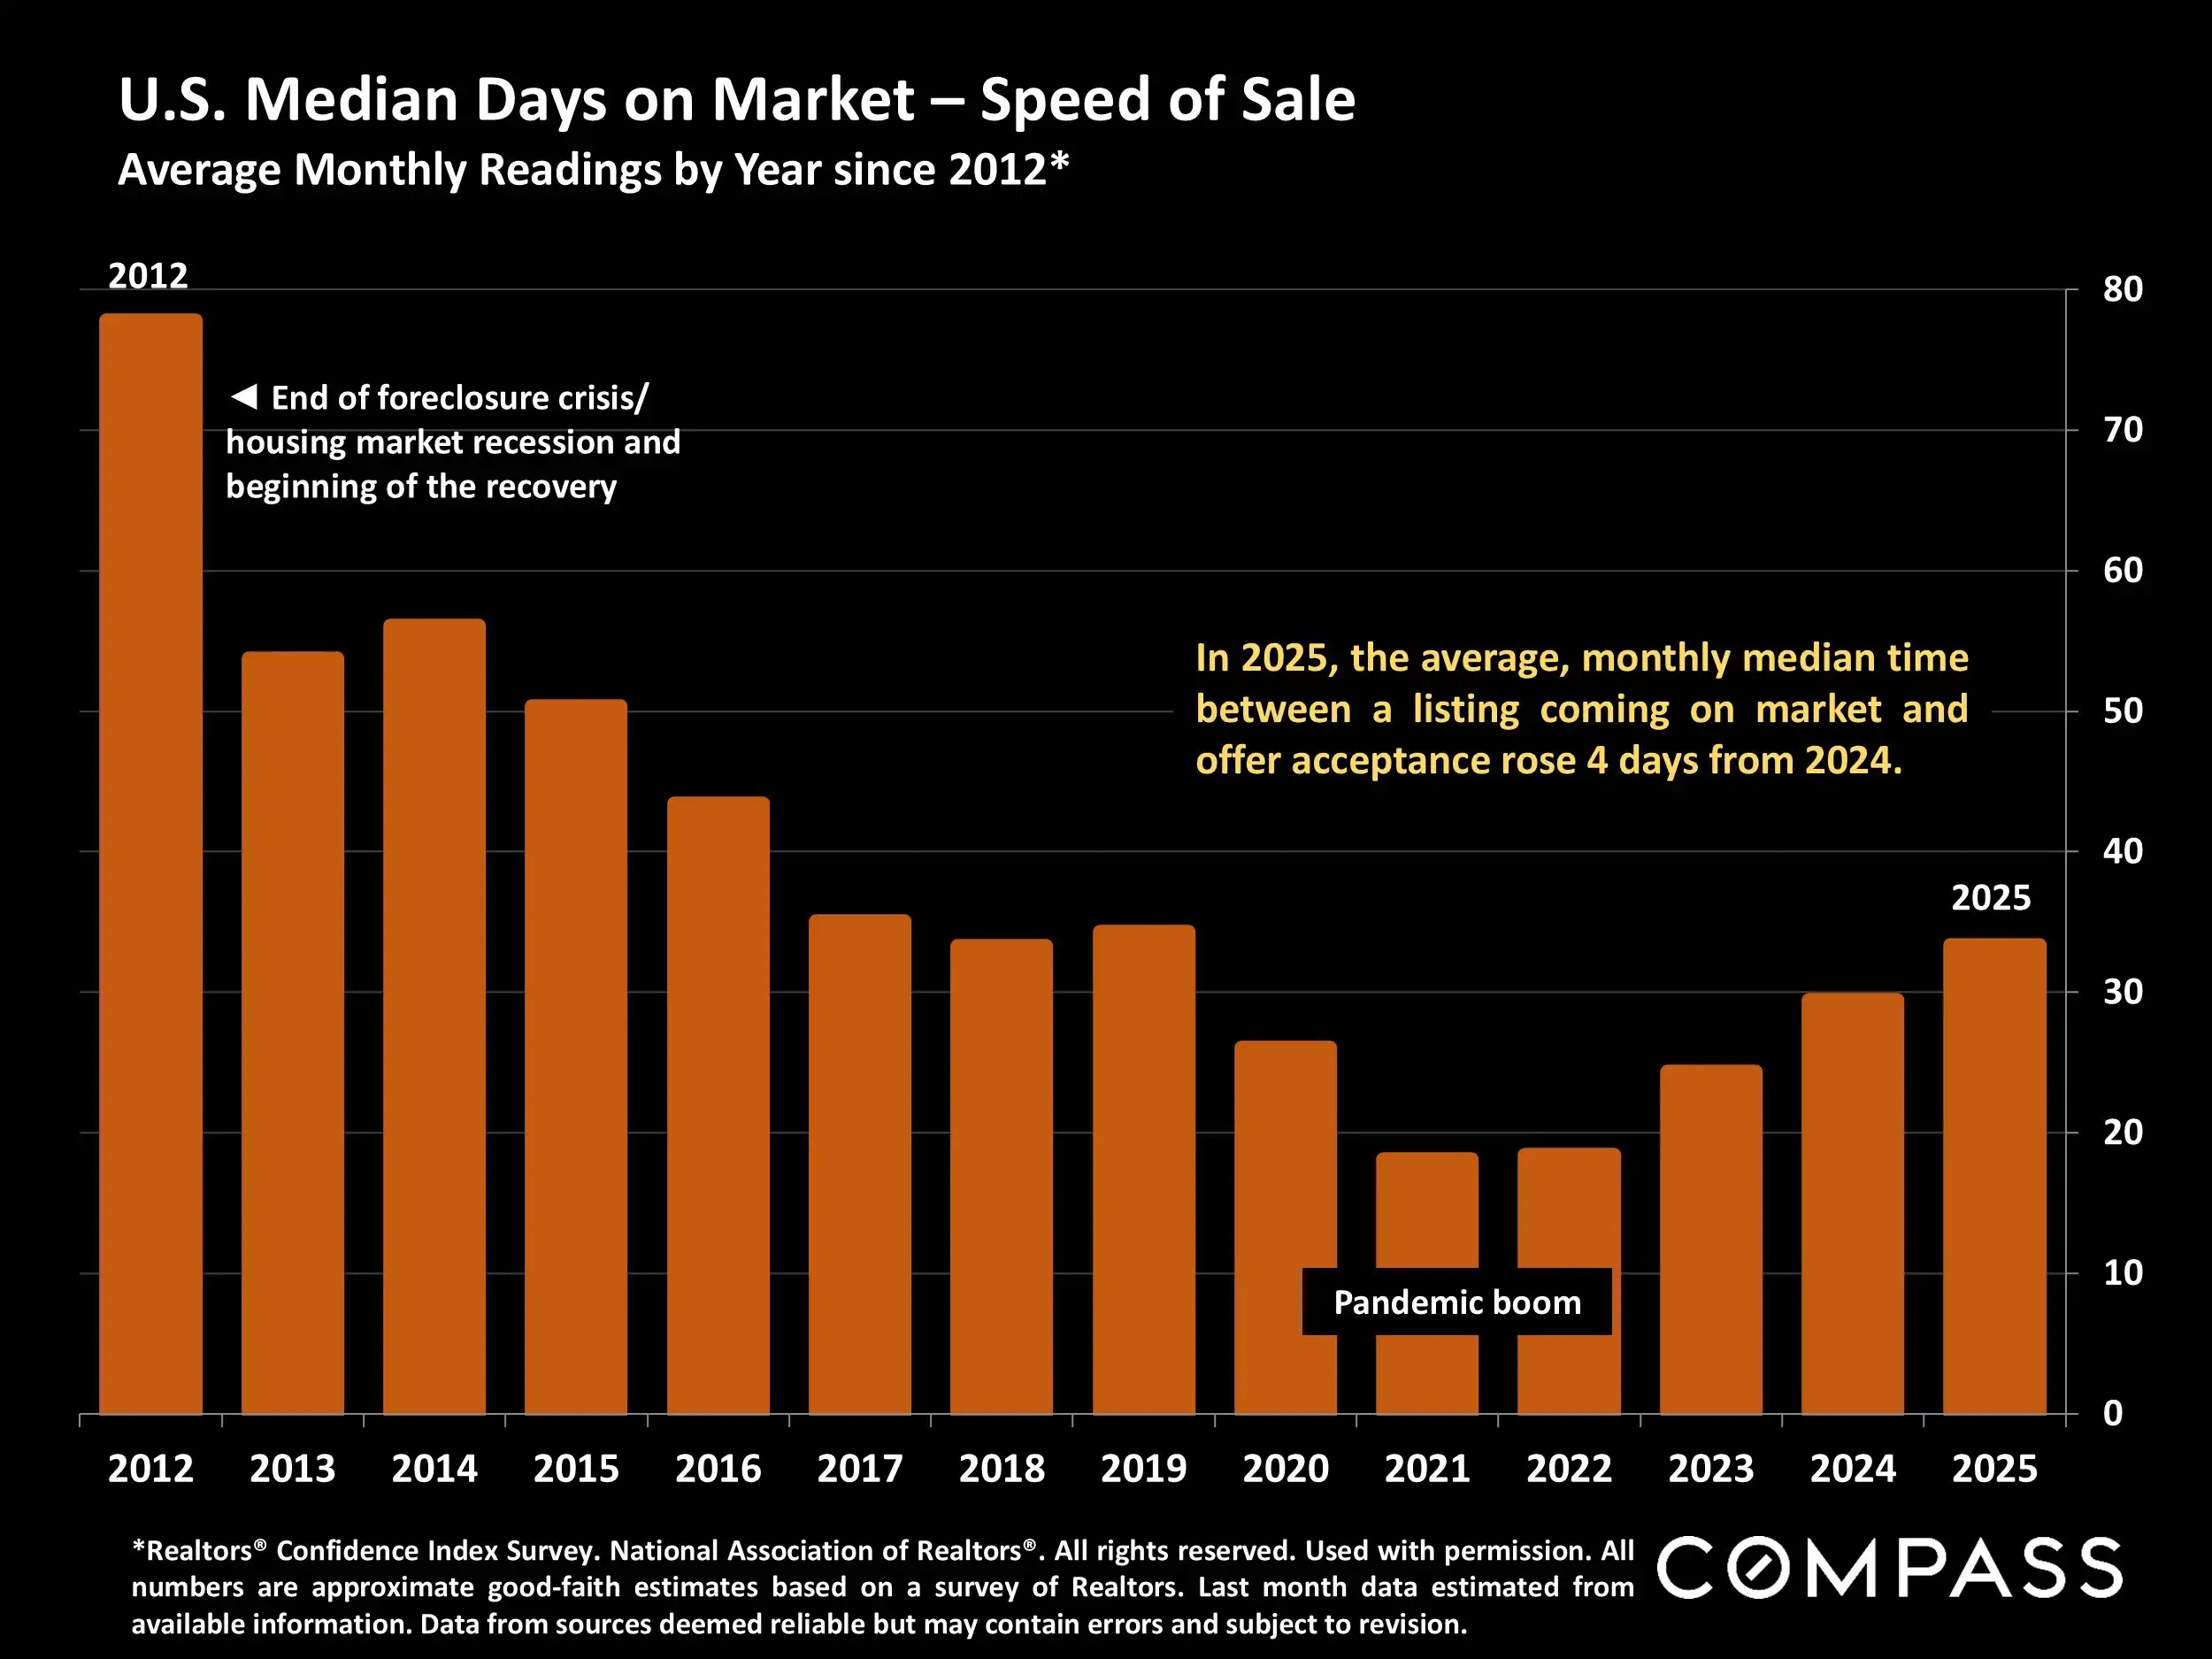
Market Pace: Homes took slightly longer to sell than in 2024, giving buyers more breathing room.
2026 Outlook: Lower rates, improving inventory, and renewed buyer activity could support a stronger spring market.
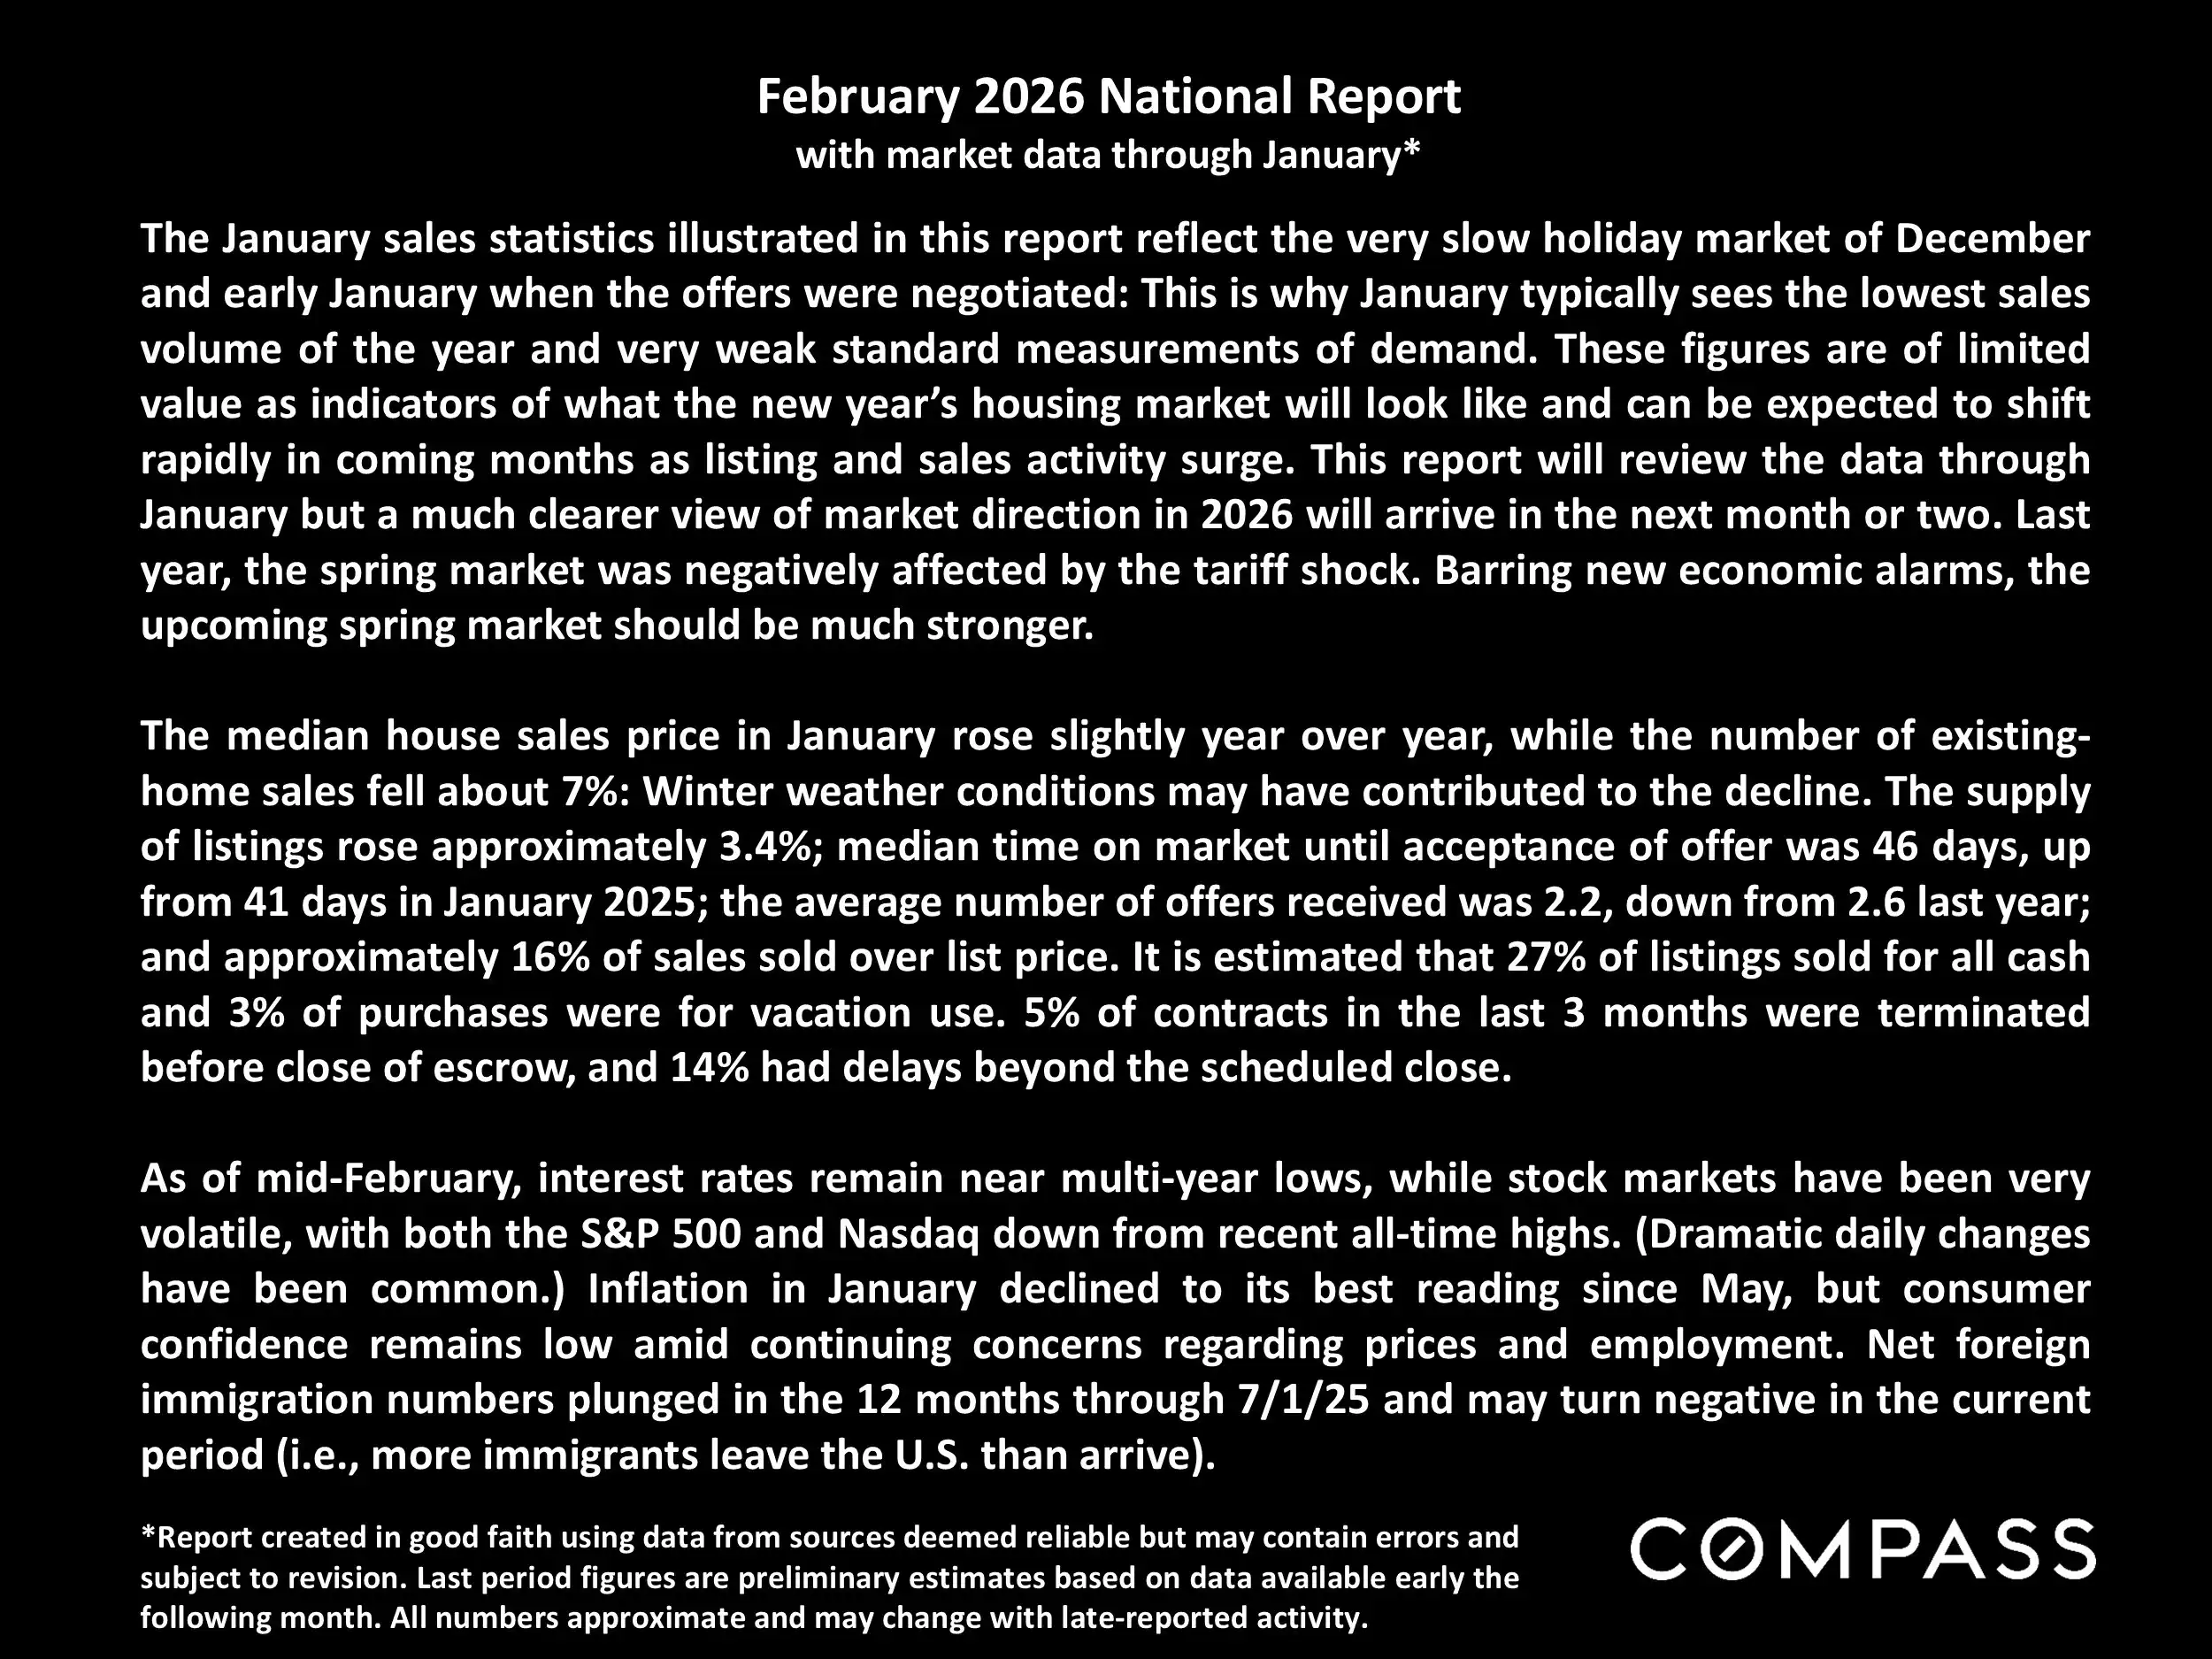
The February 2026 Compass National Real Estate Insights report shows a national housing market still working through normal winter seasonality, while early signs point toward a potentially stronger spring market. Because January sales mostly reflect offers negotiated during the slower holiday period of December and early January, the report notes that January data is often less useful for measuring the full direction of the year.
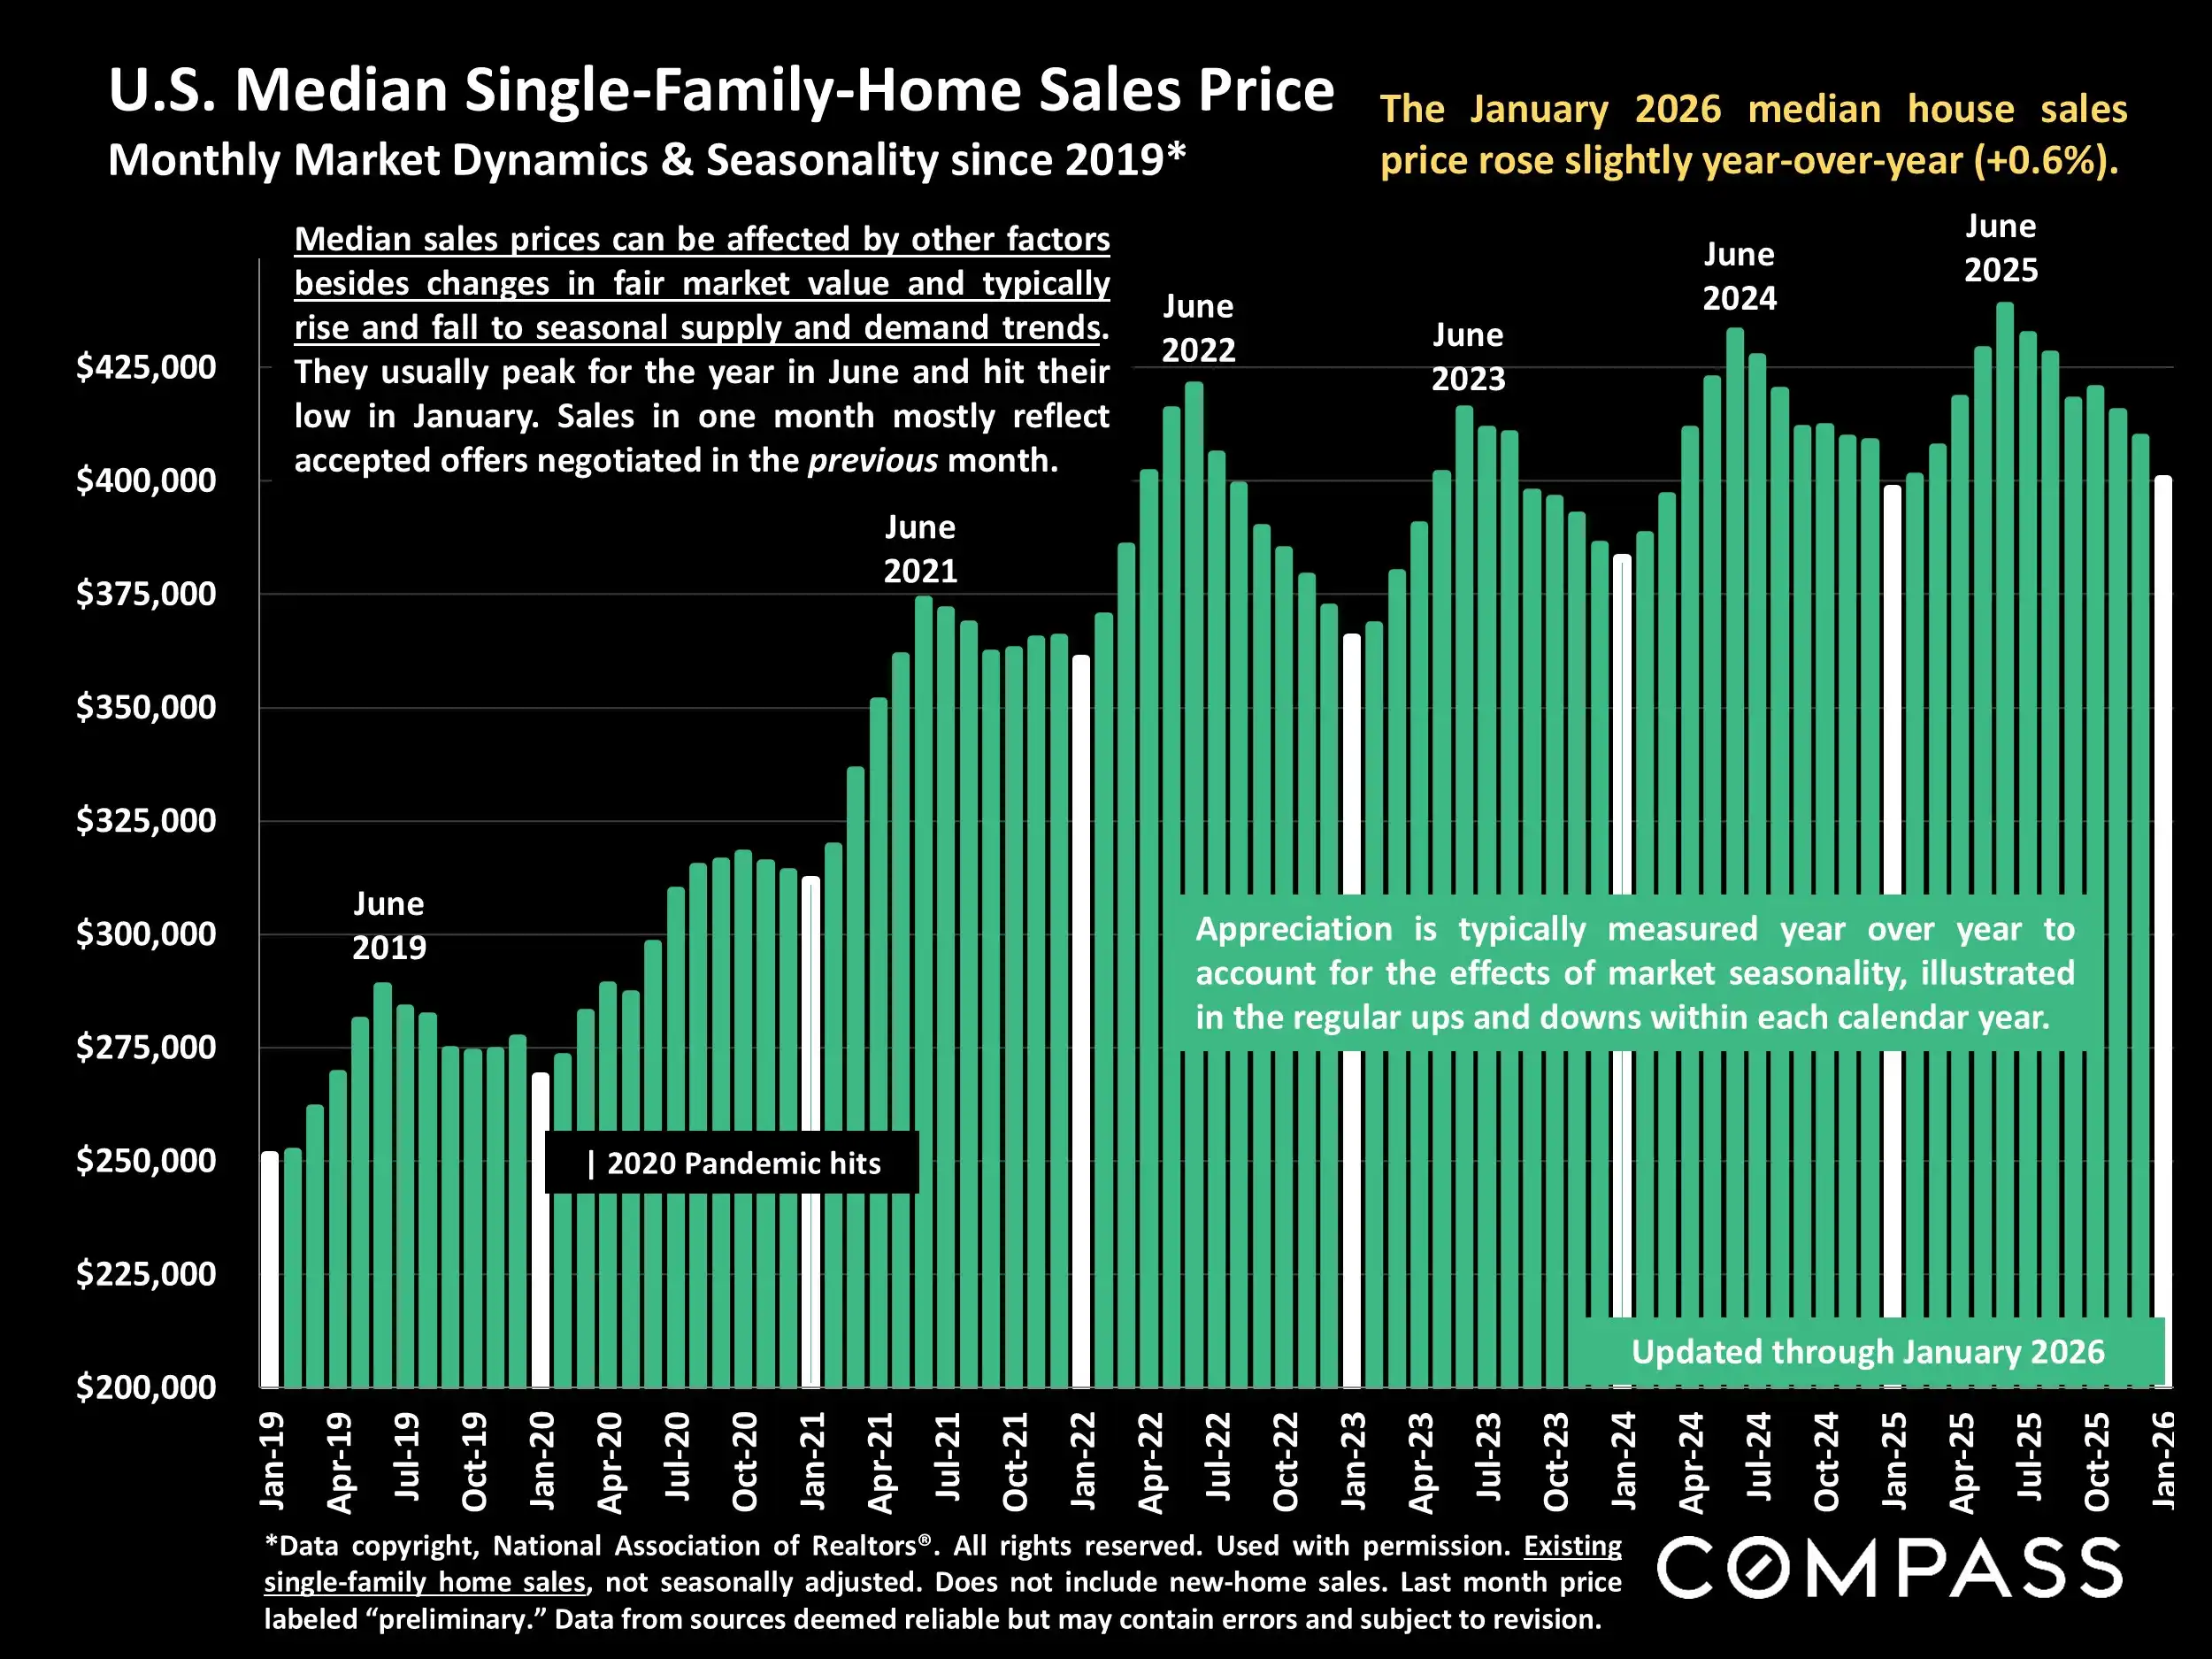
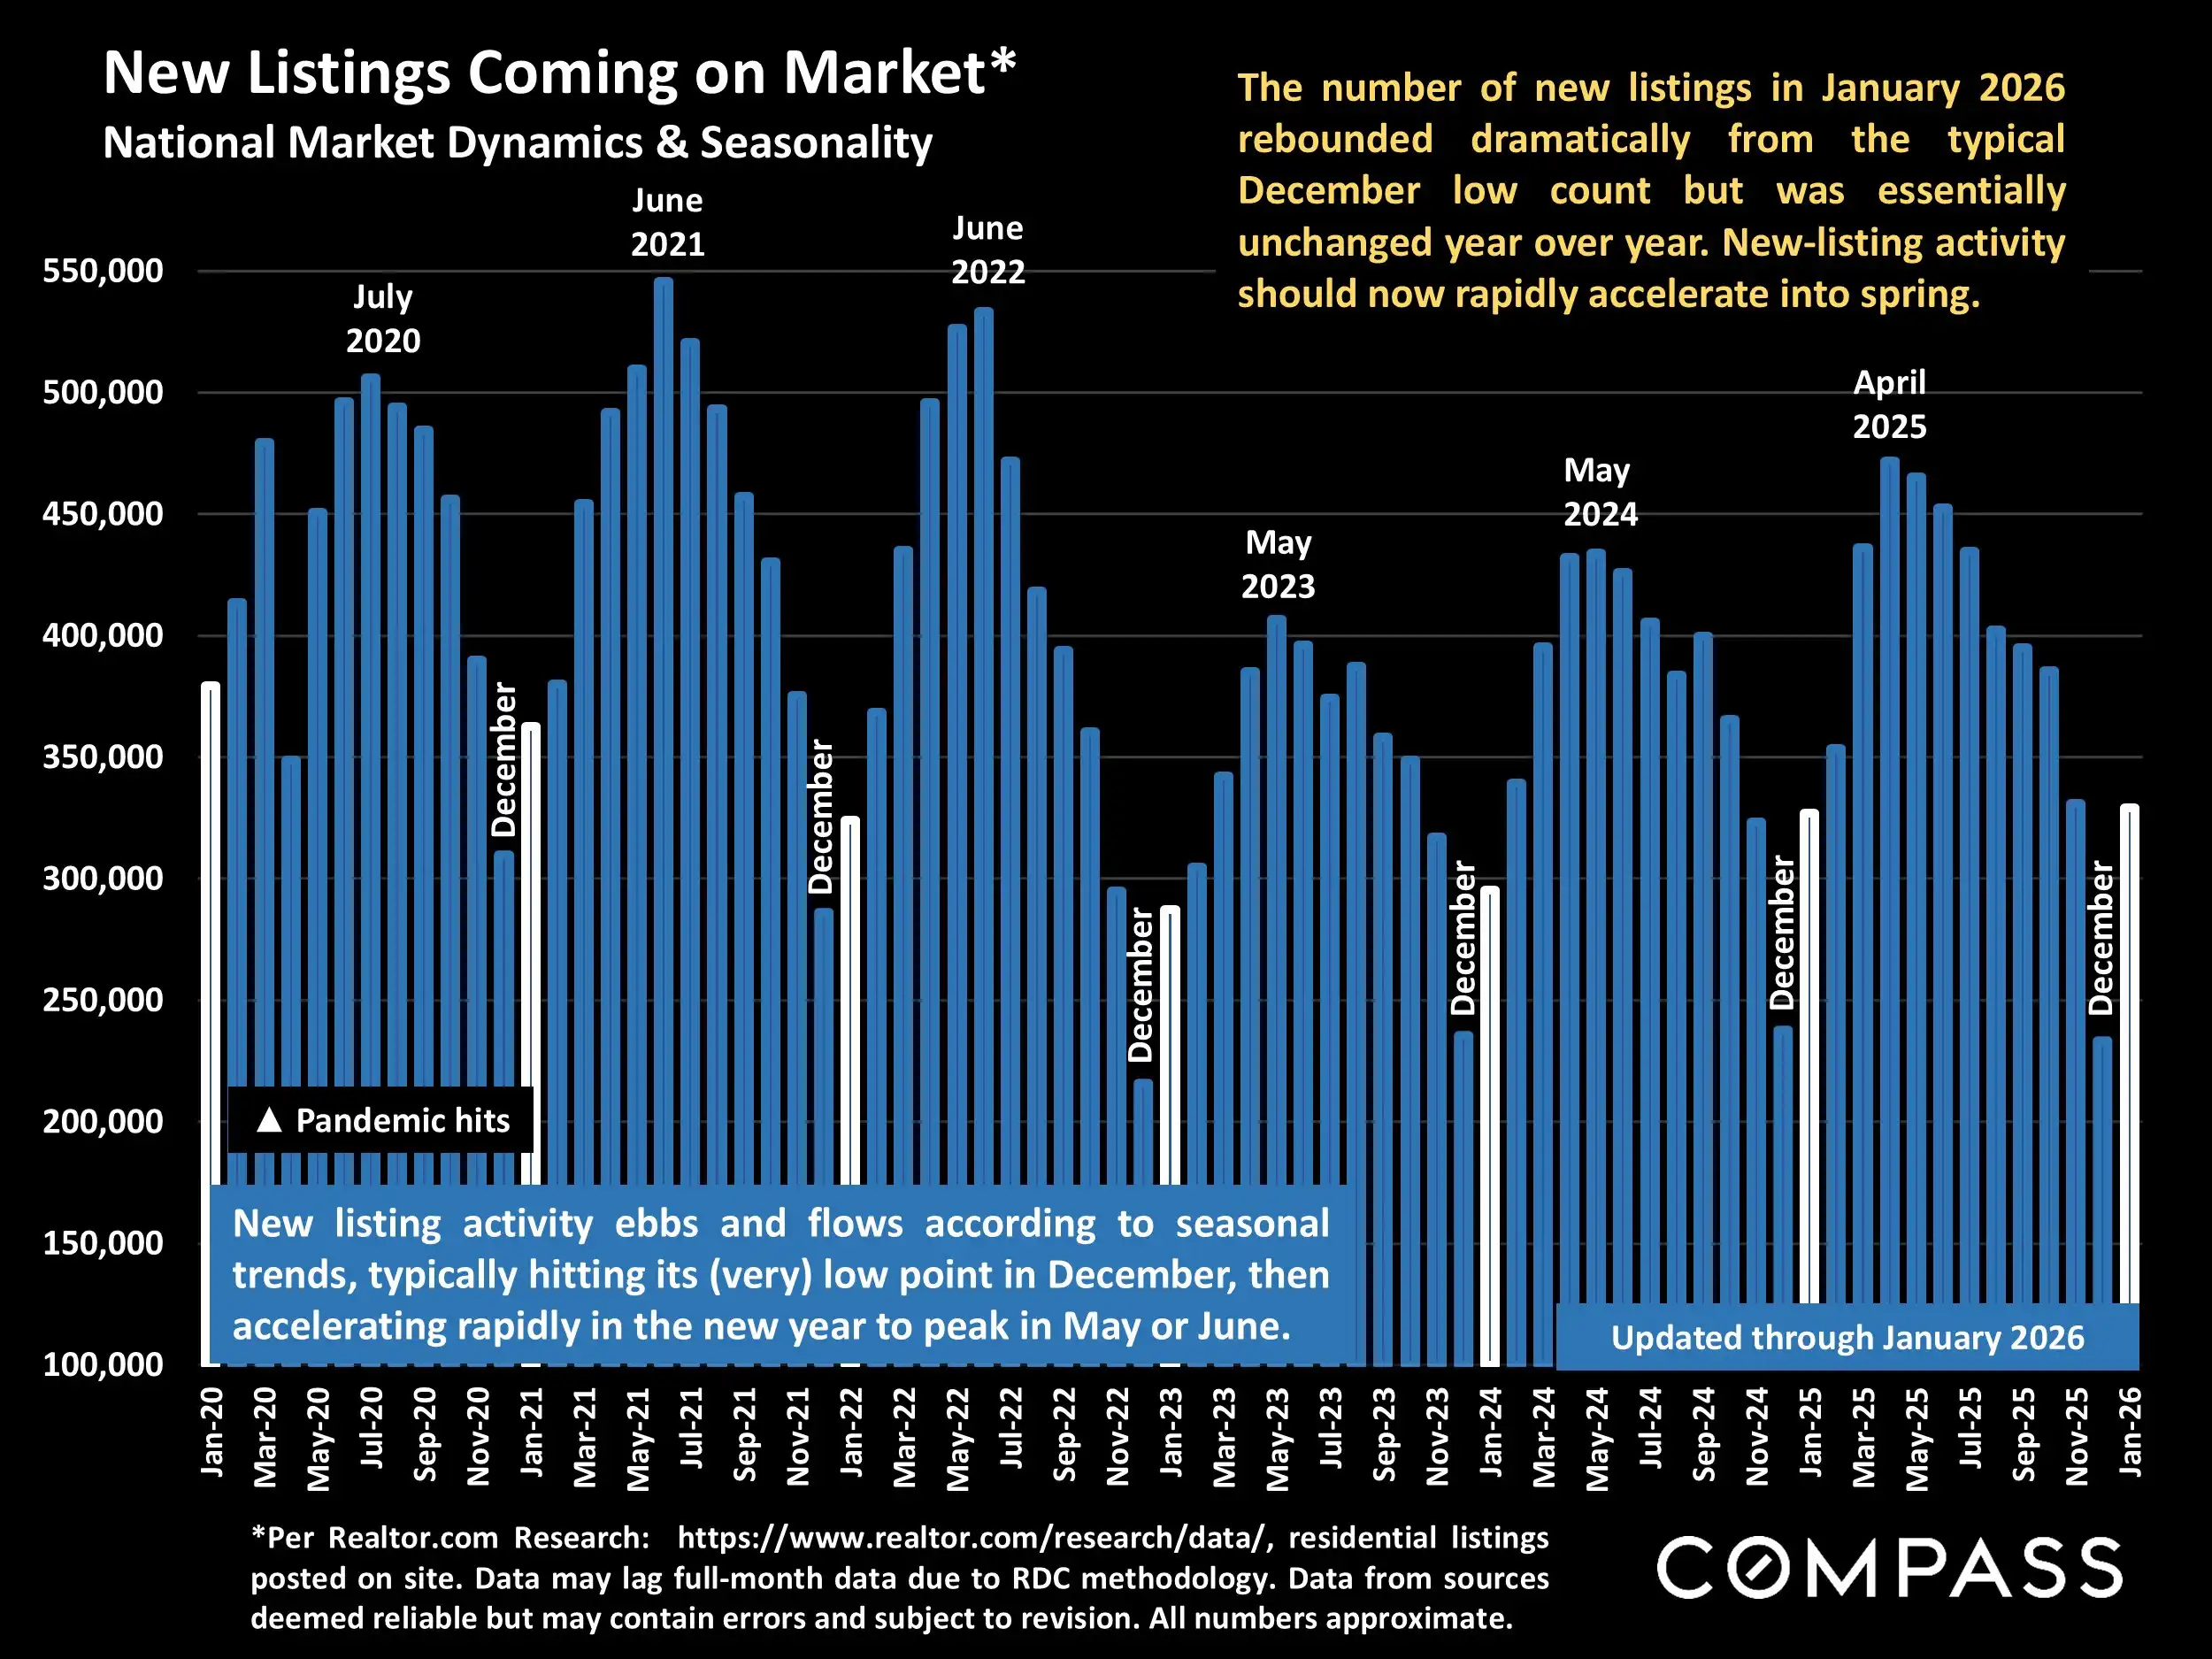
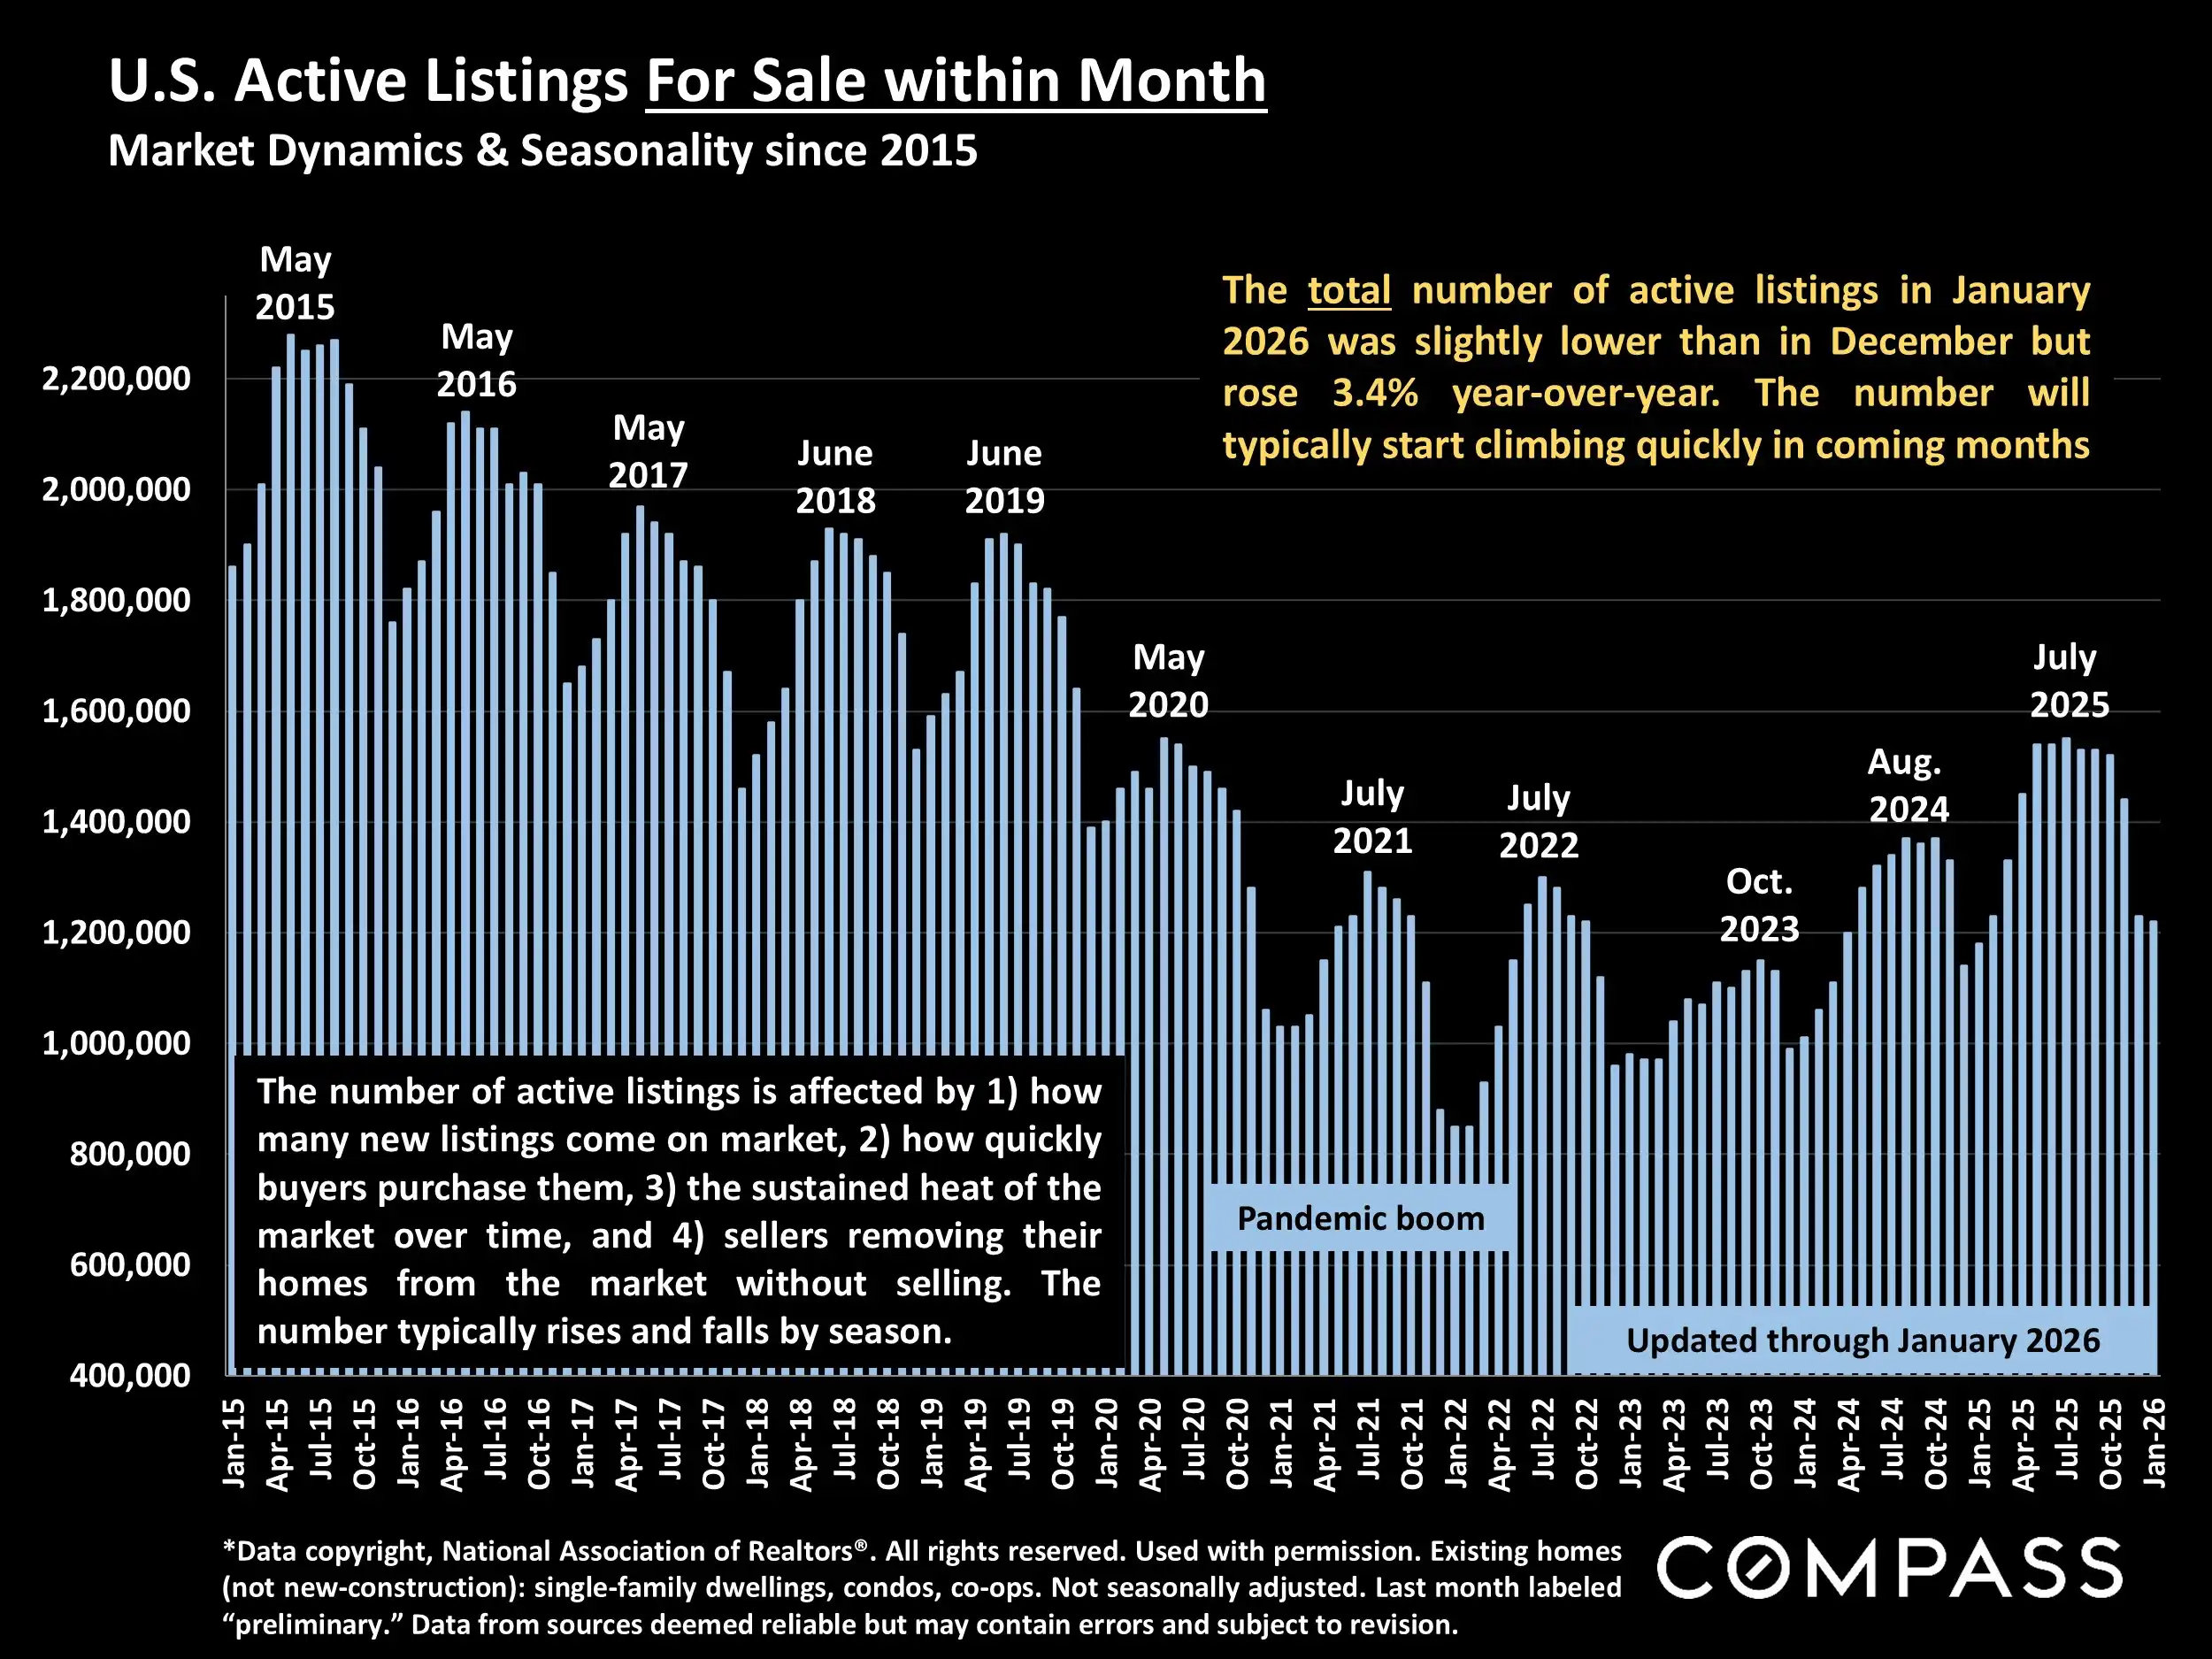
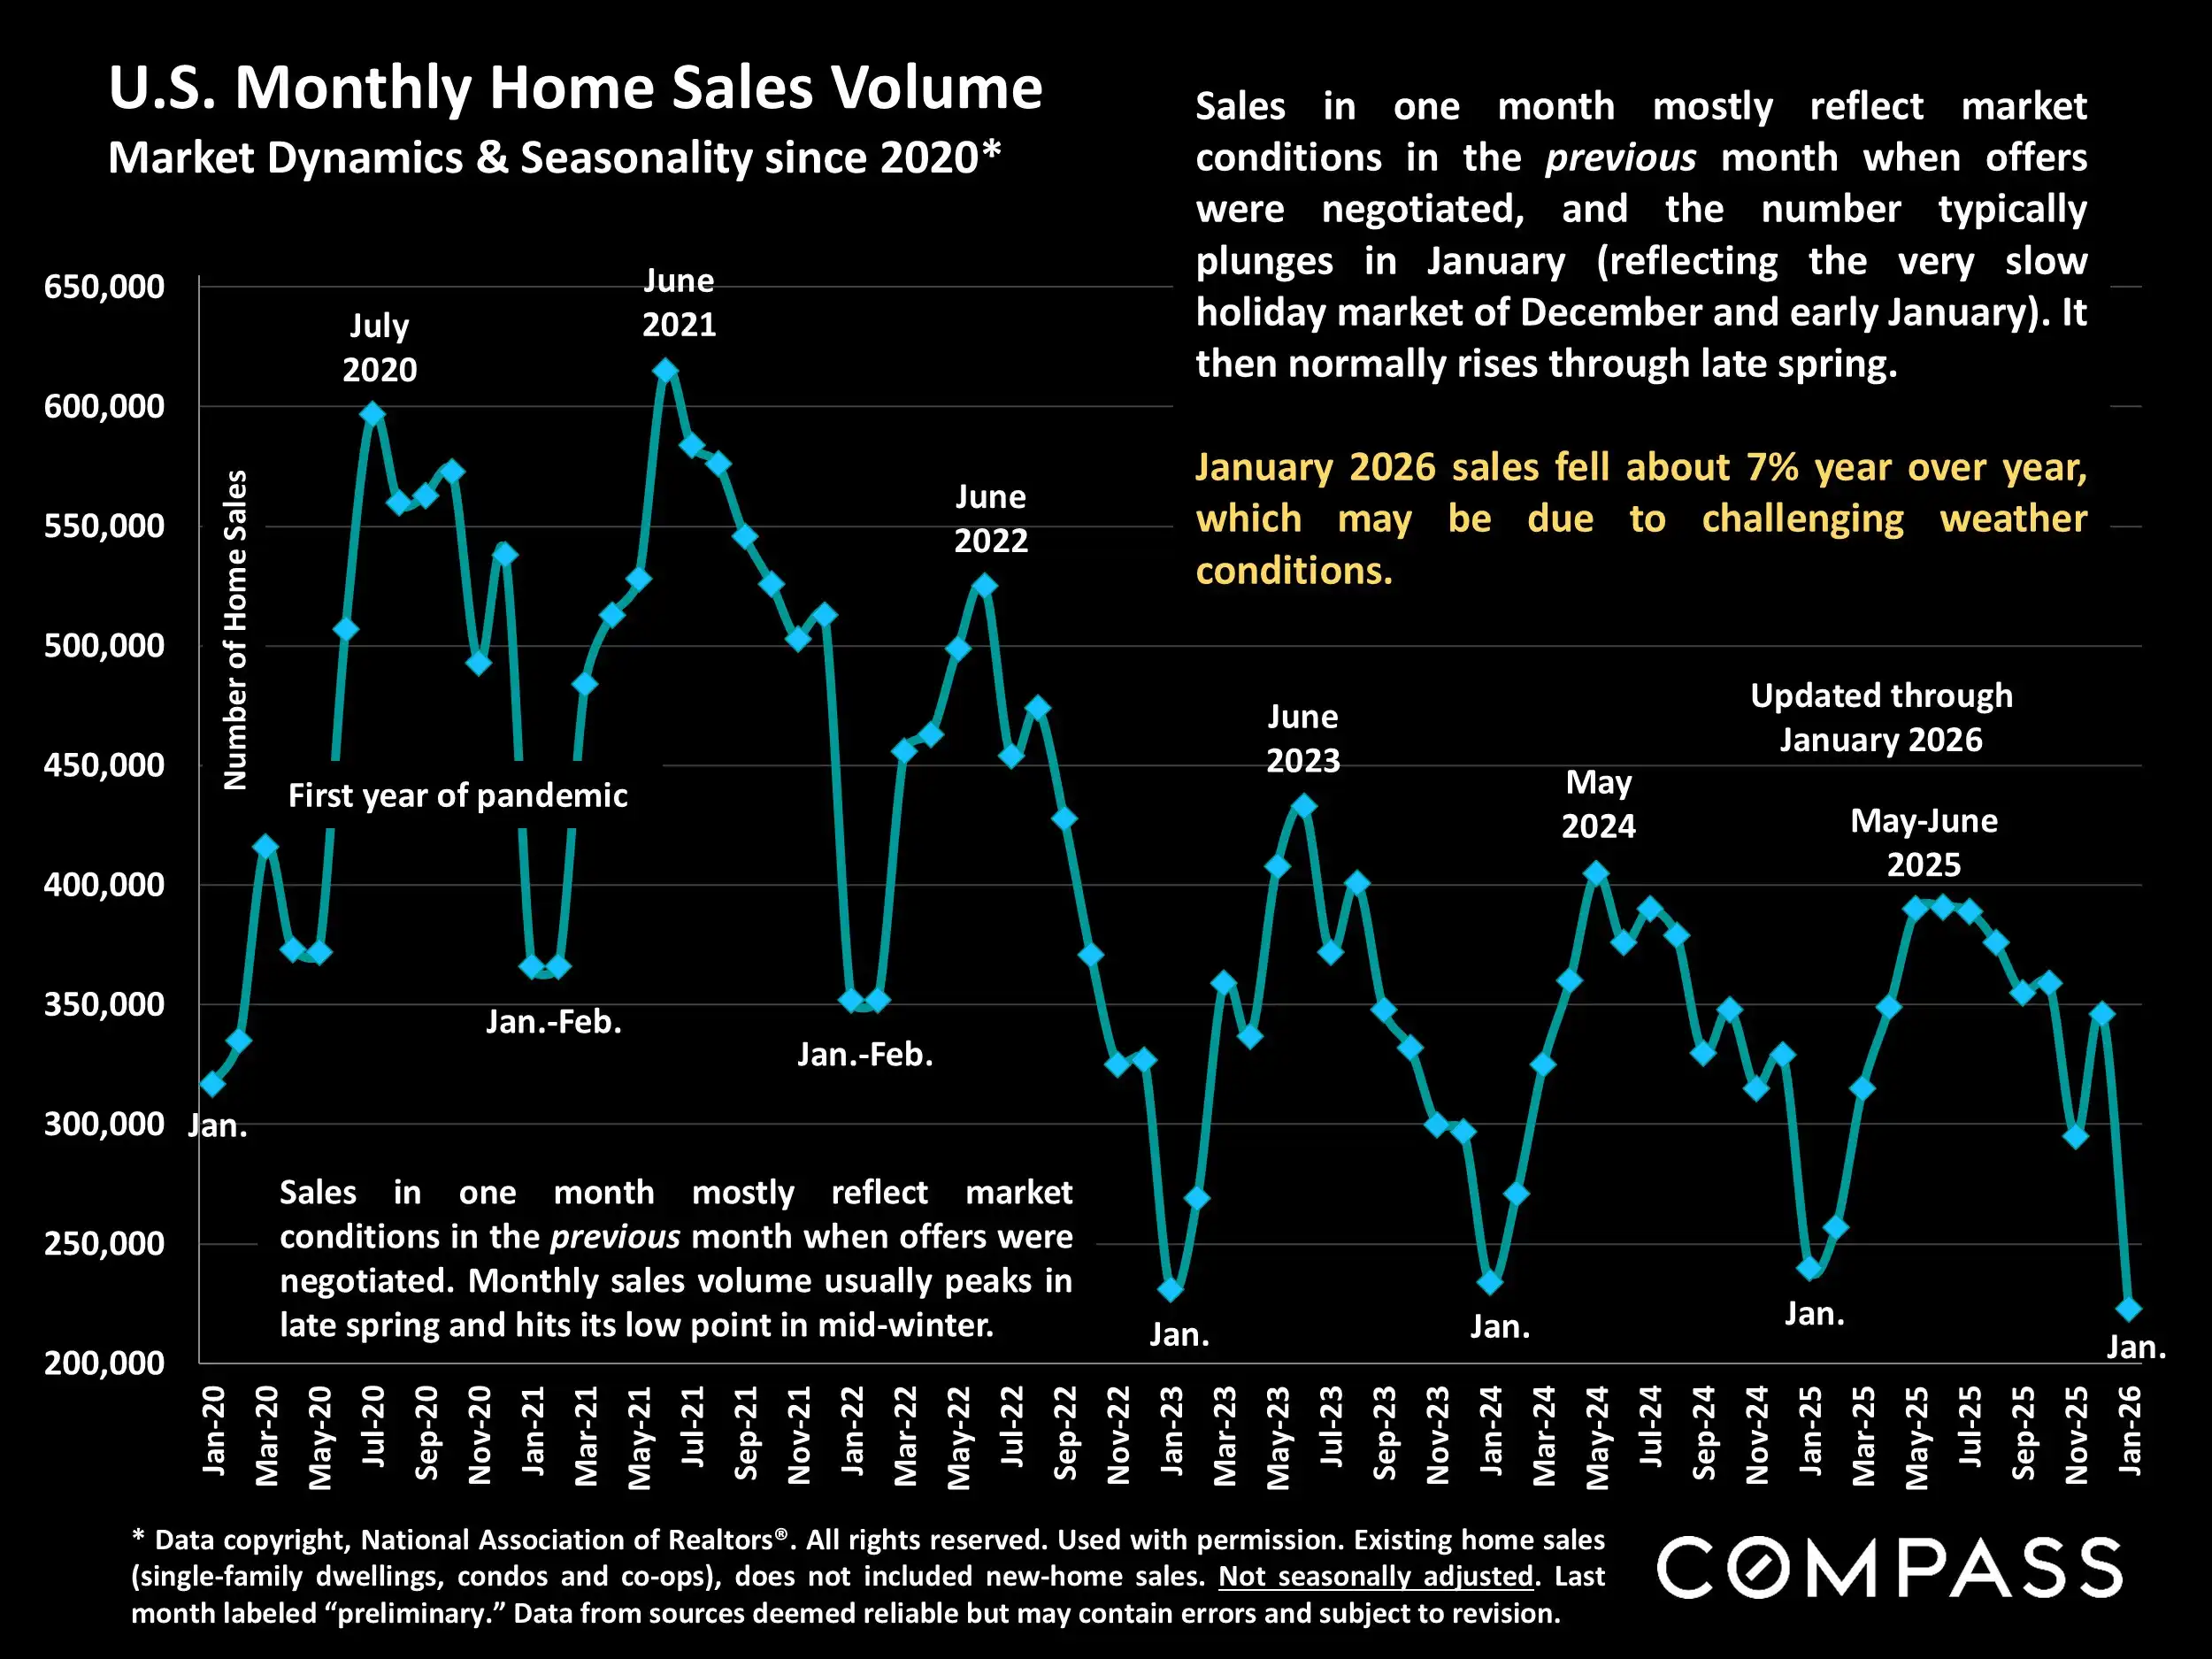
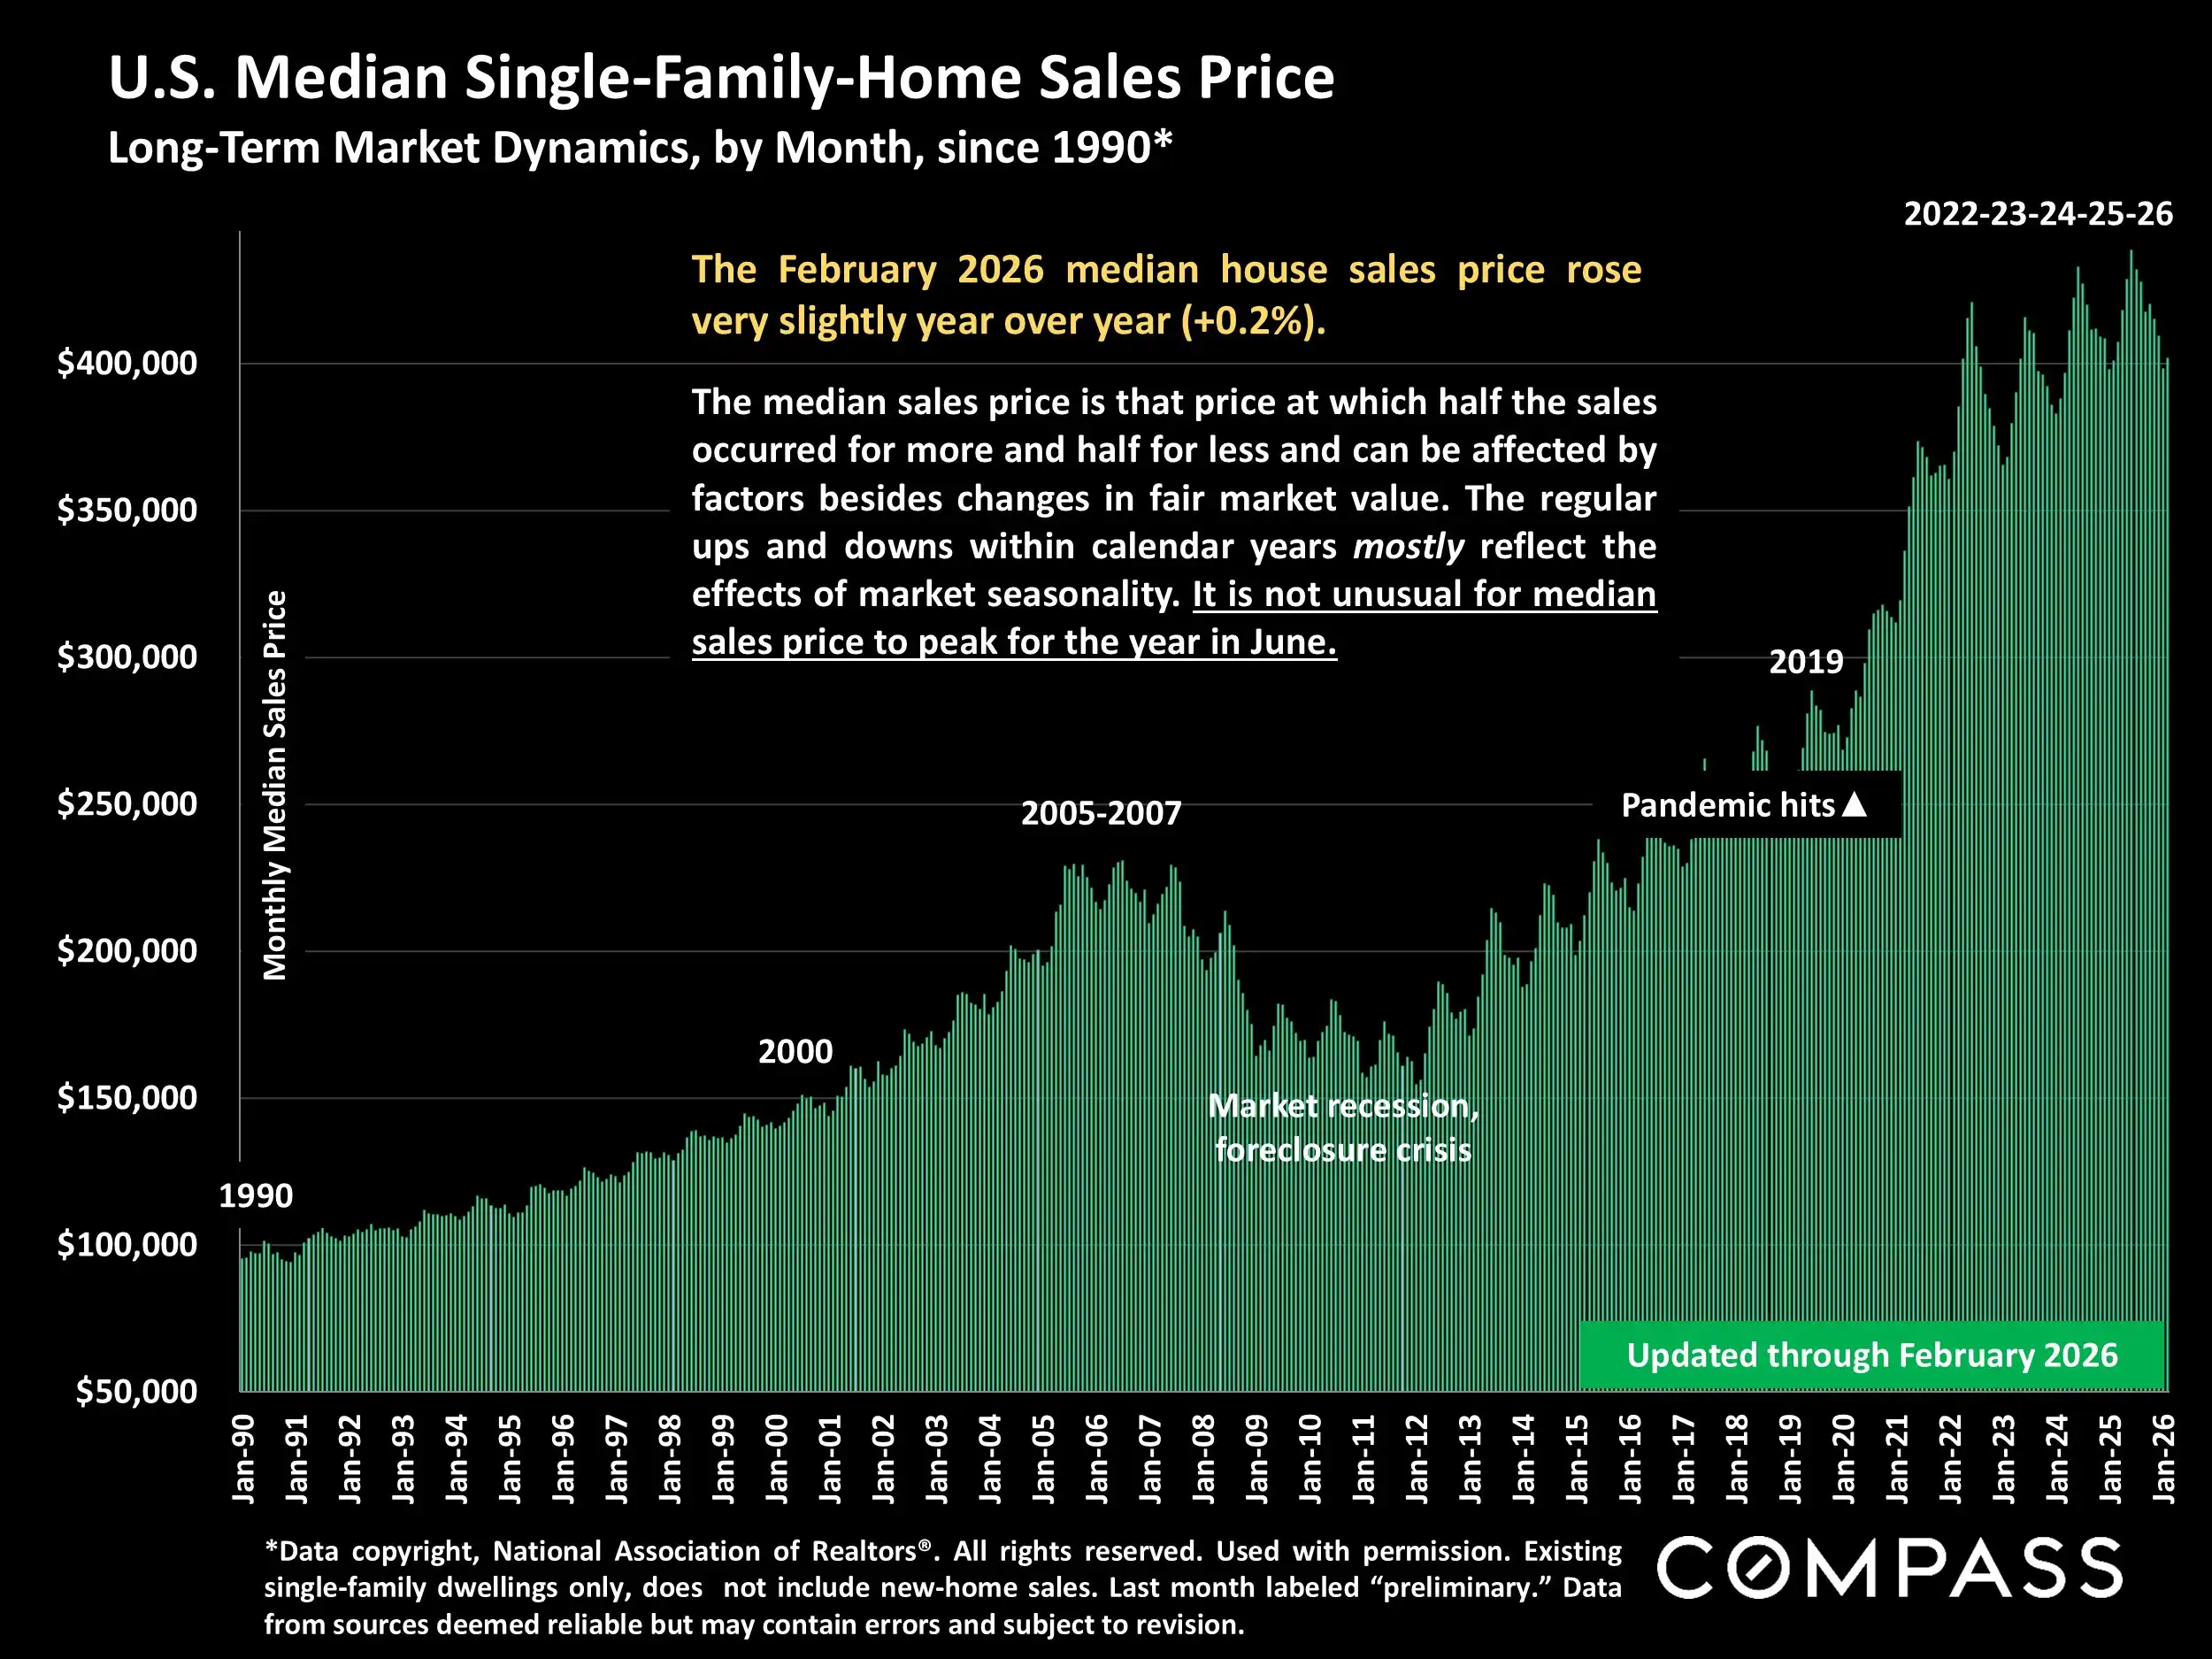
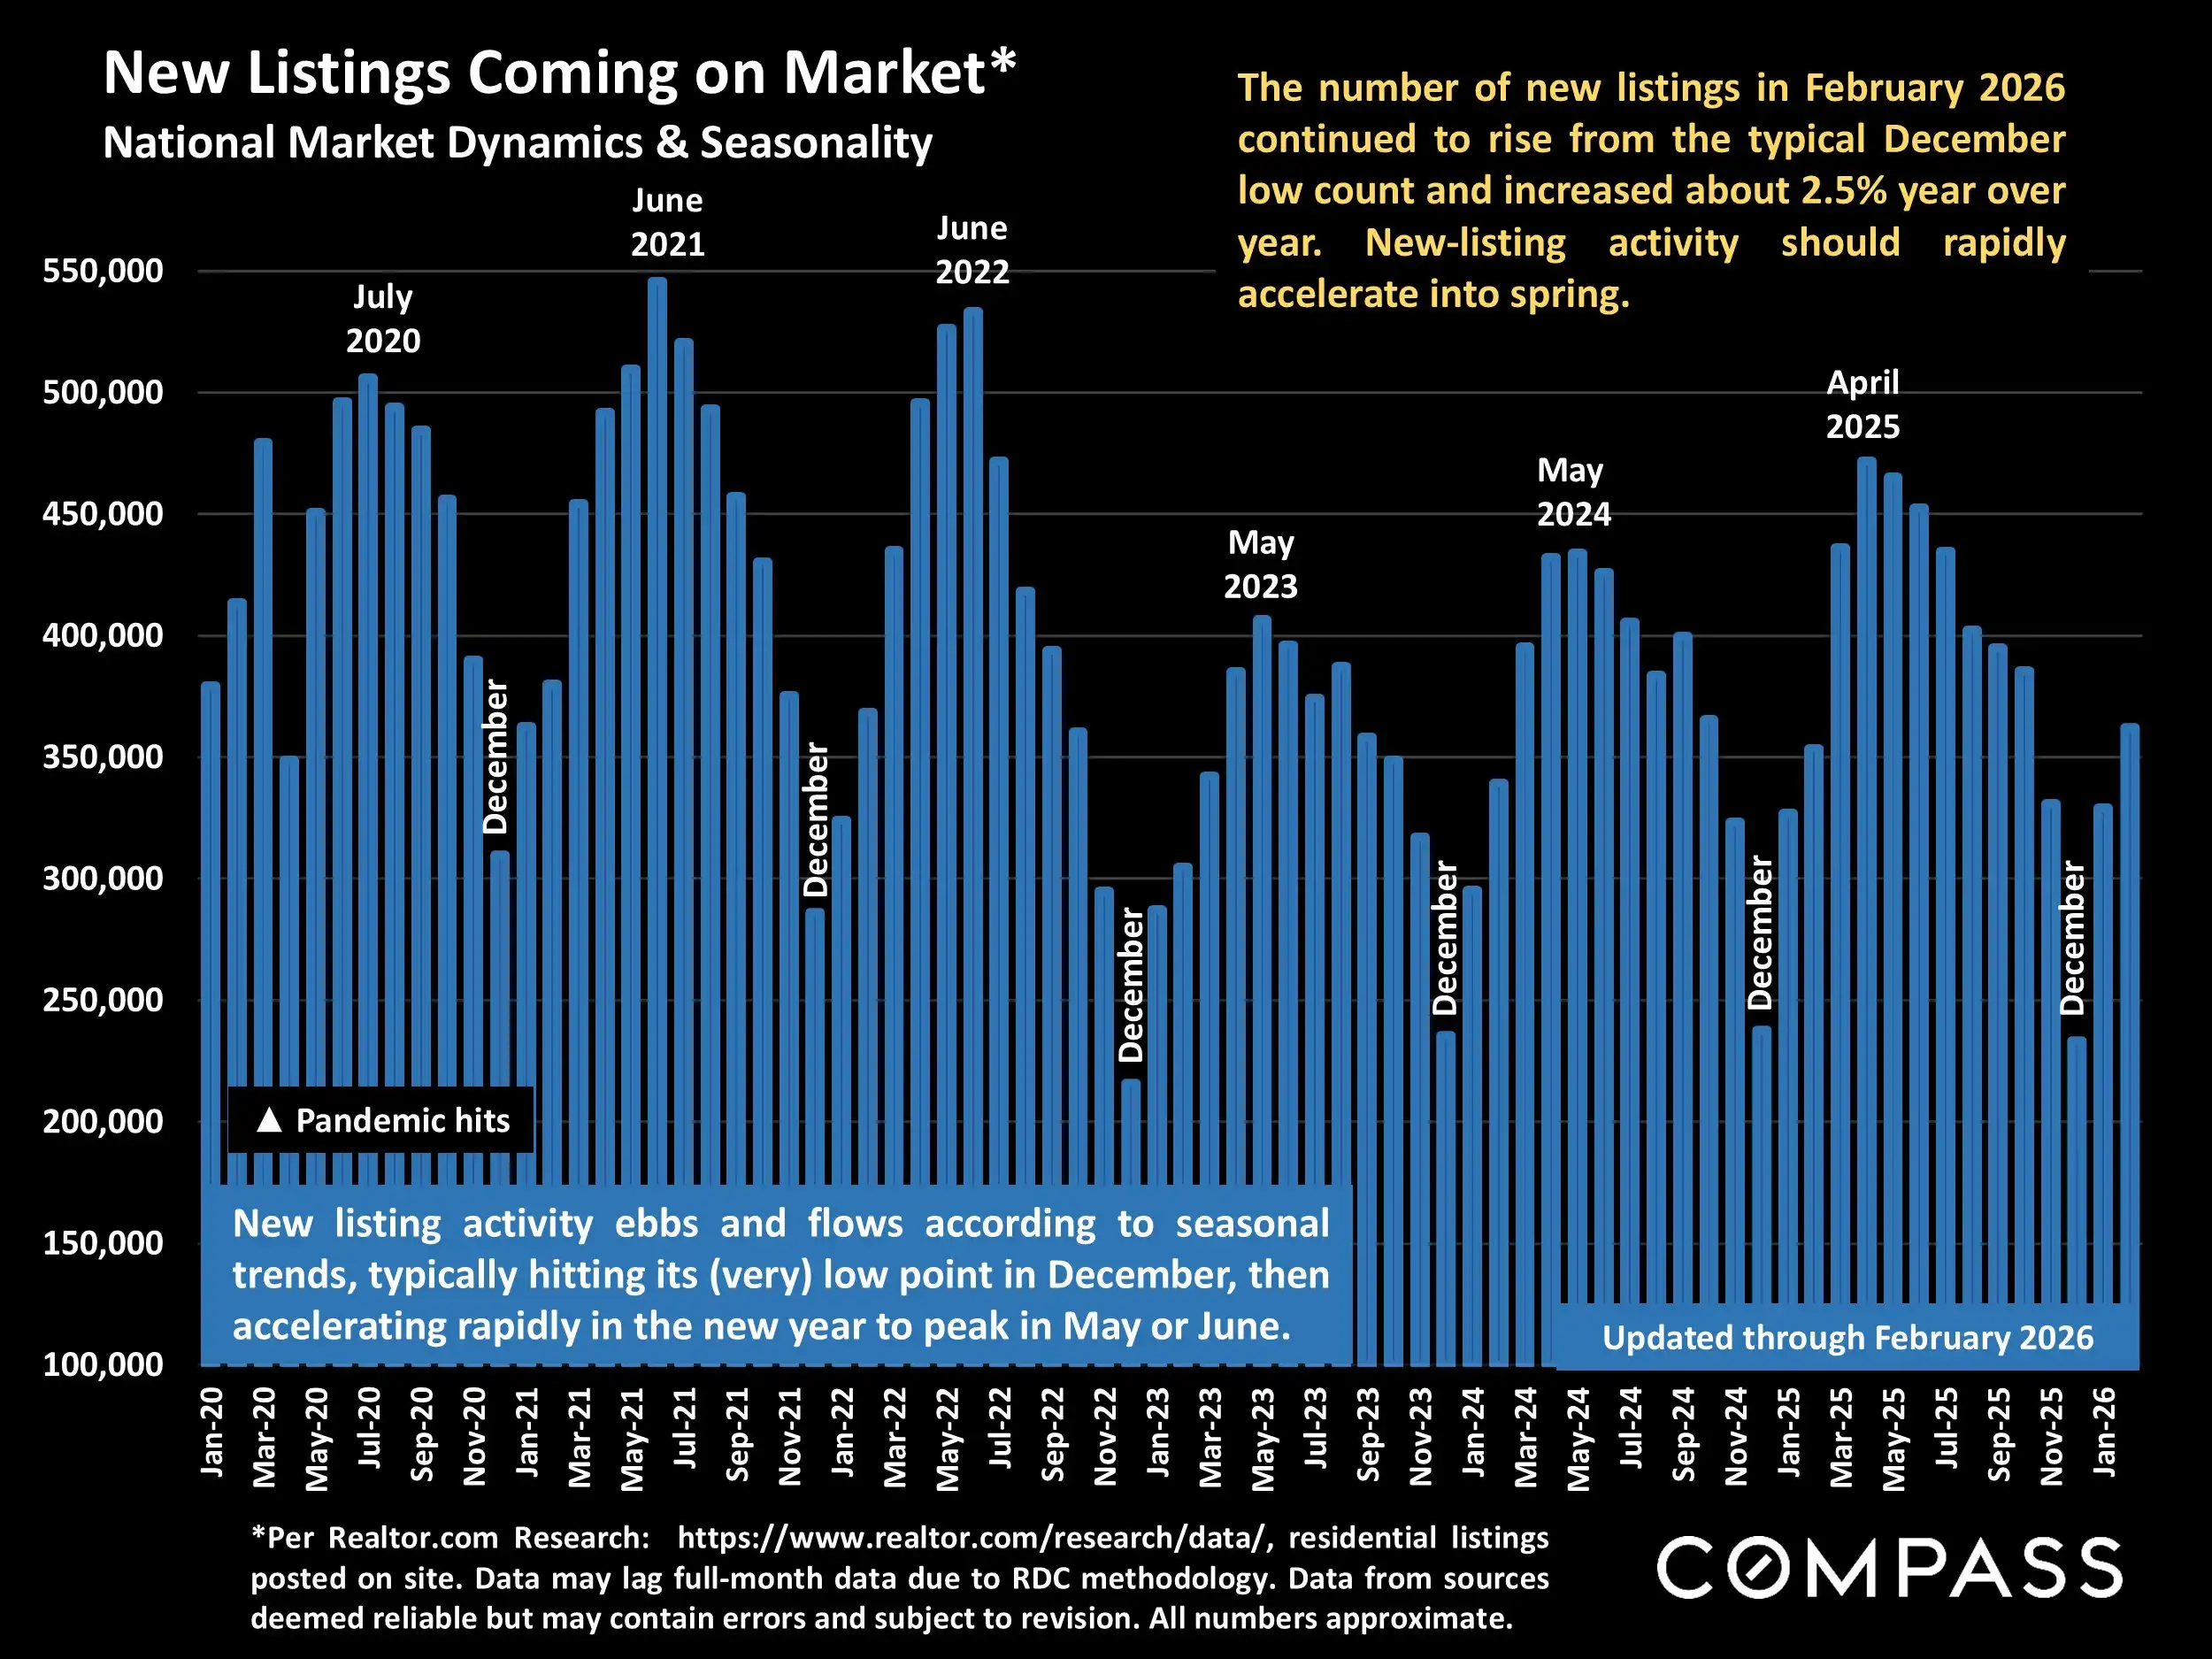
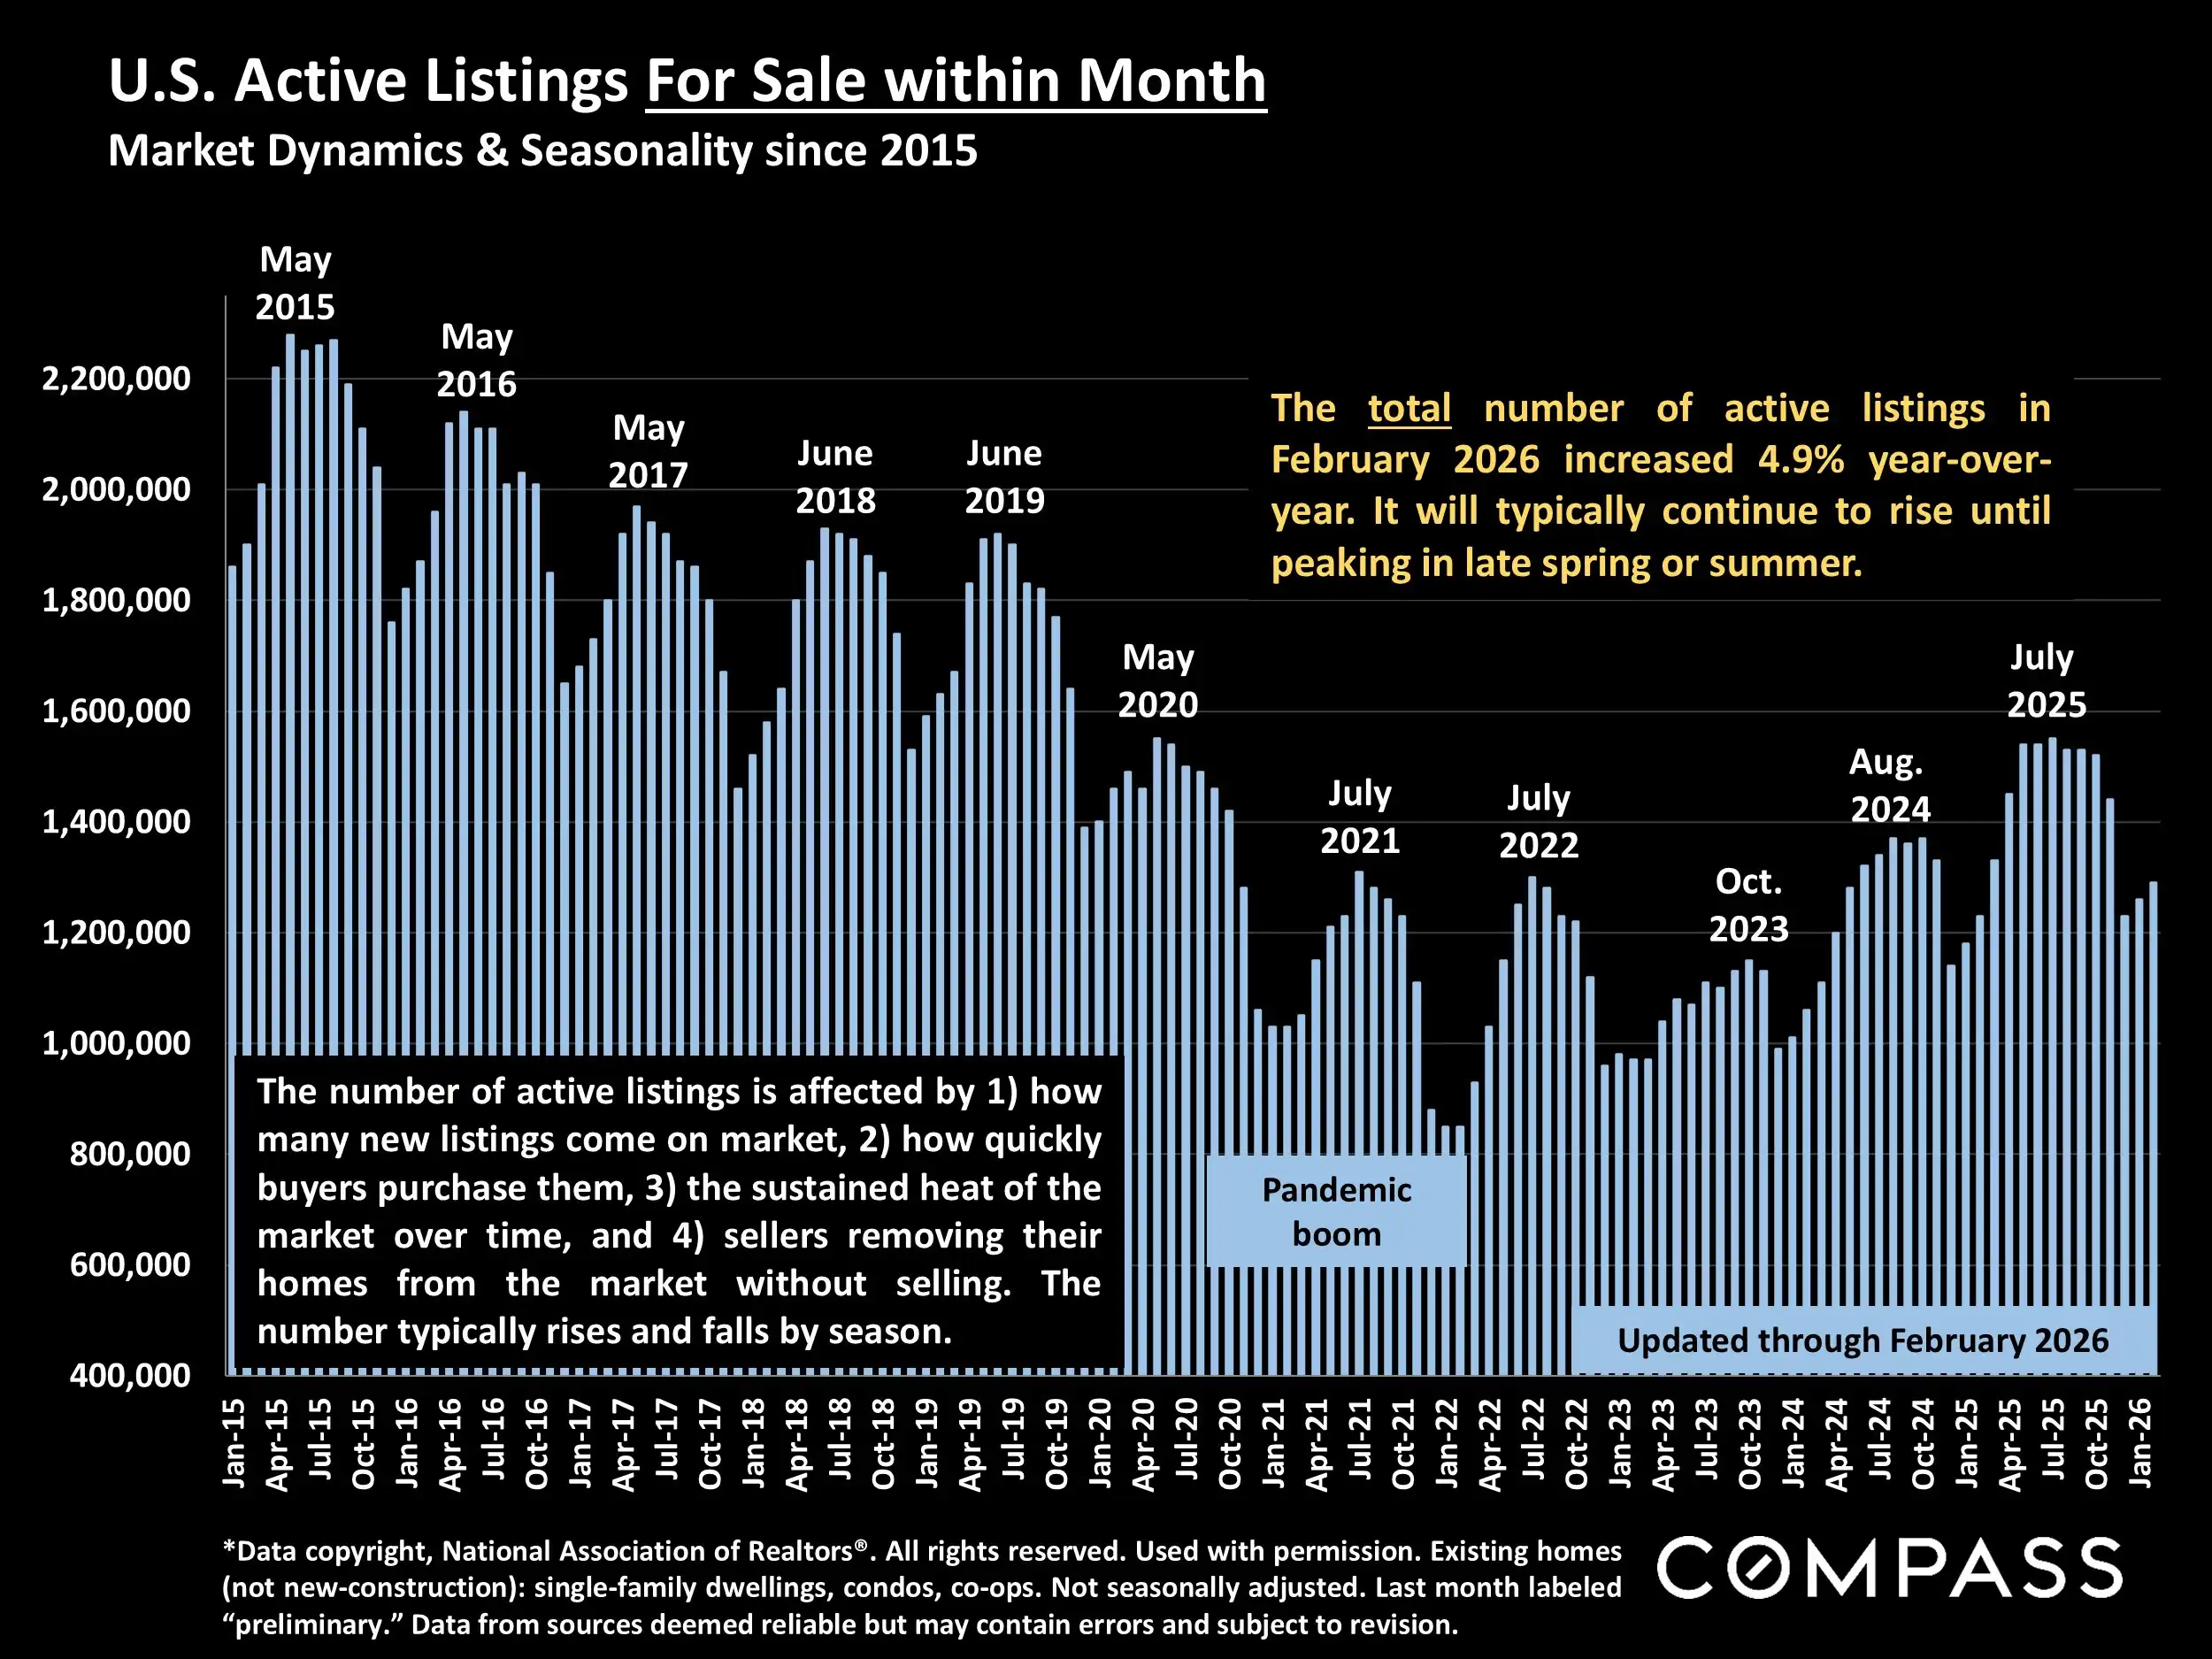
Home prices remained steady, with the January 2026 median single-family home sales price rising slightly year over year. Sales activity was softer, with January sales down about 7% from the prior year, which may have been influenced by challenging winter weather conditions. At the same time, inventory continued to improve. New listings rebounded sharply from the typical December low, and active listings were up 3.4% year over year, giving buyers more choices than they had during the tightest inventory years.
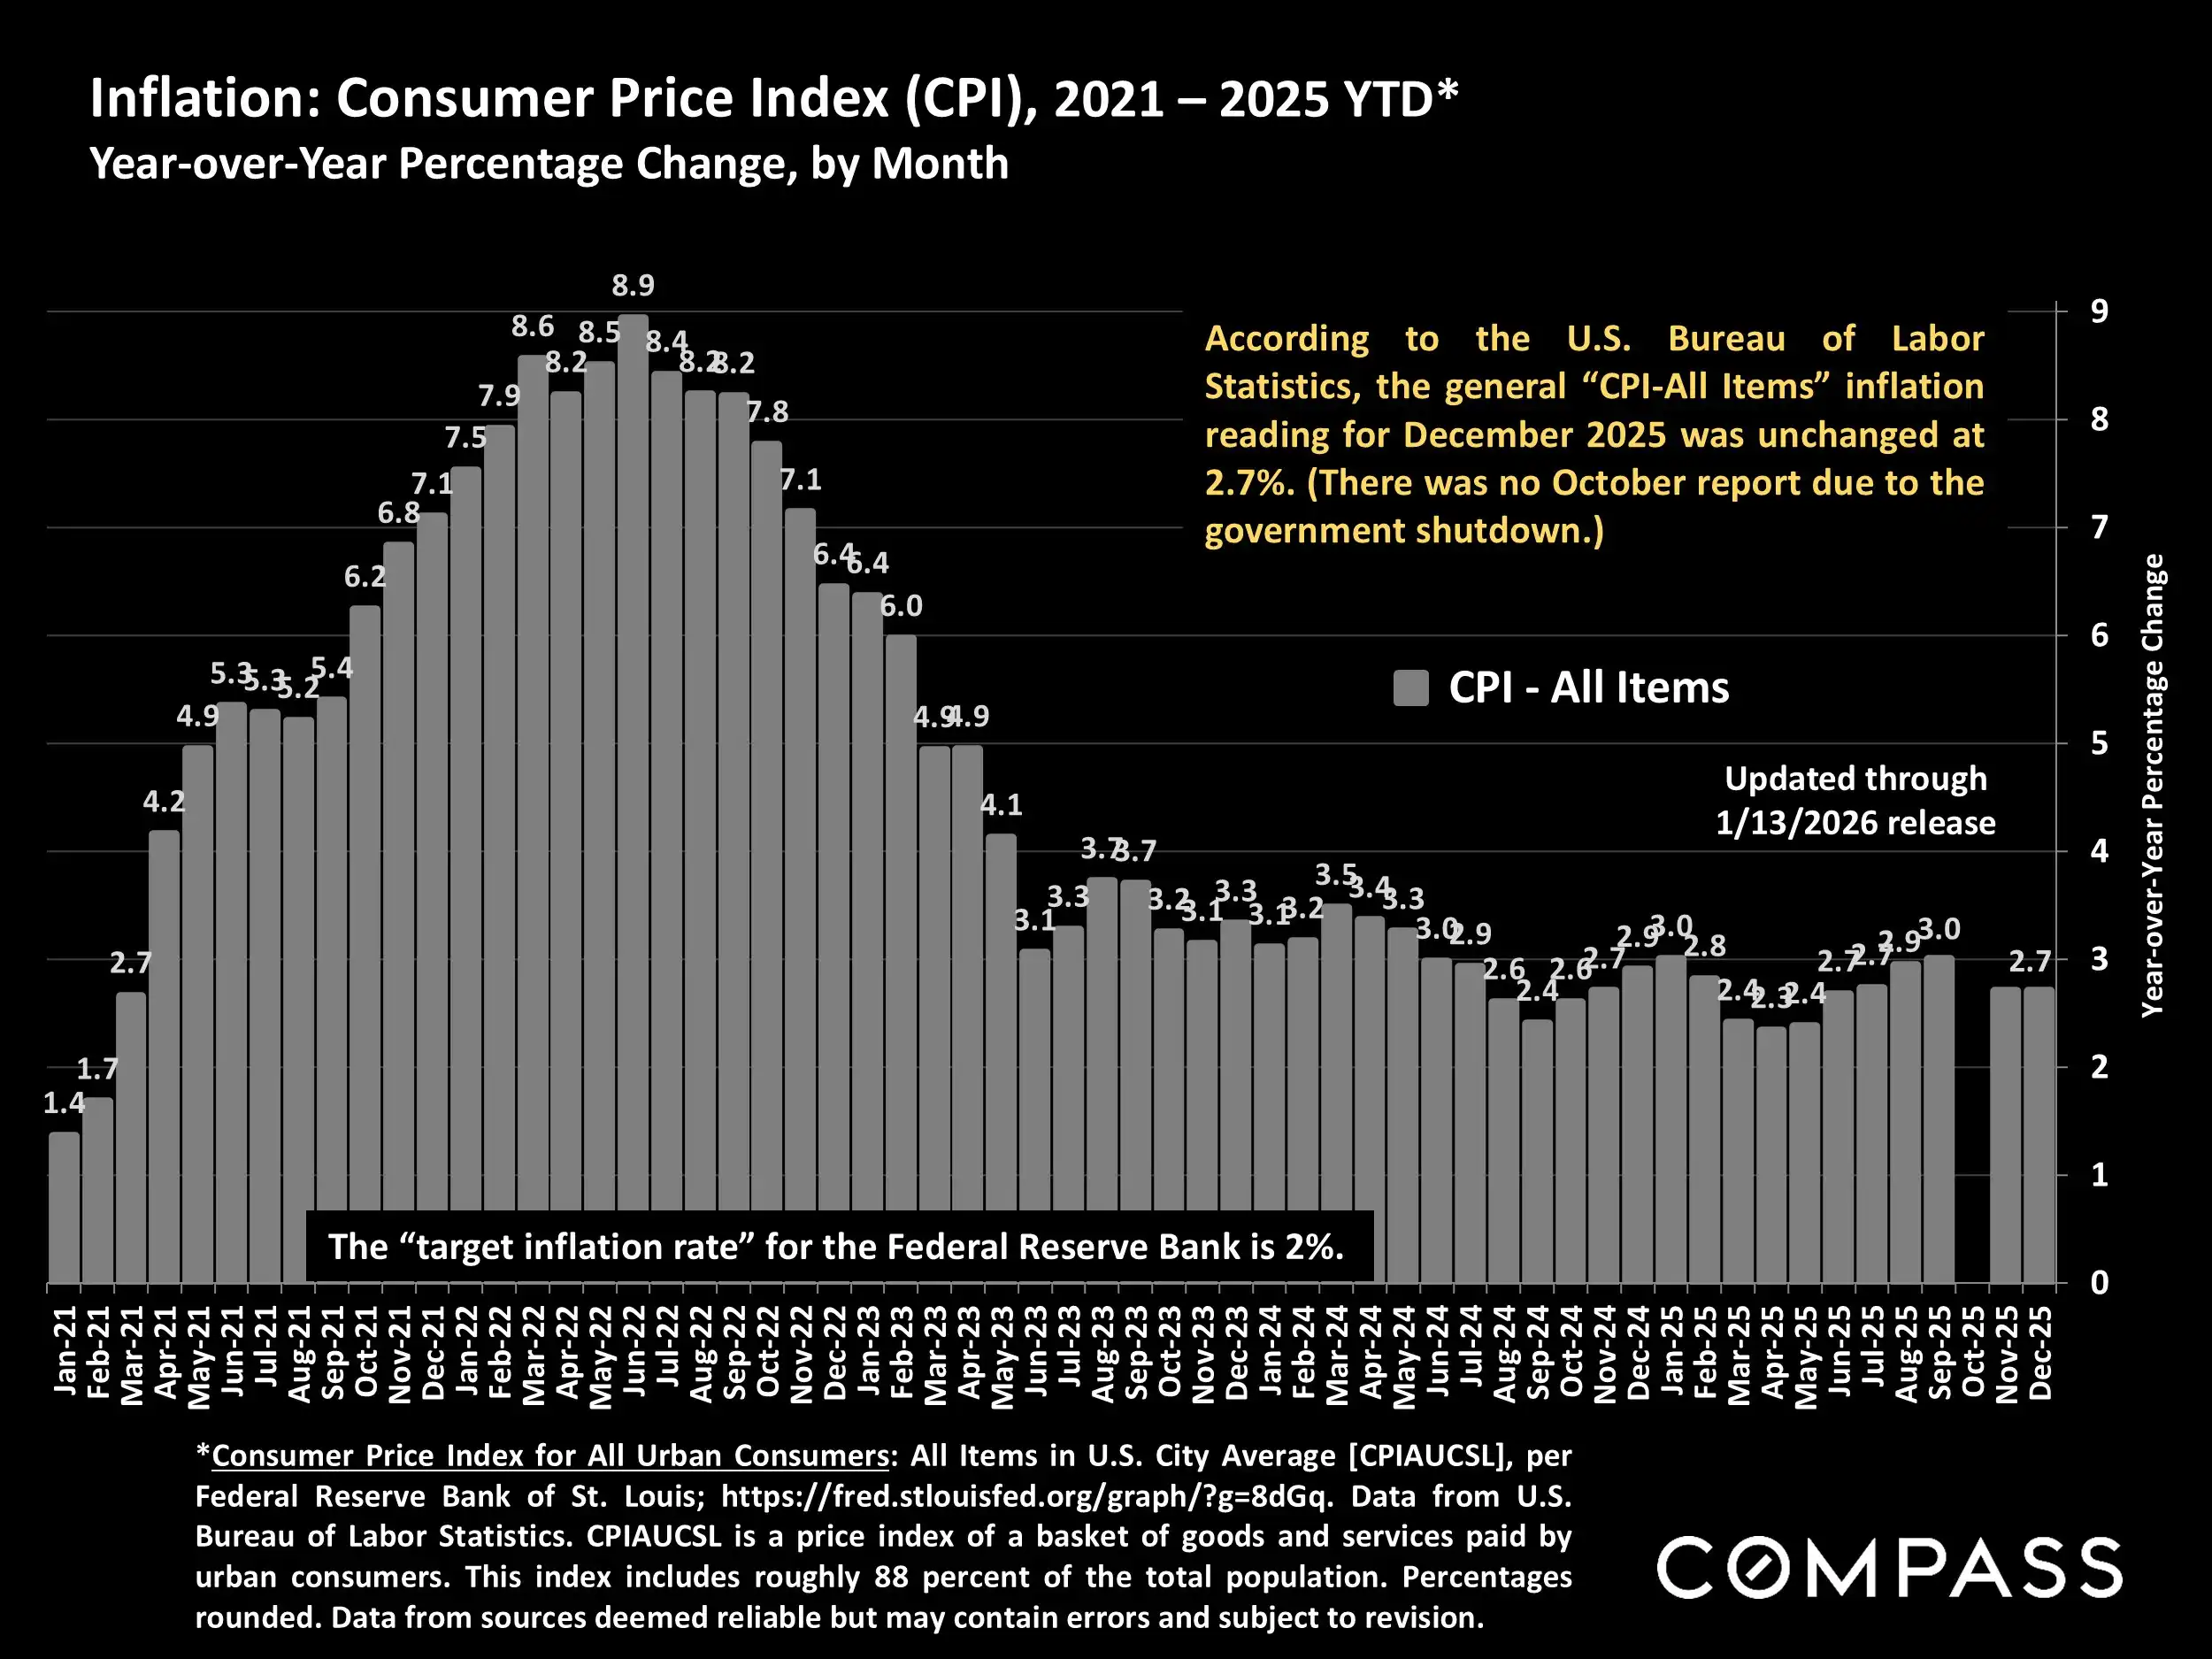
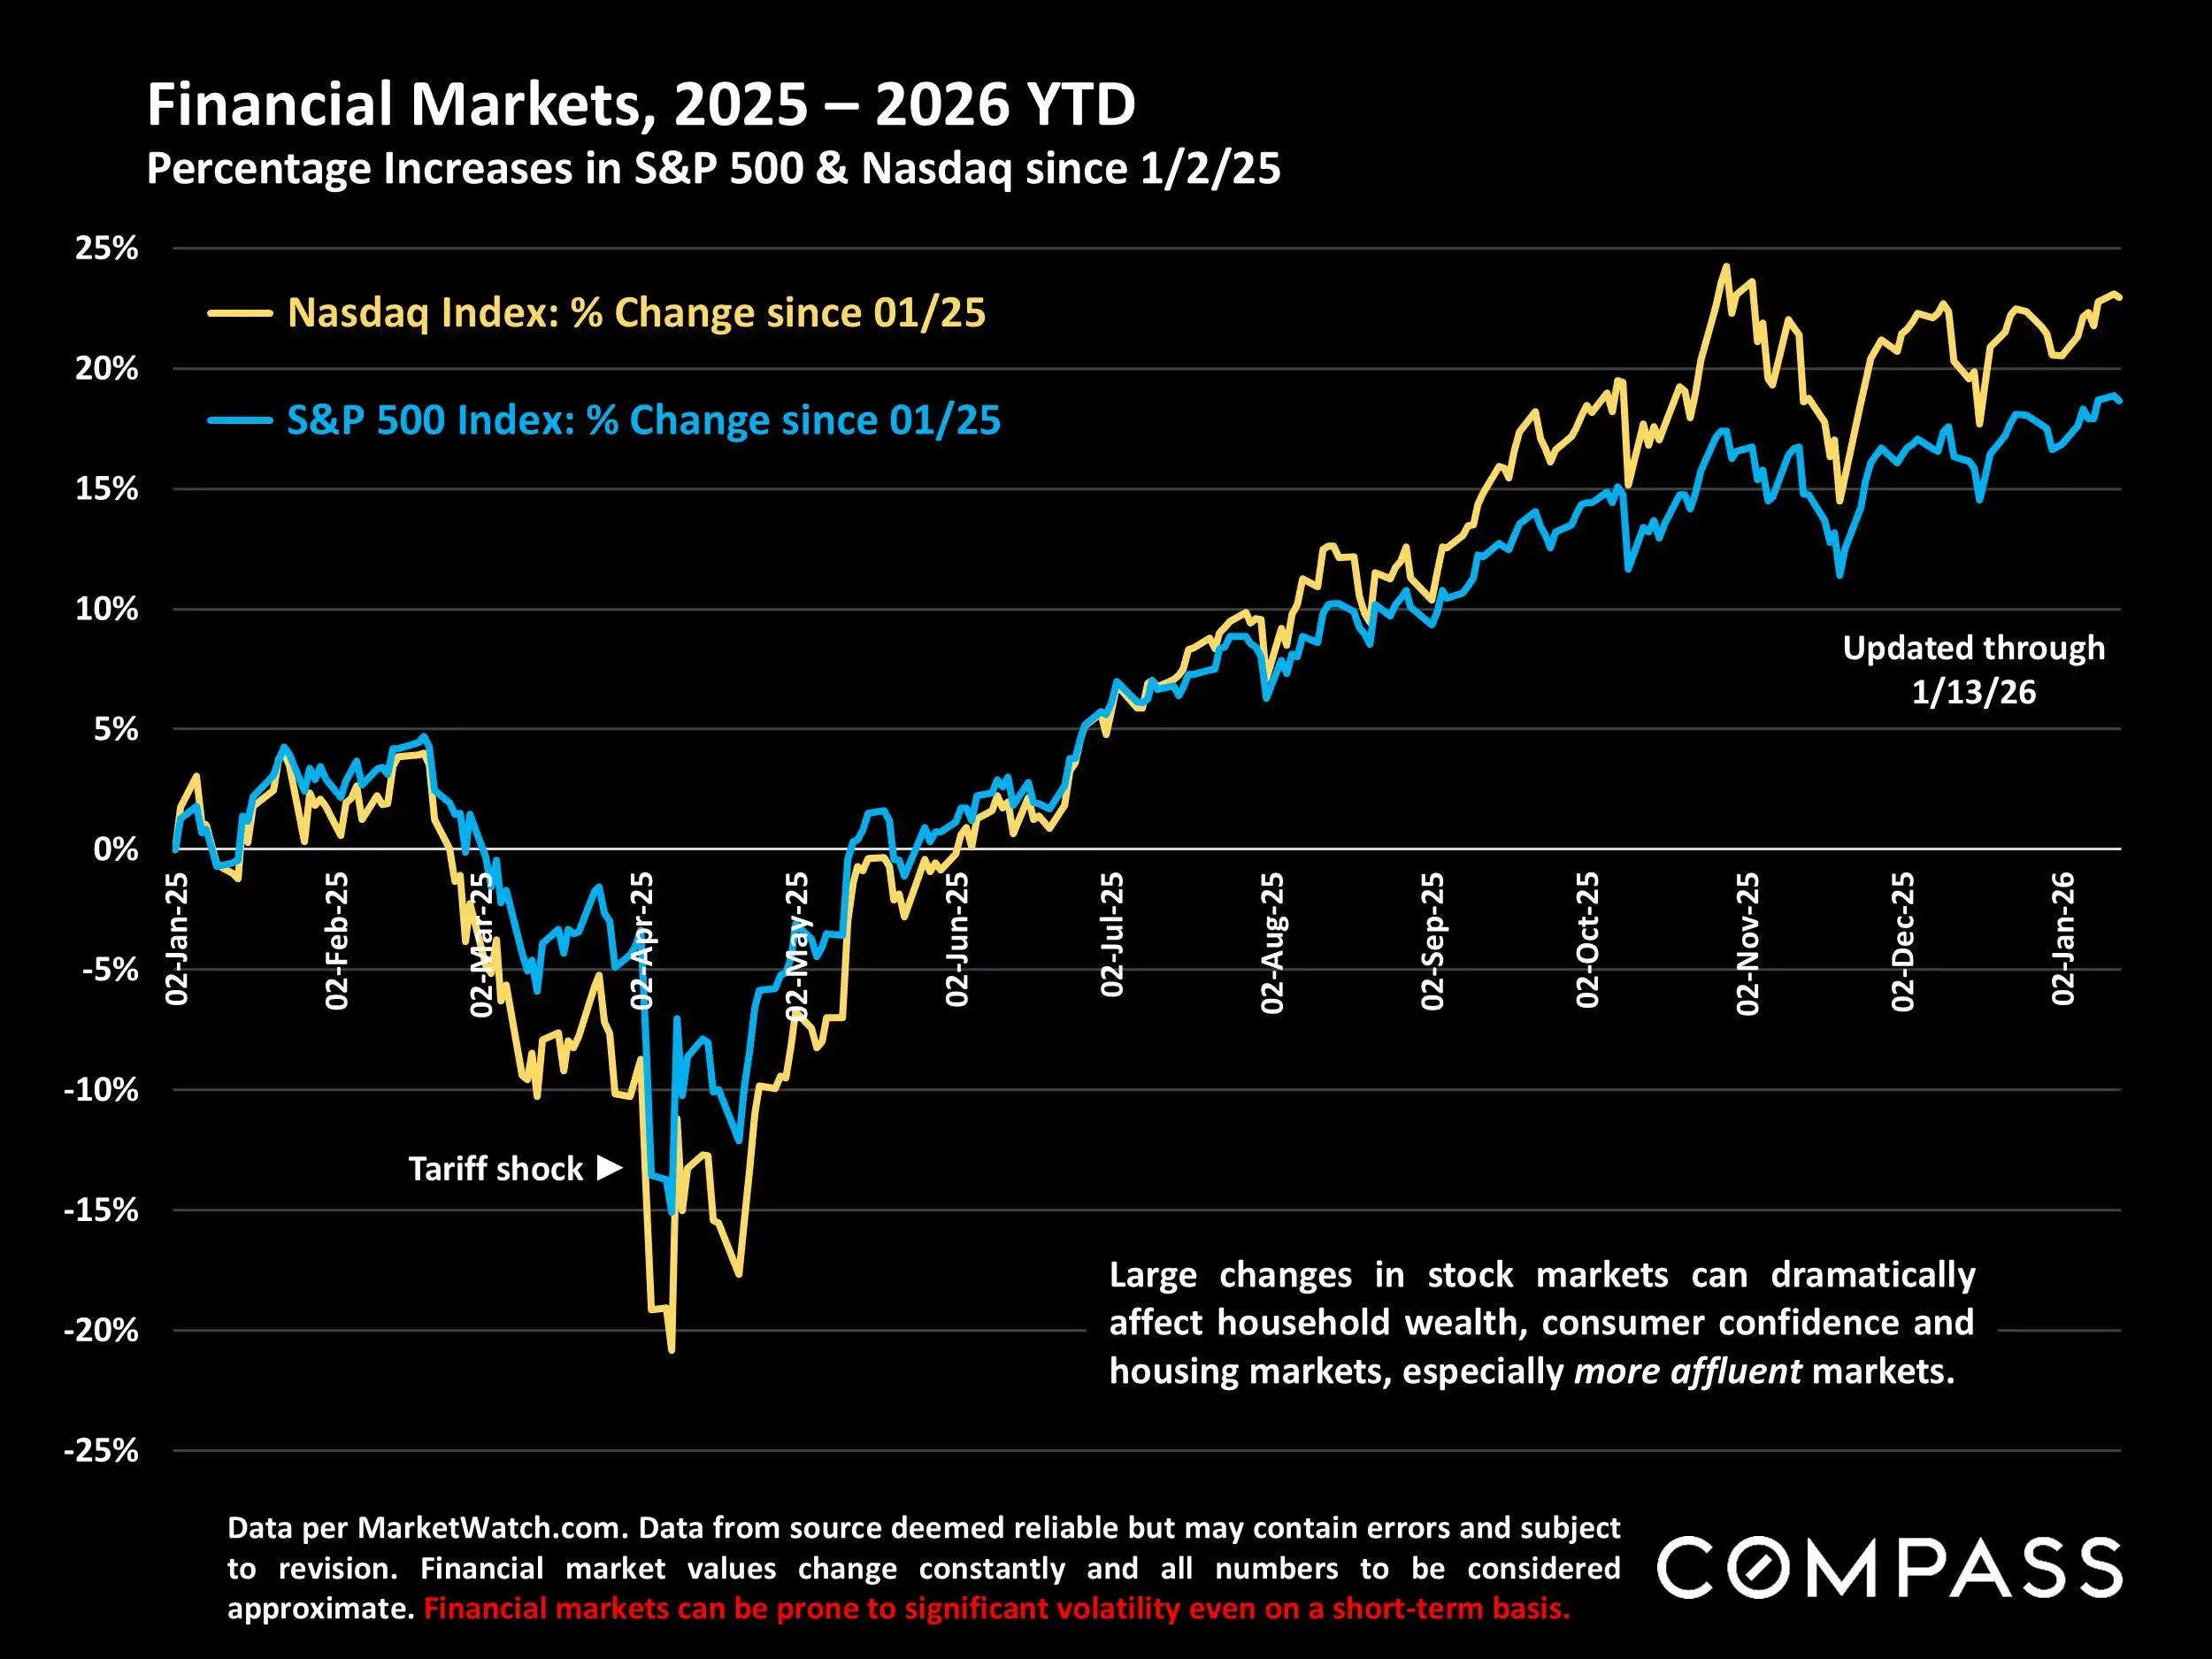
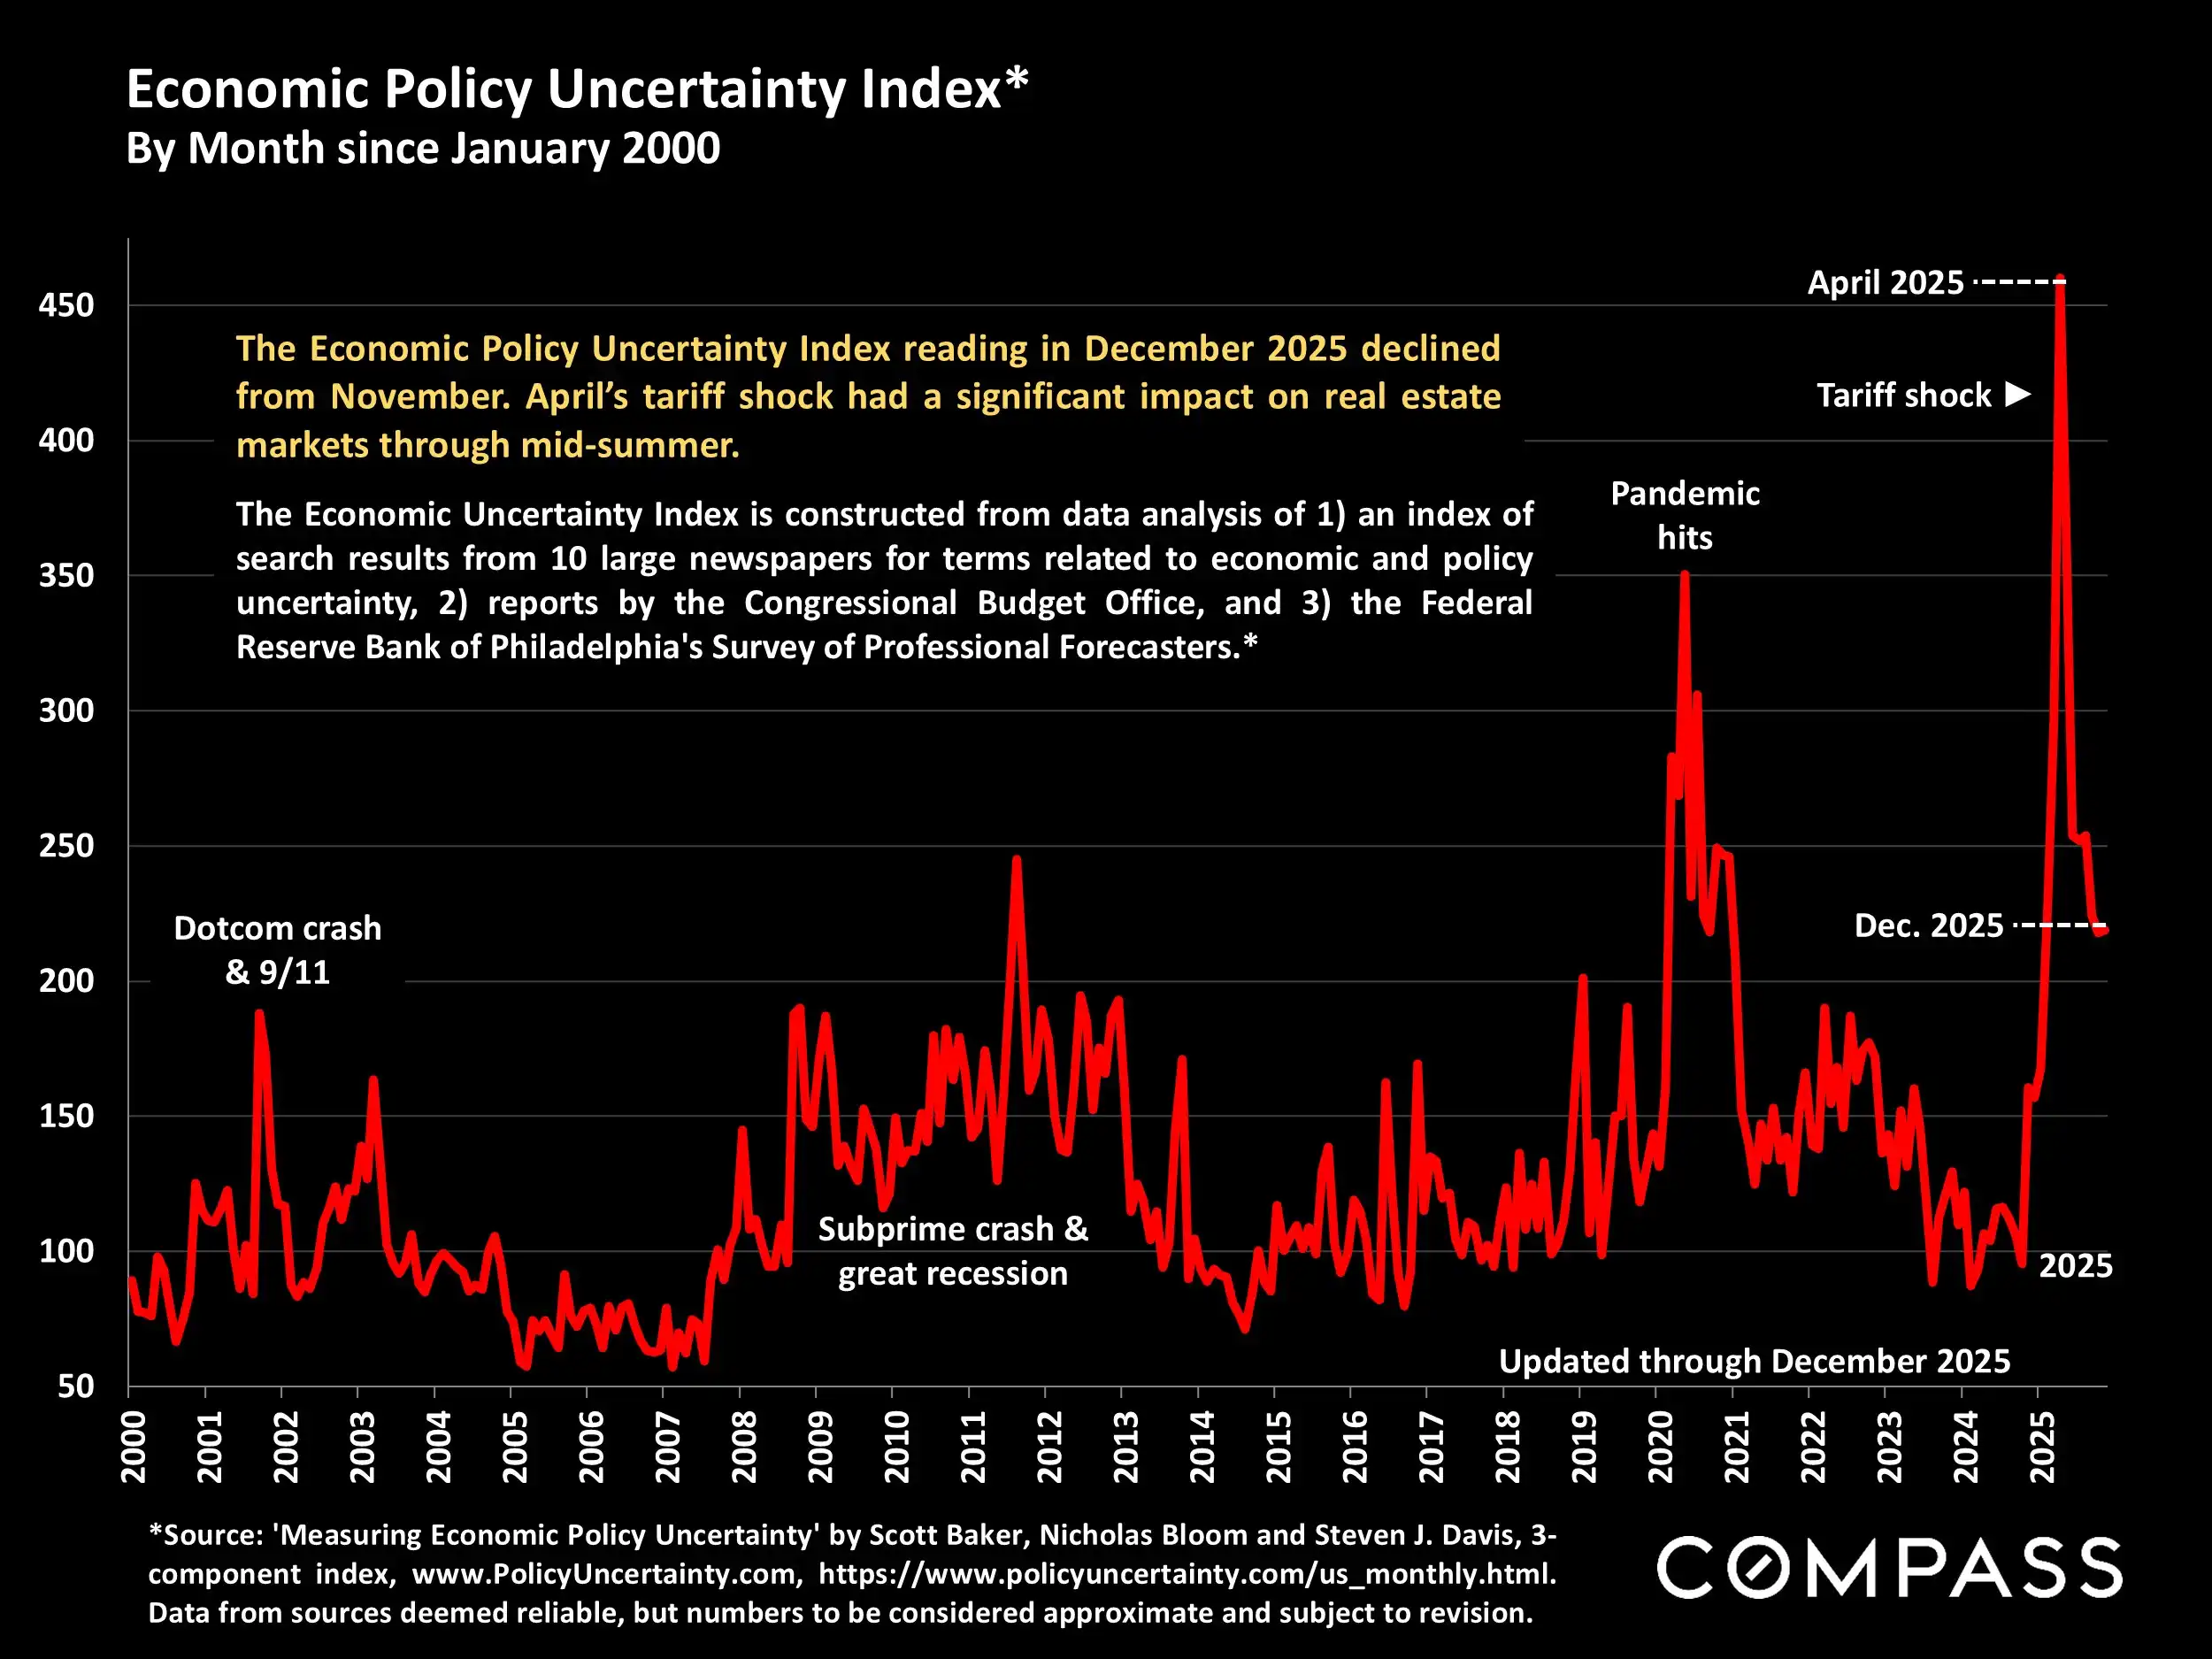
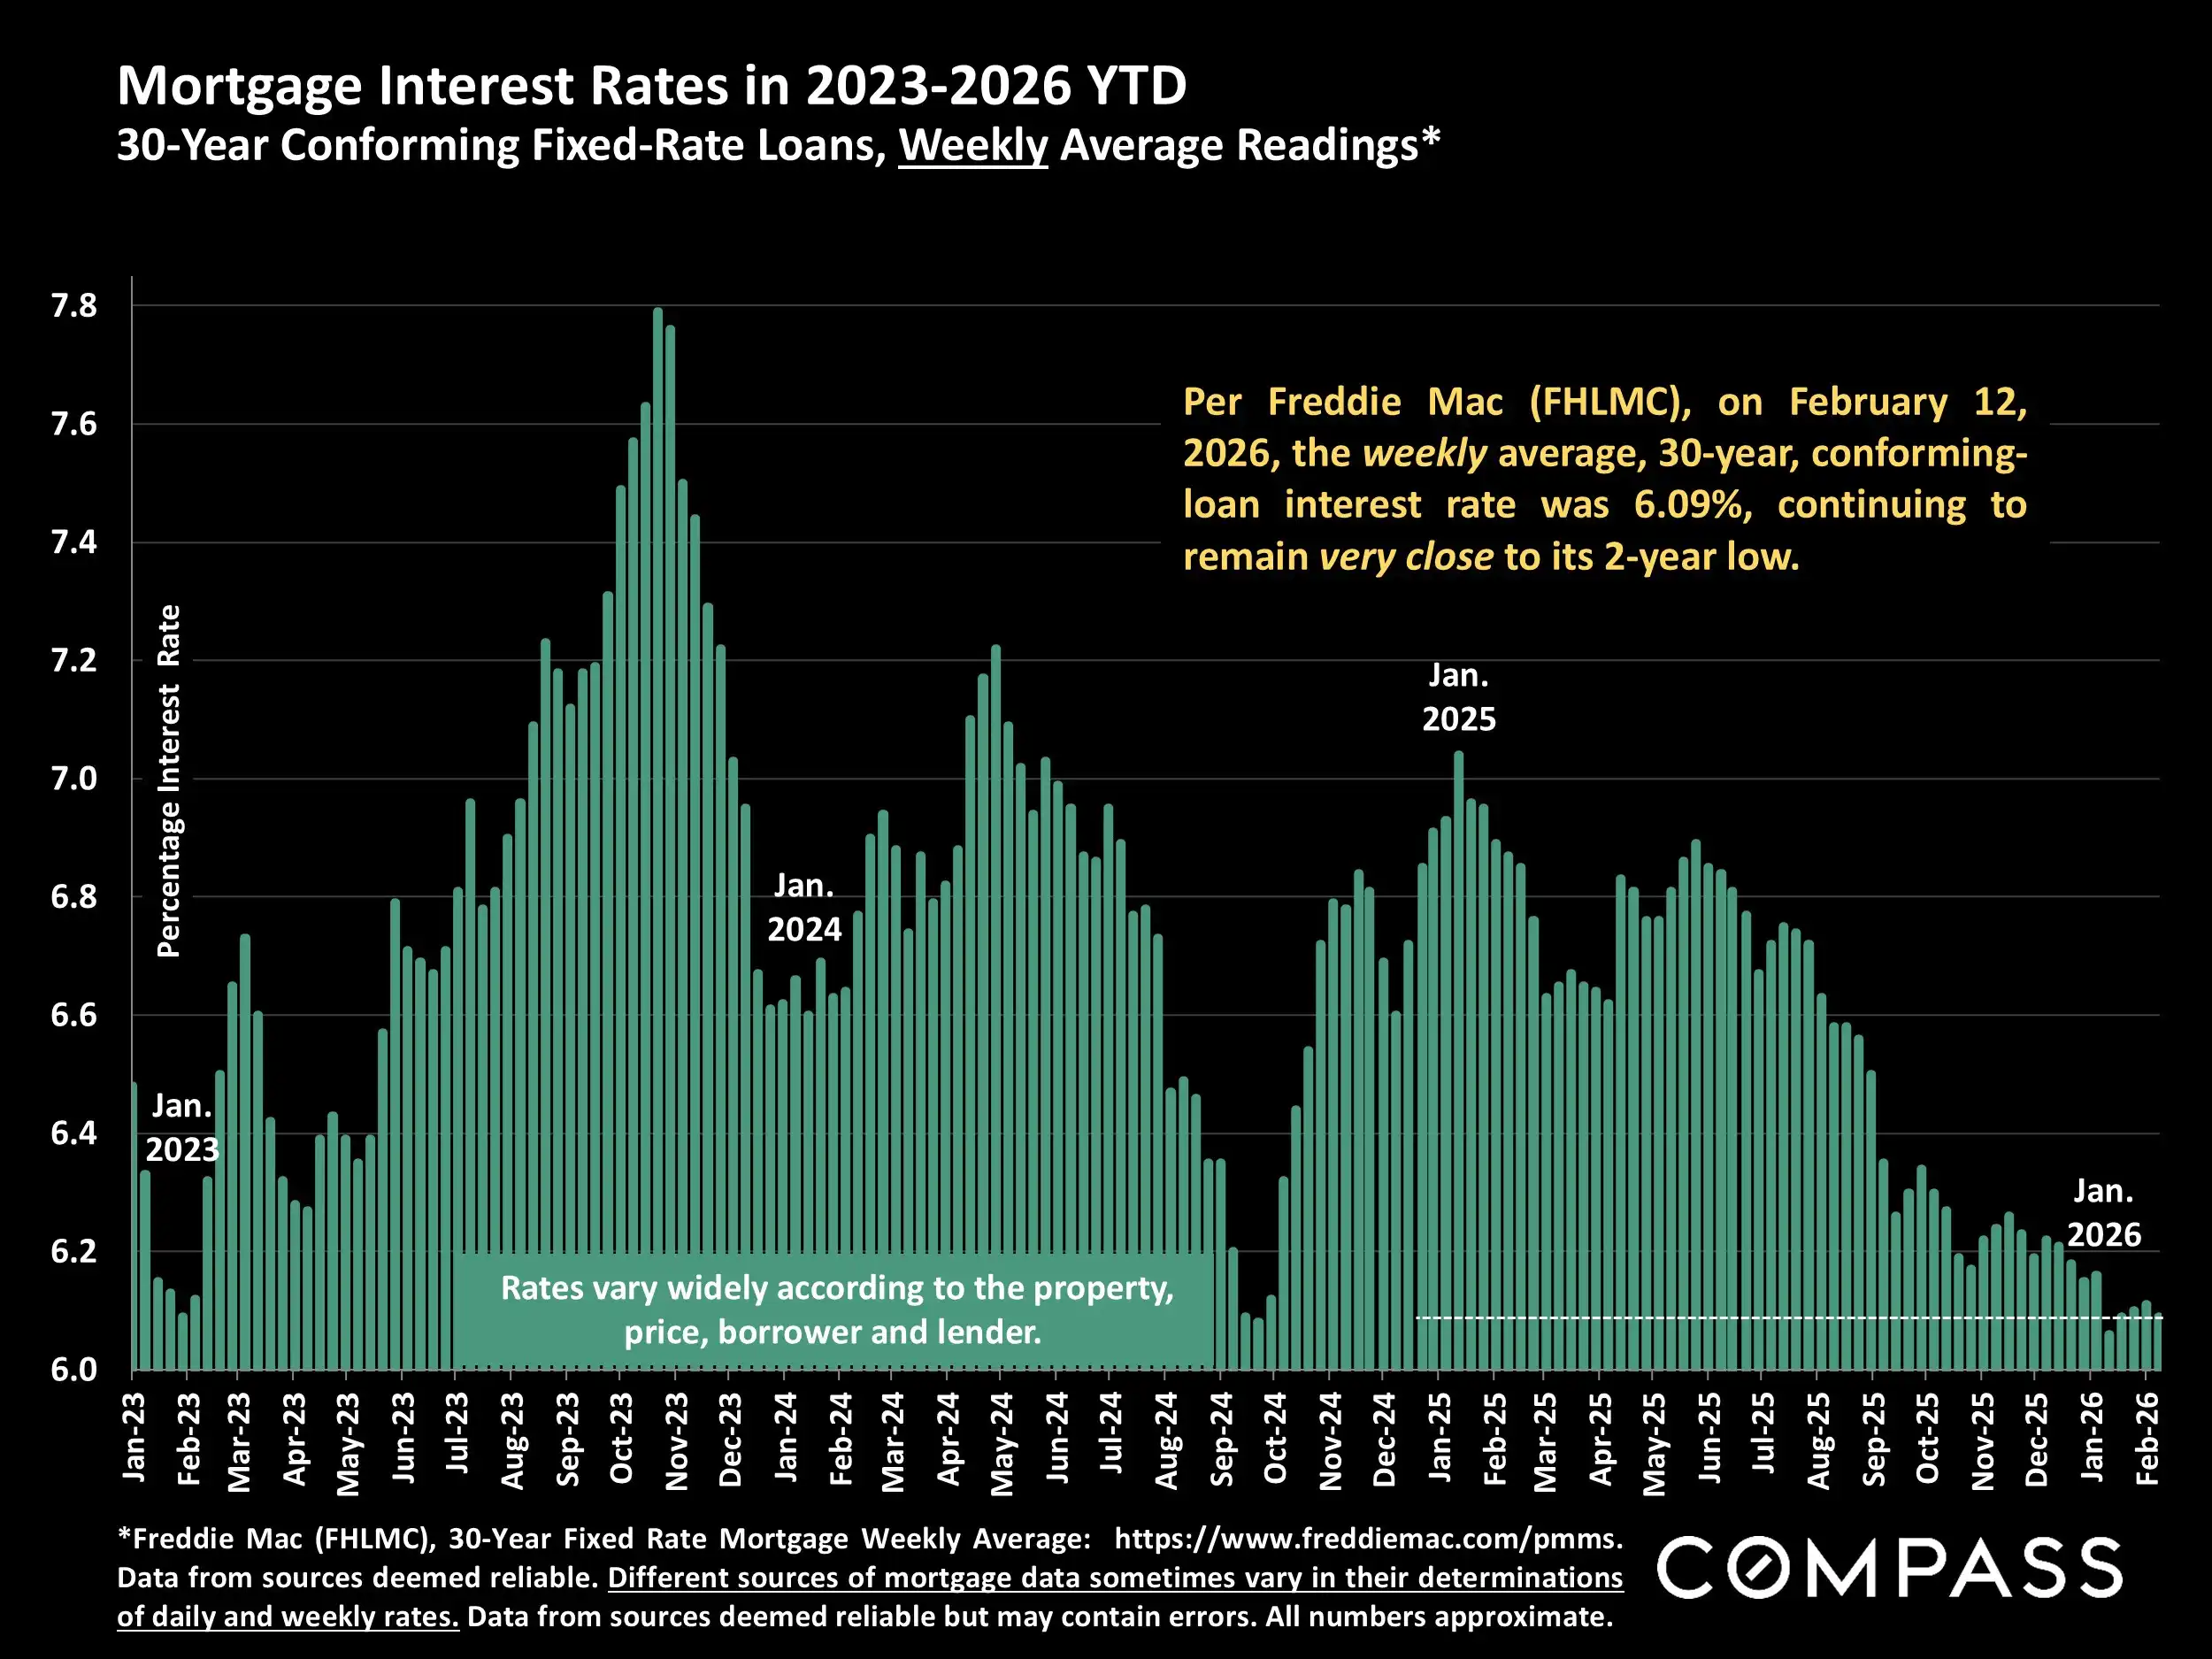
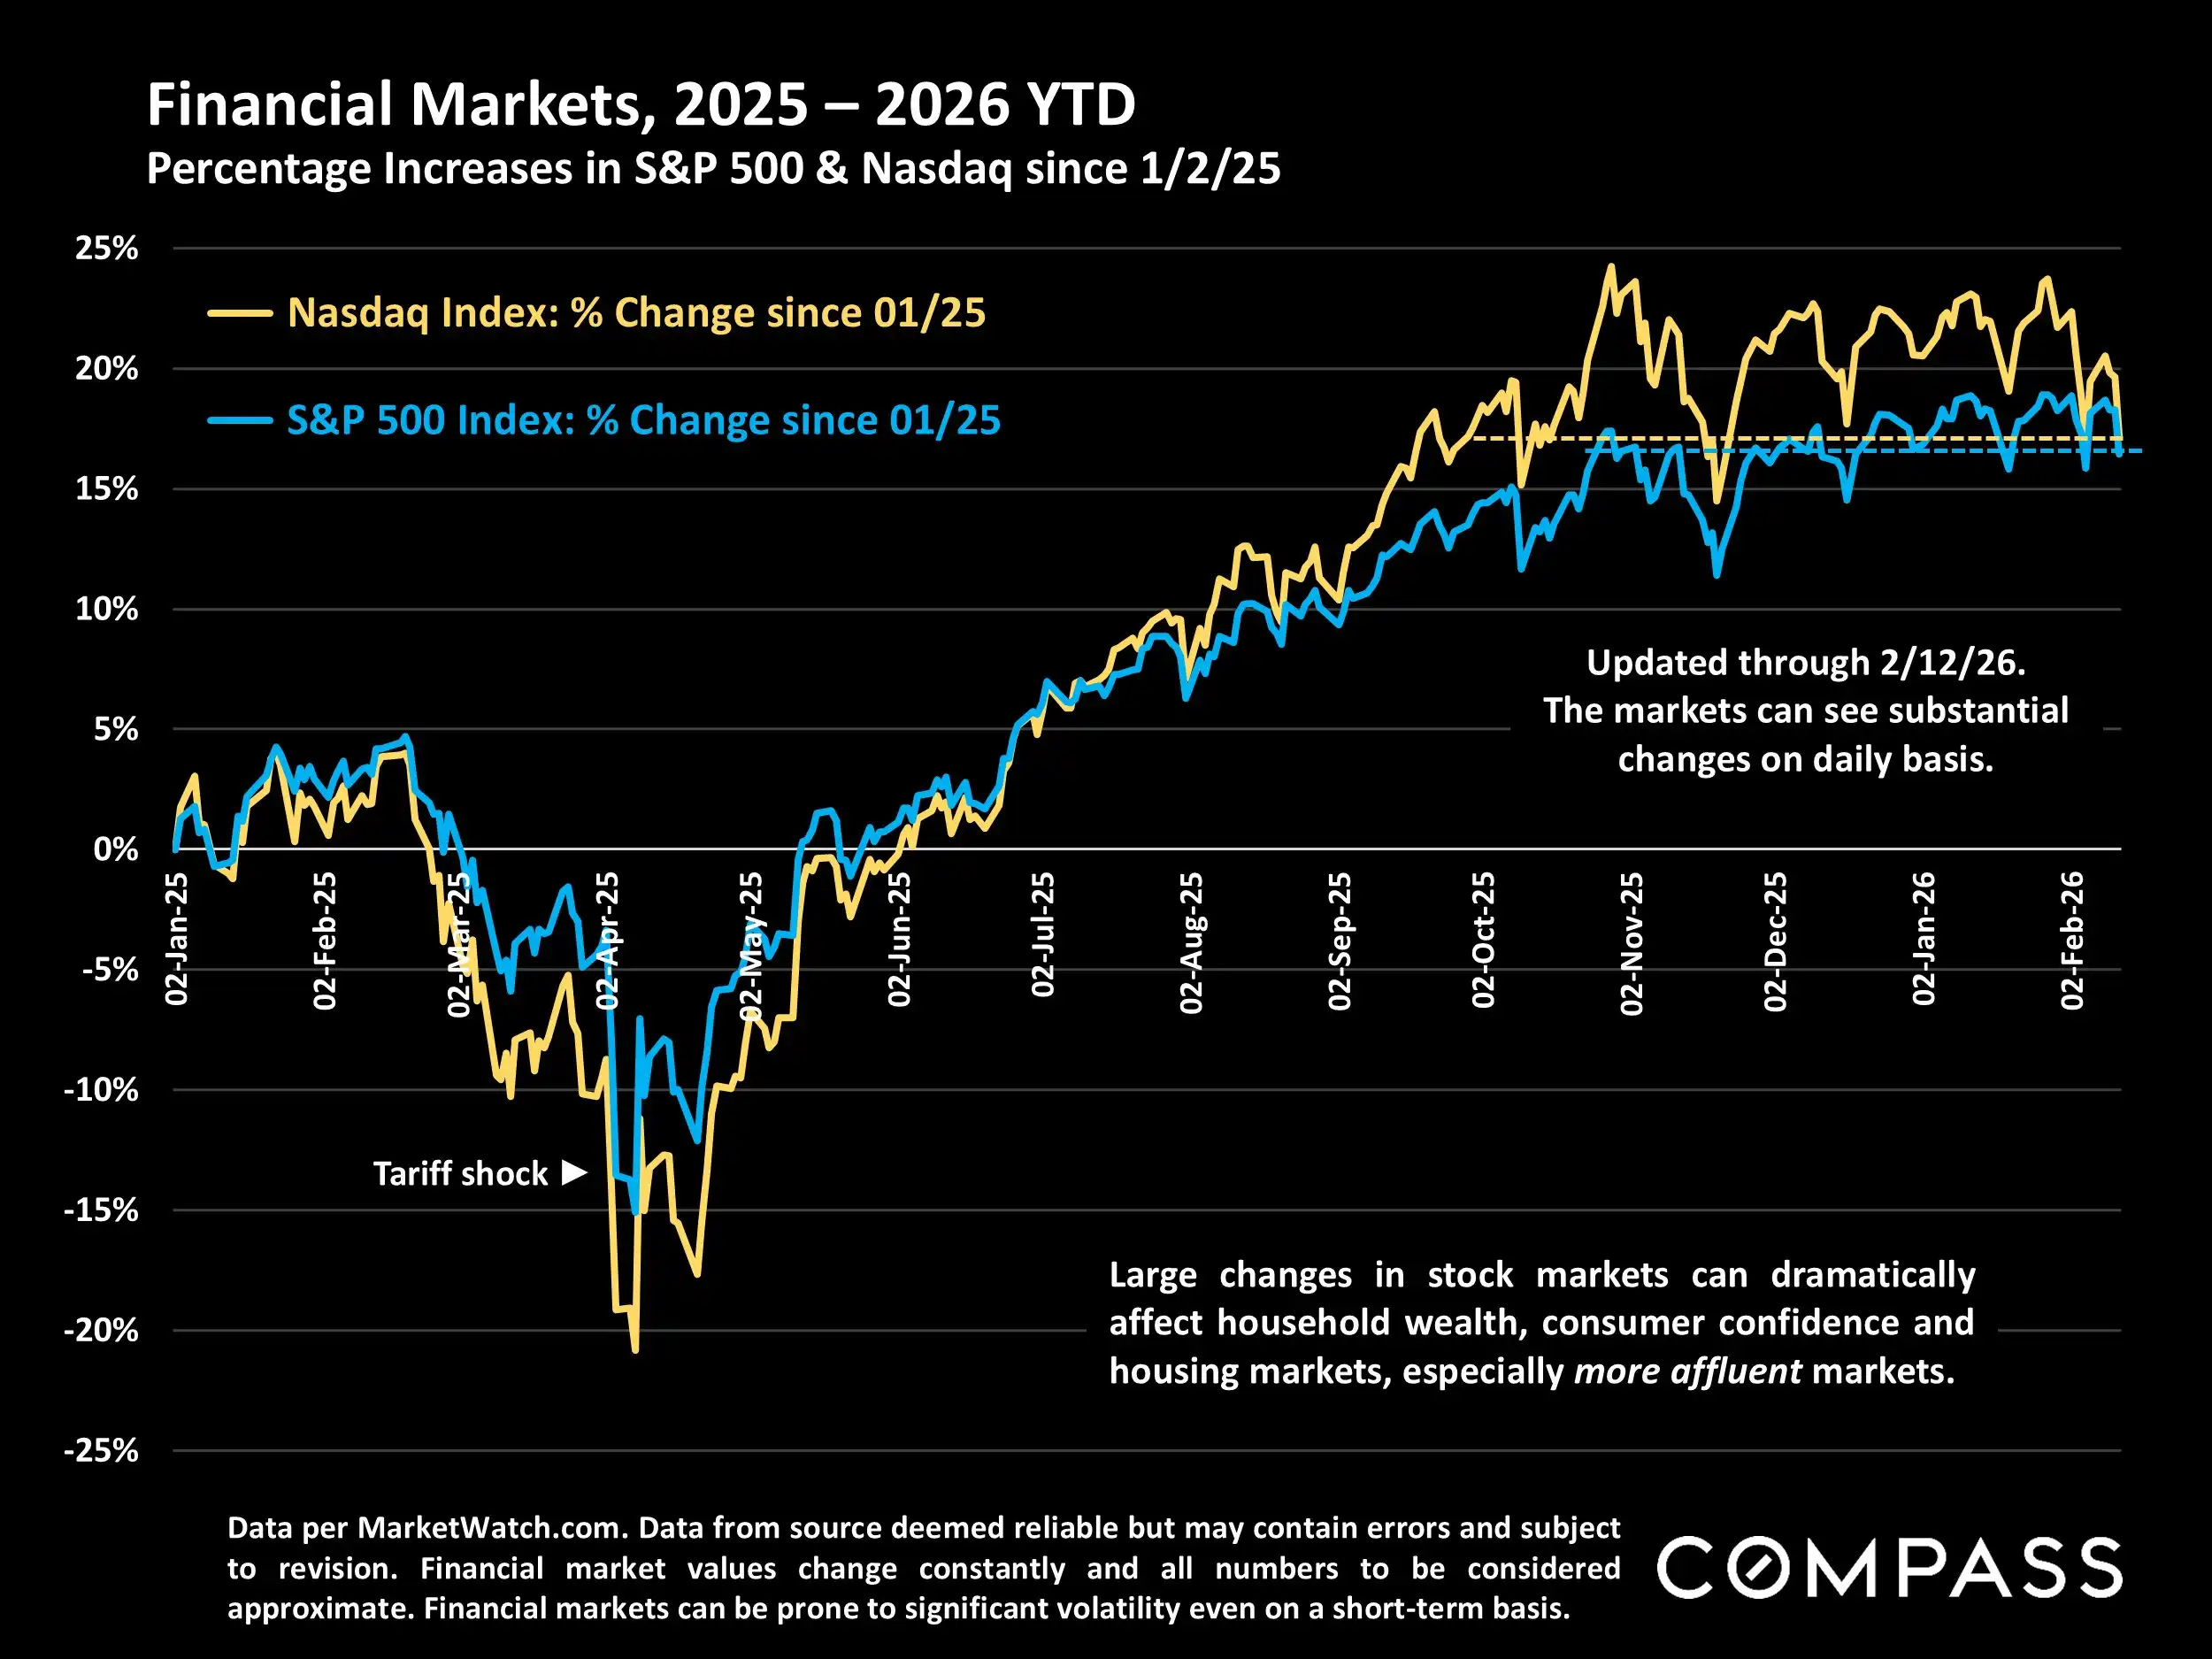
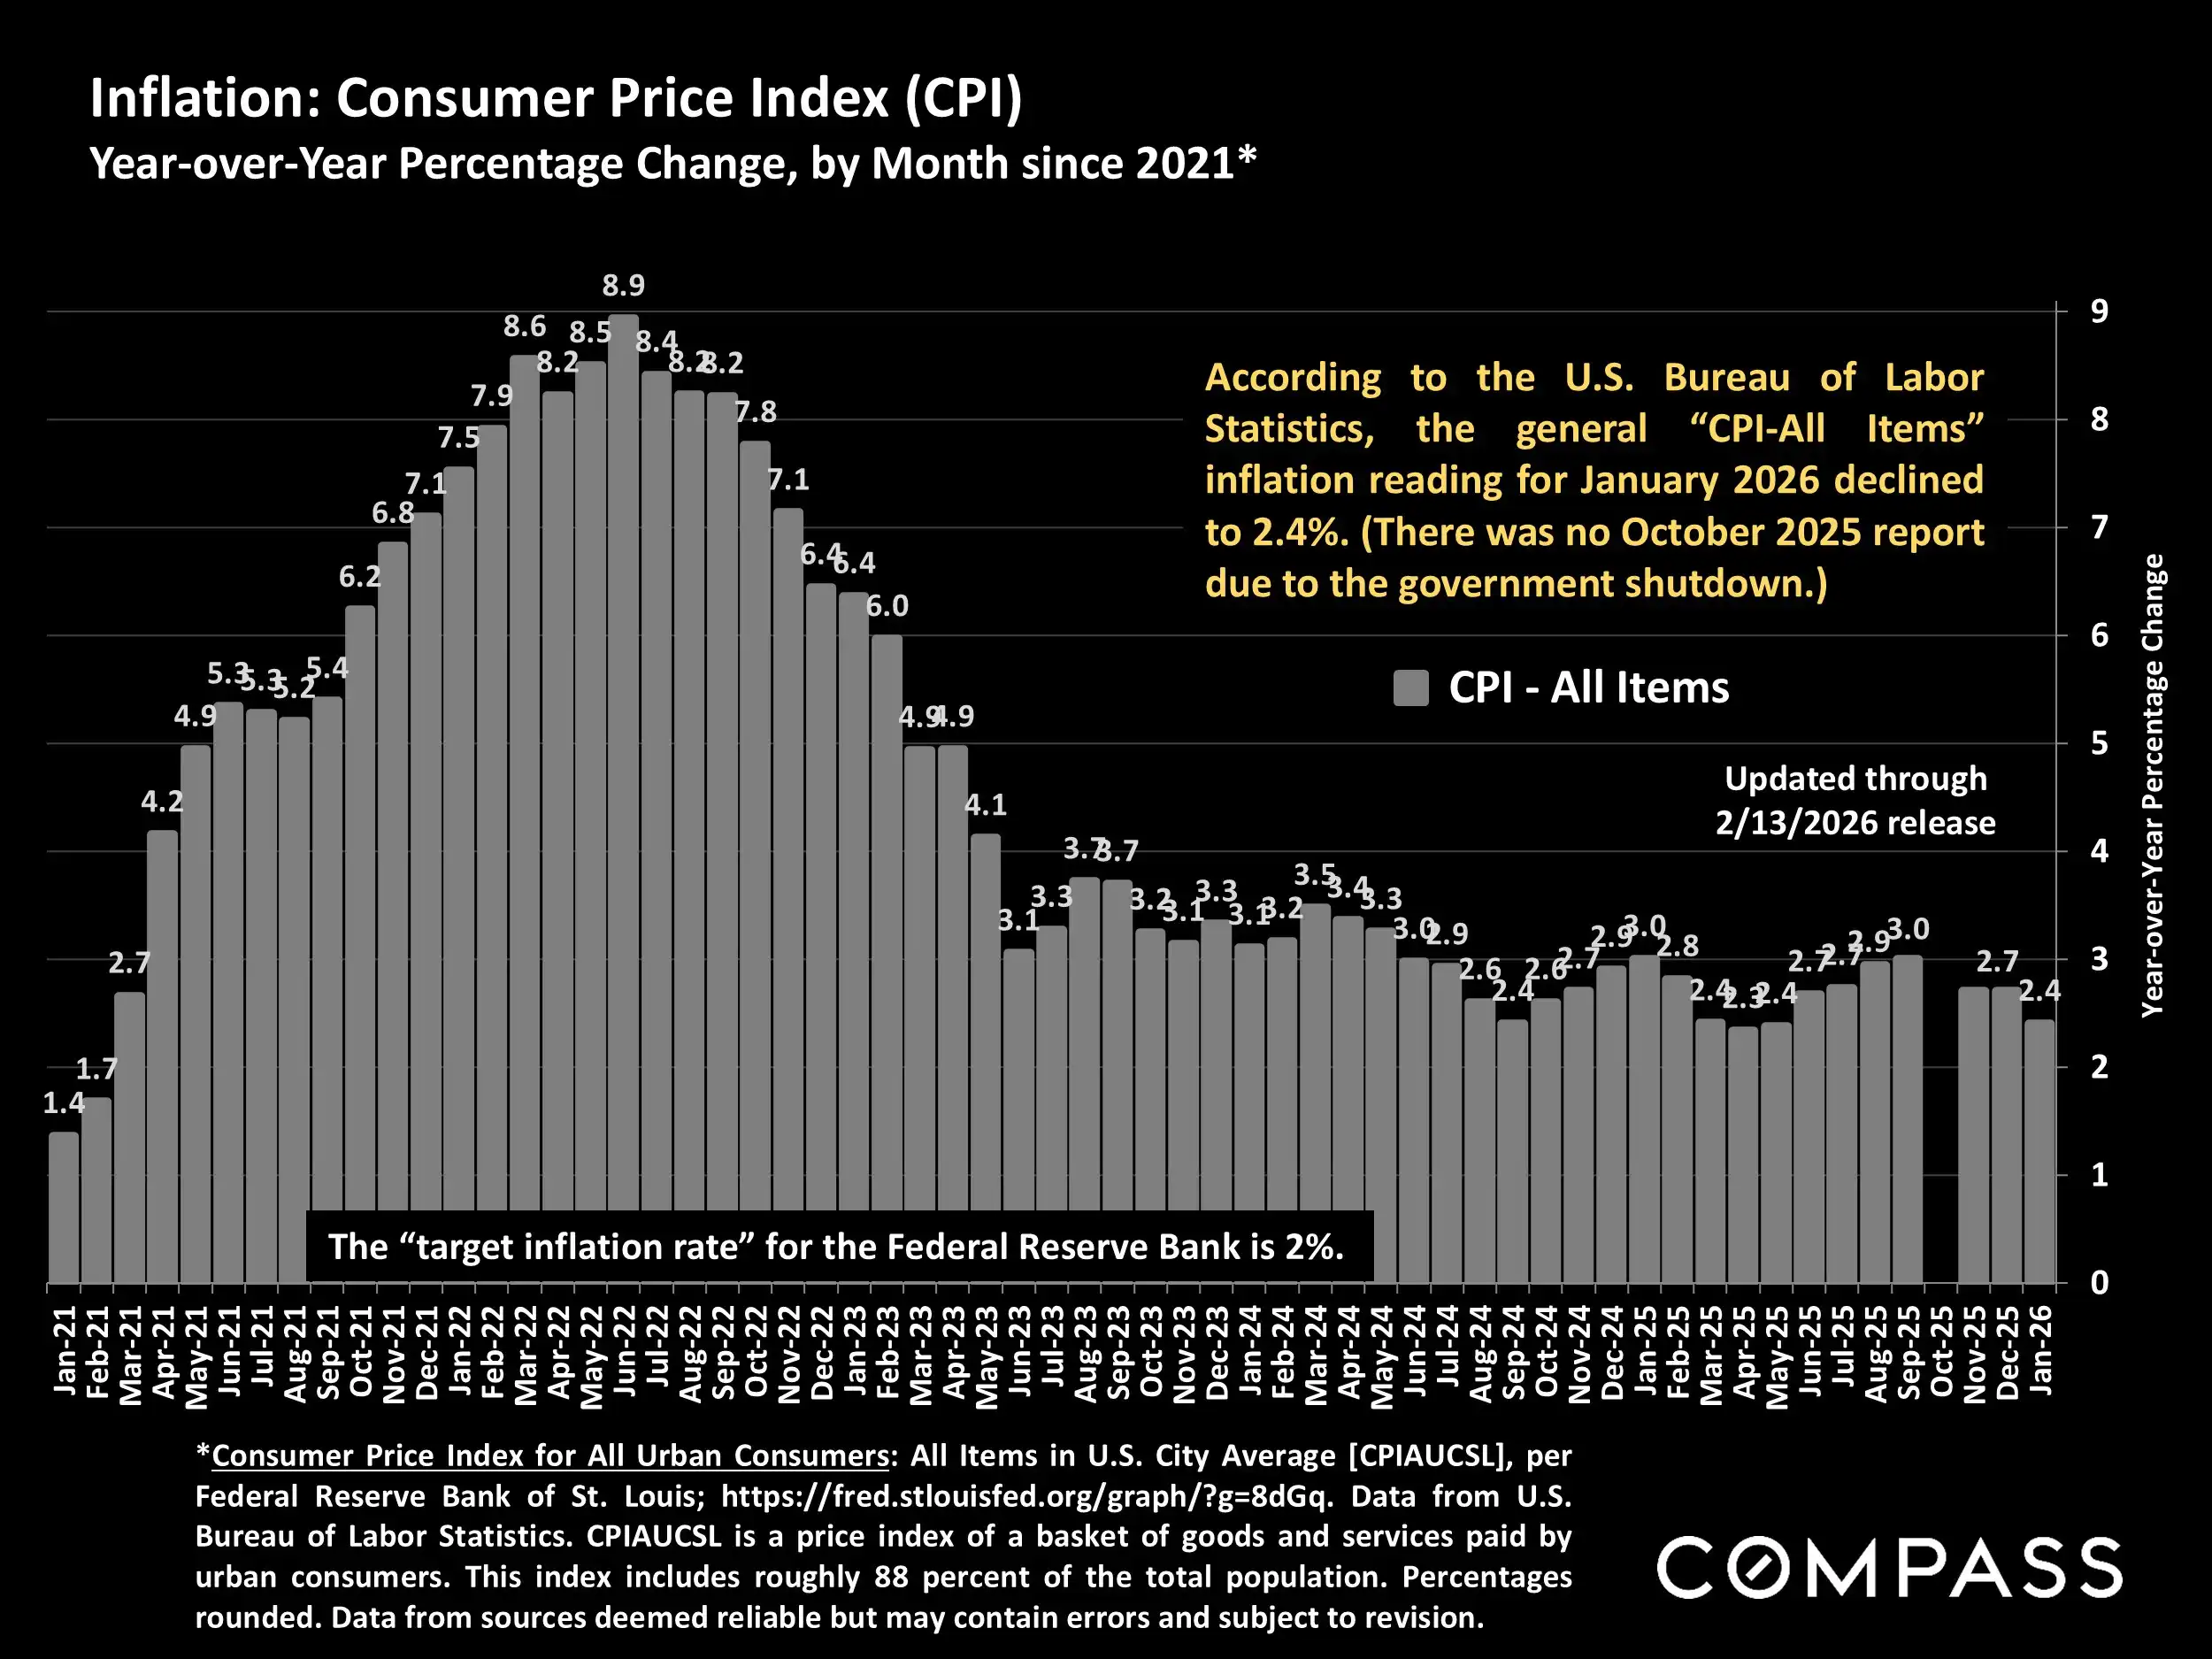
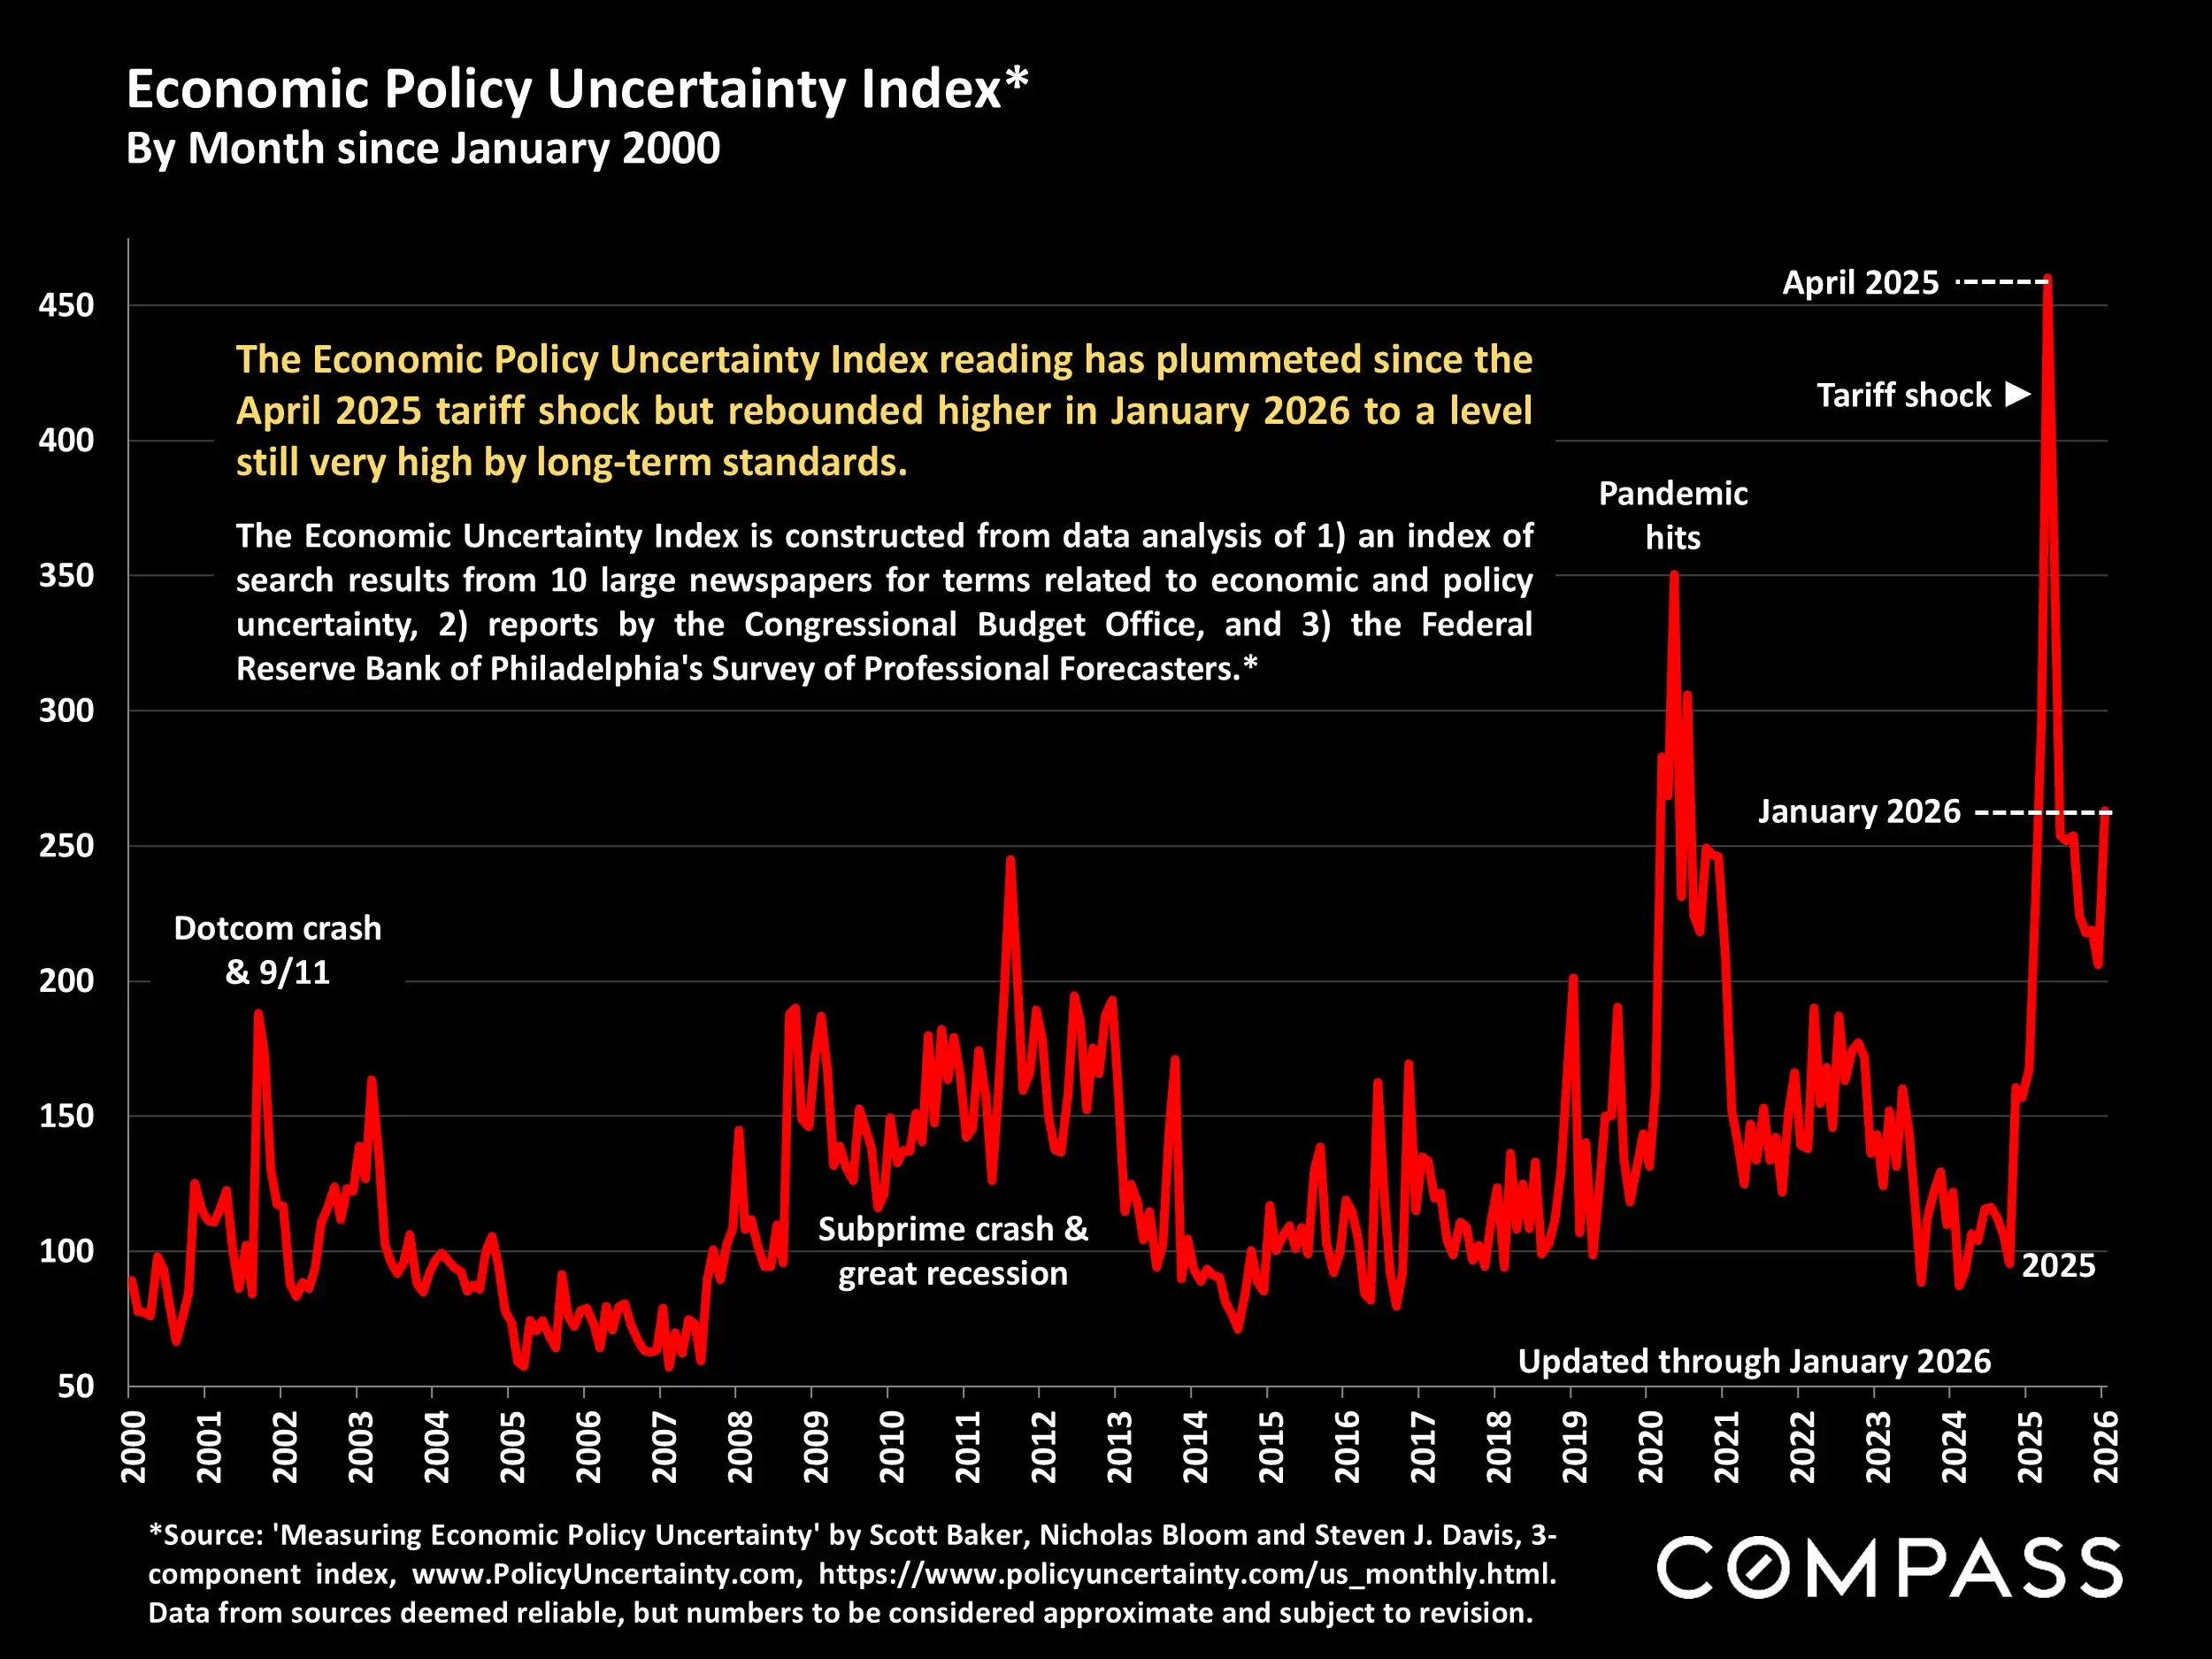
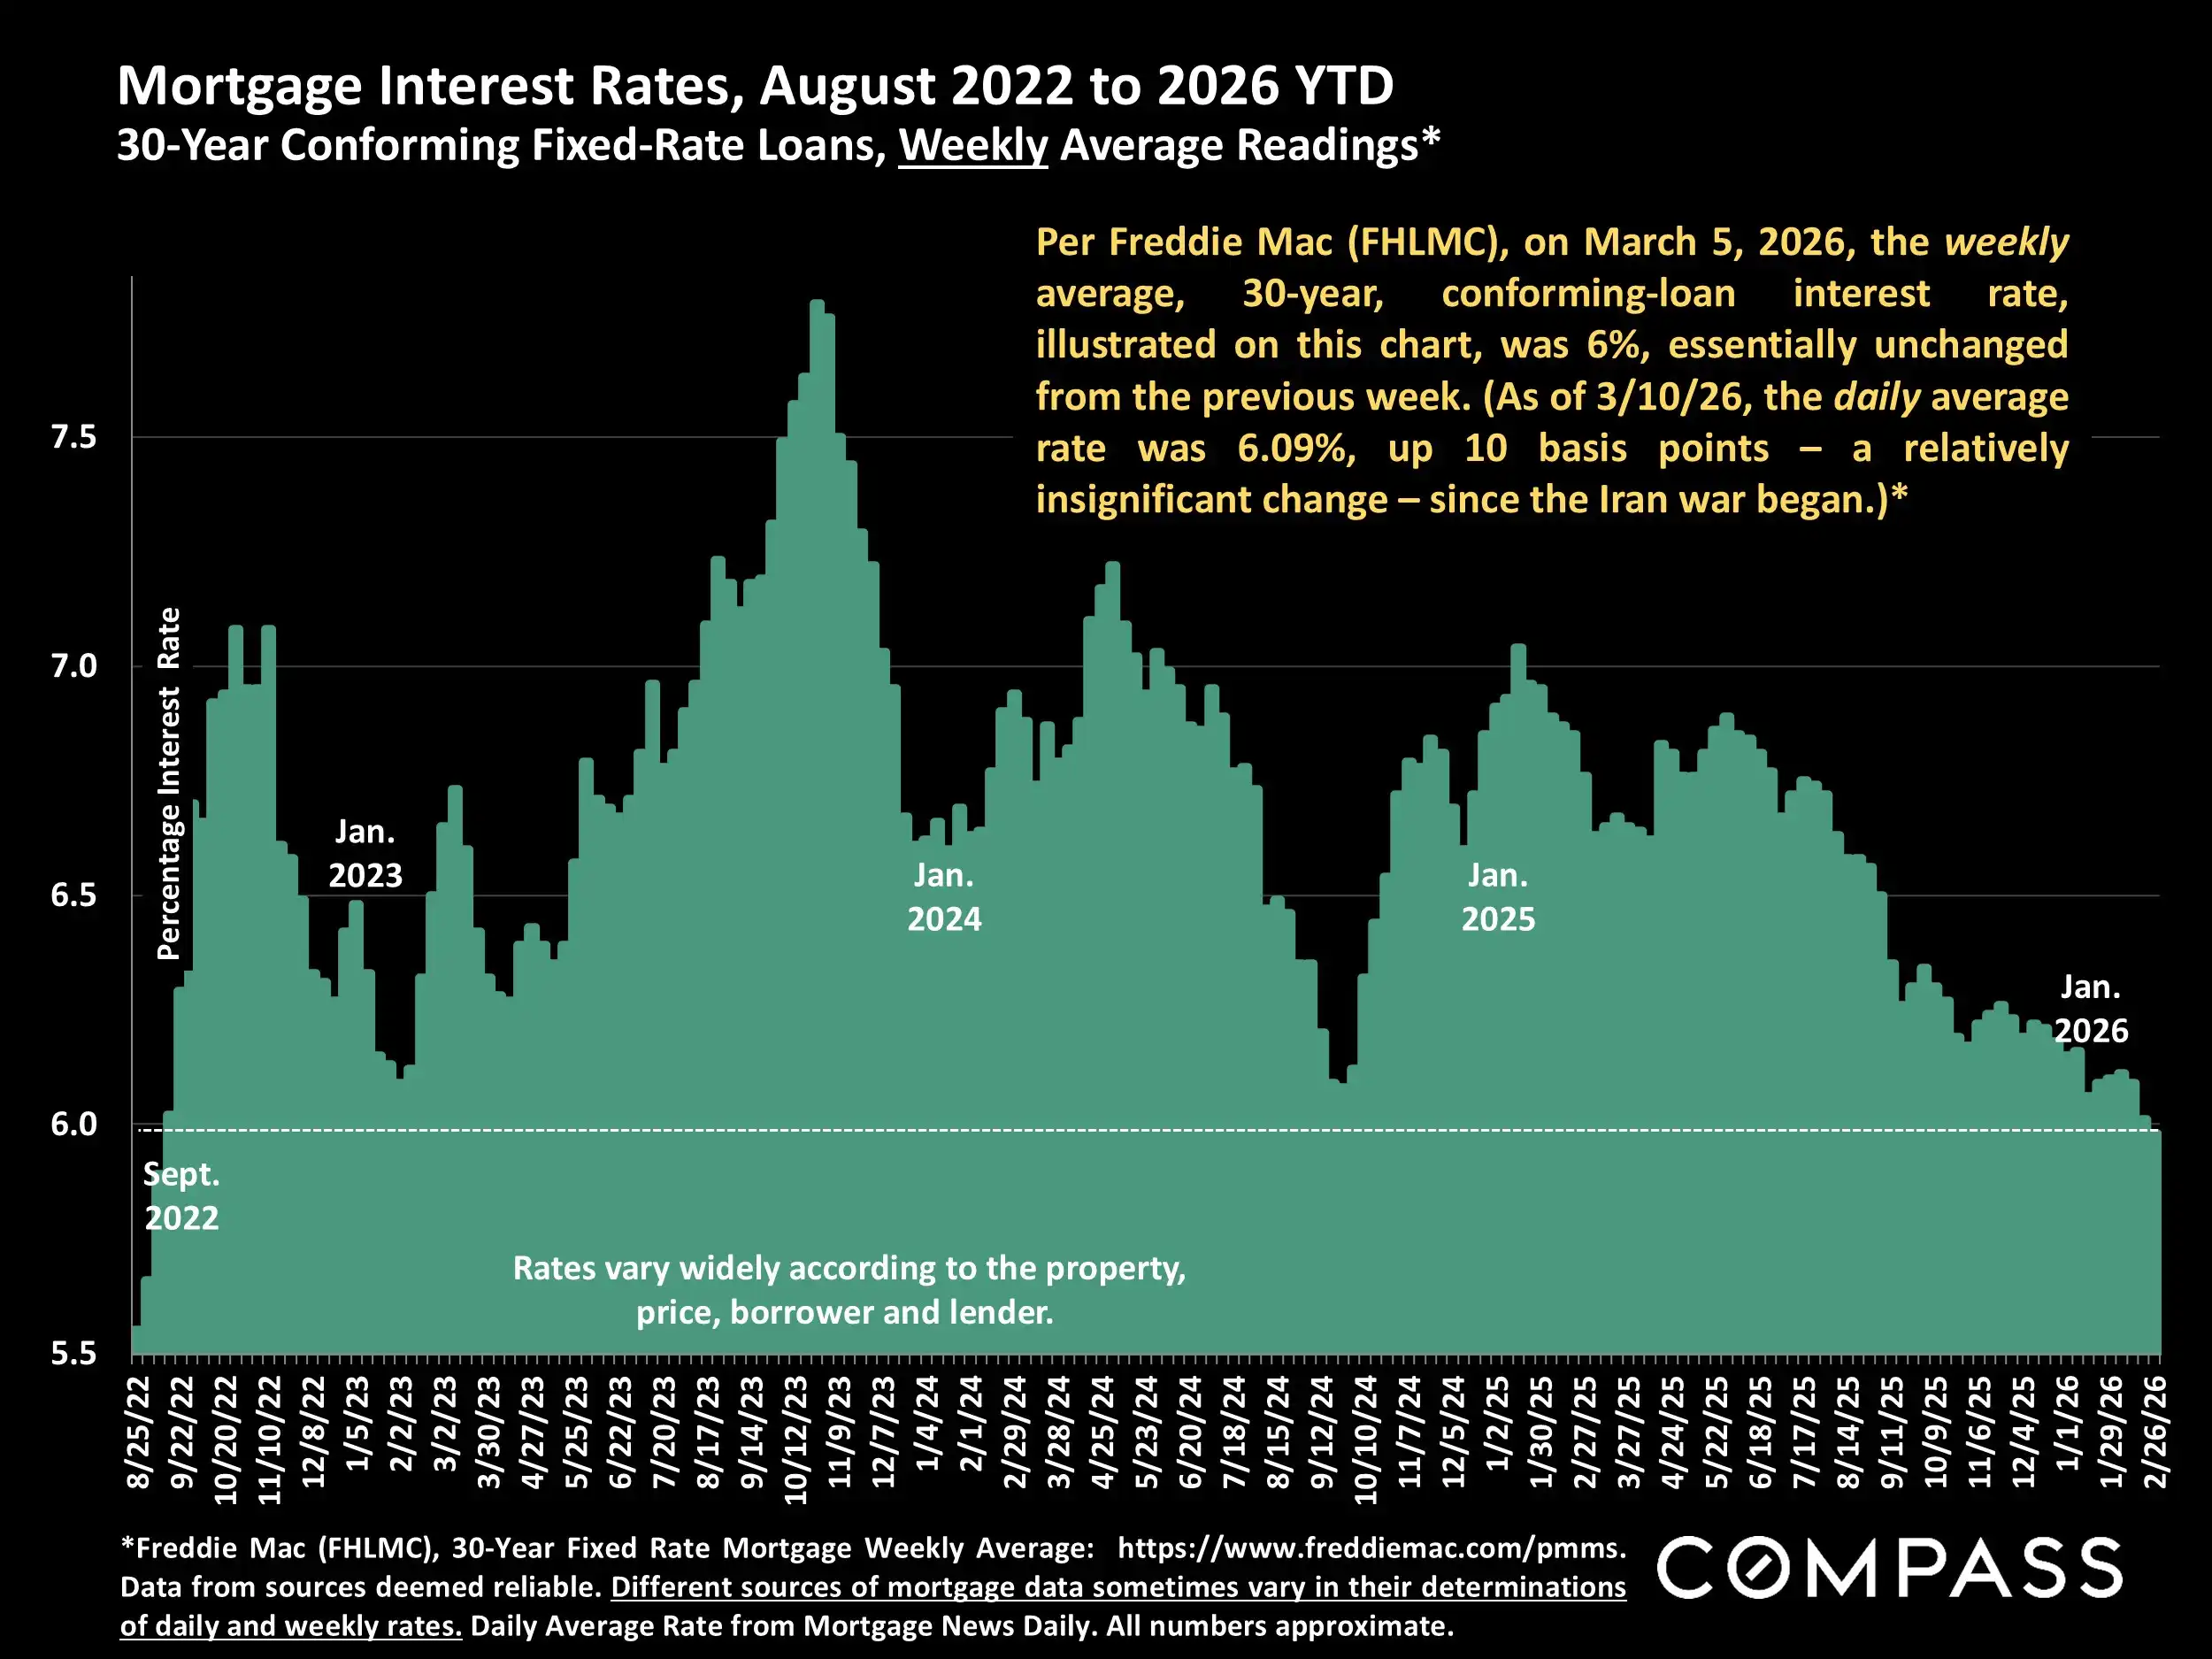
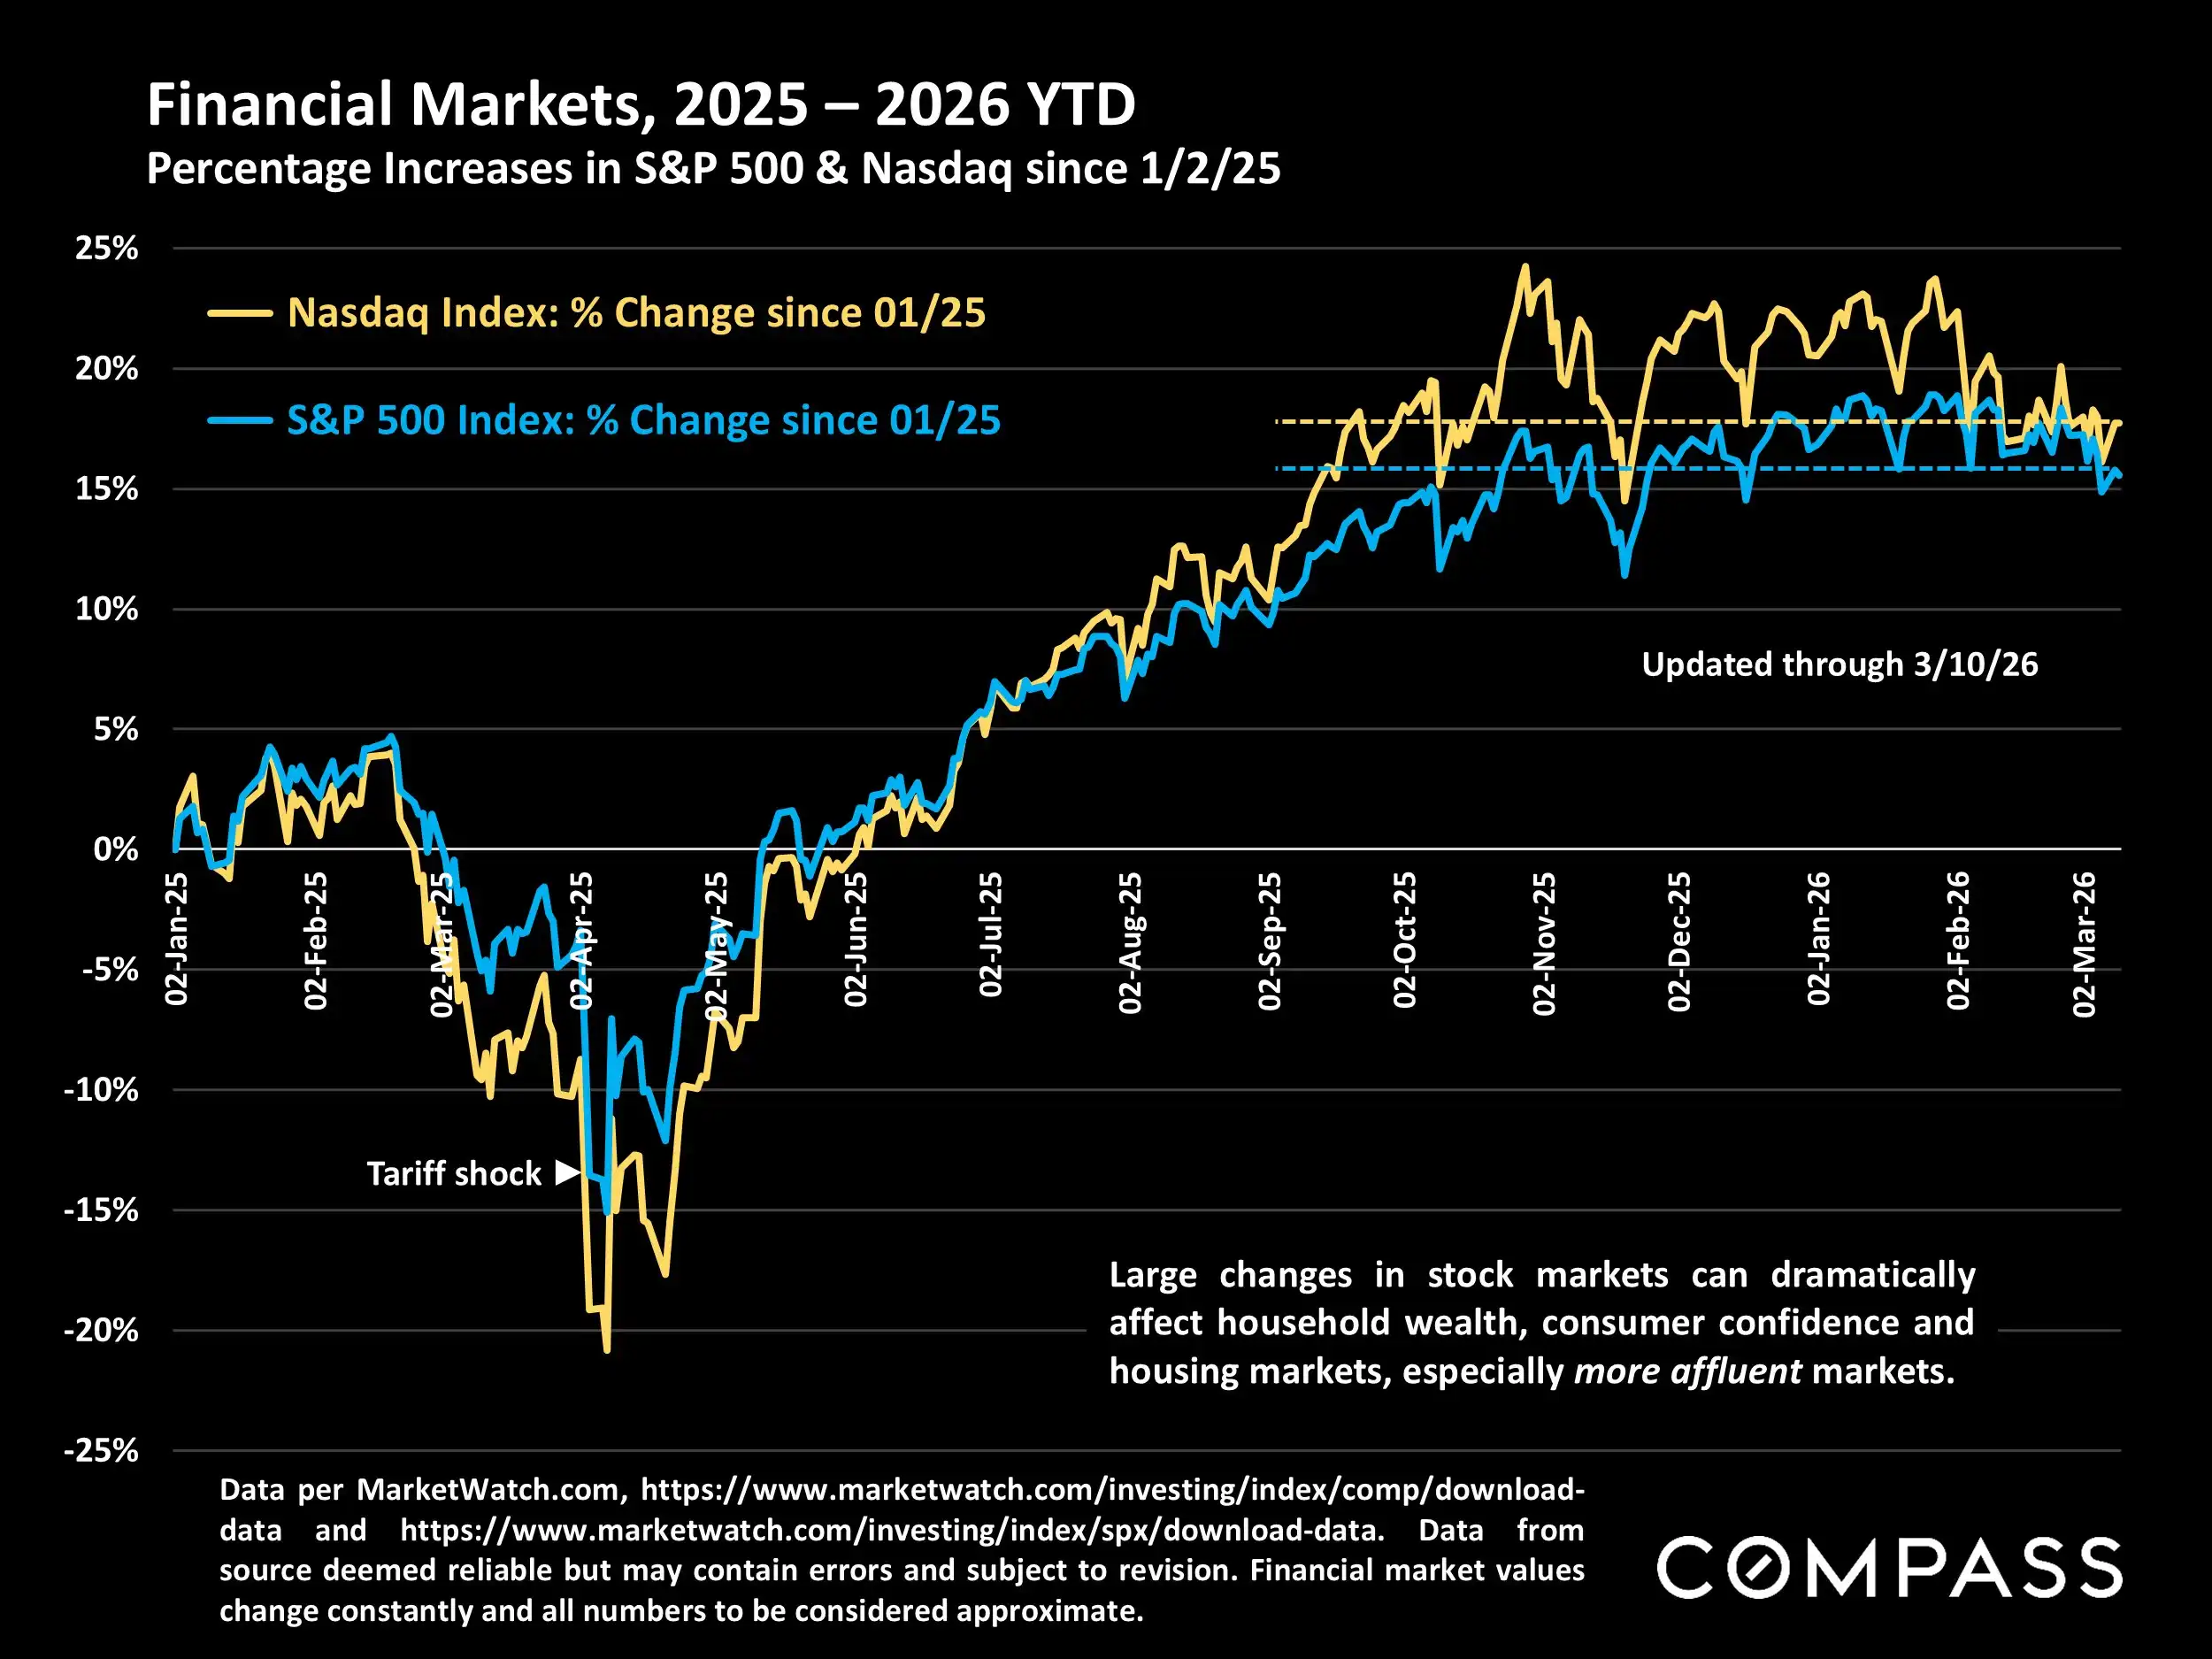
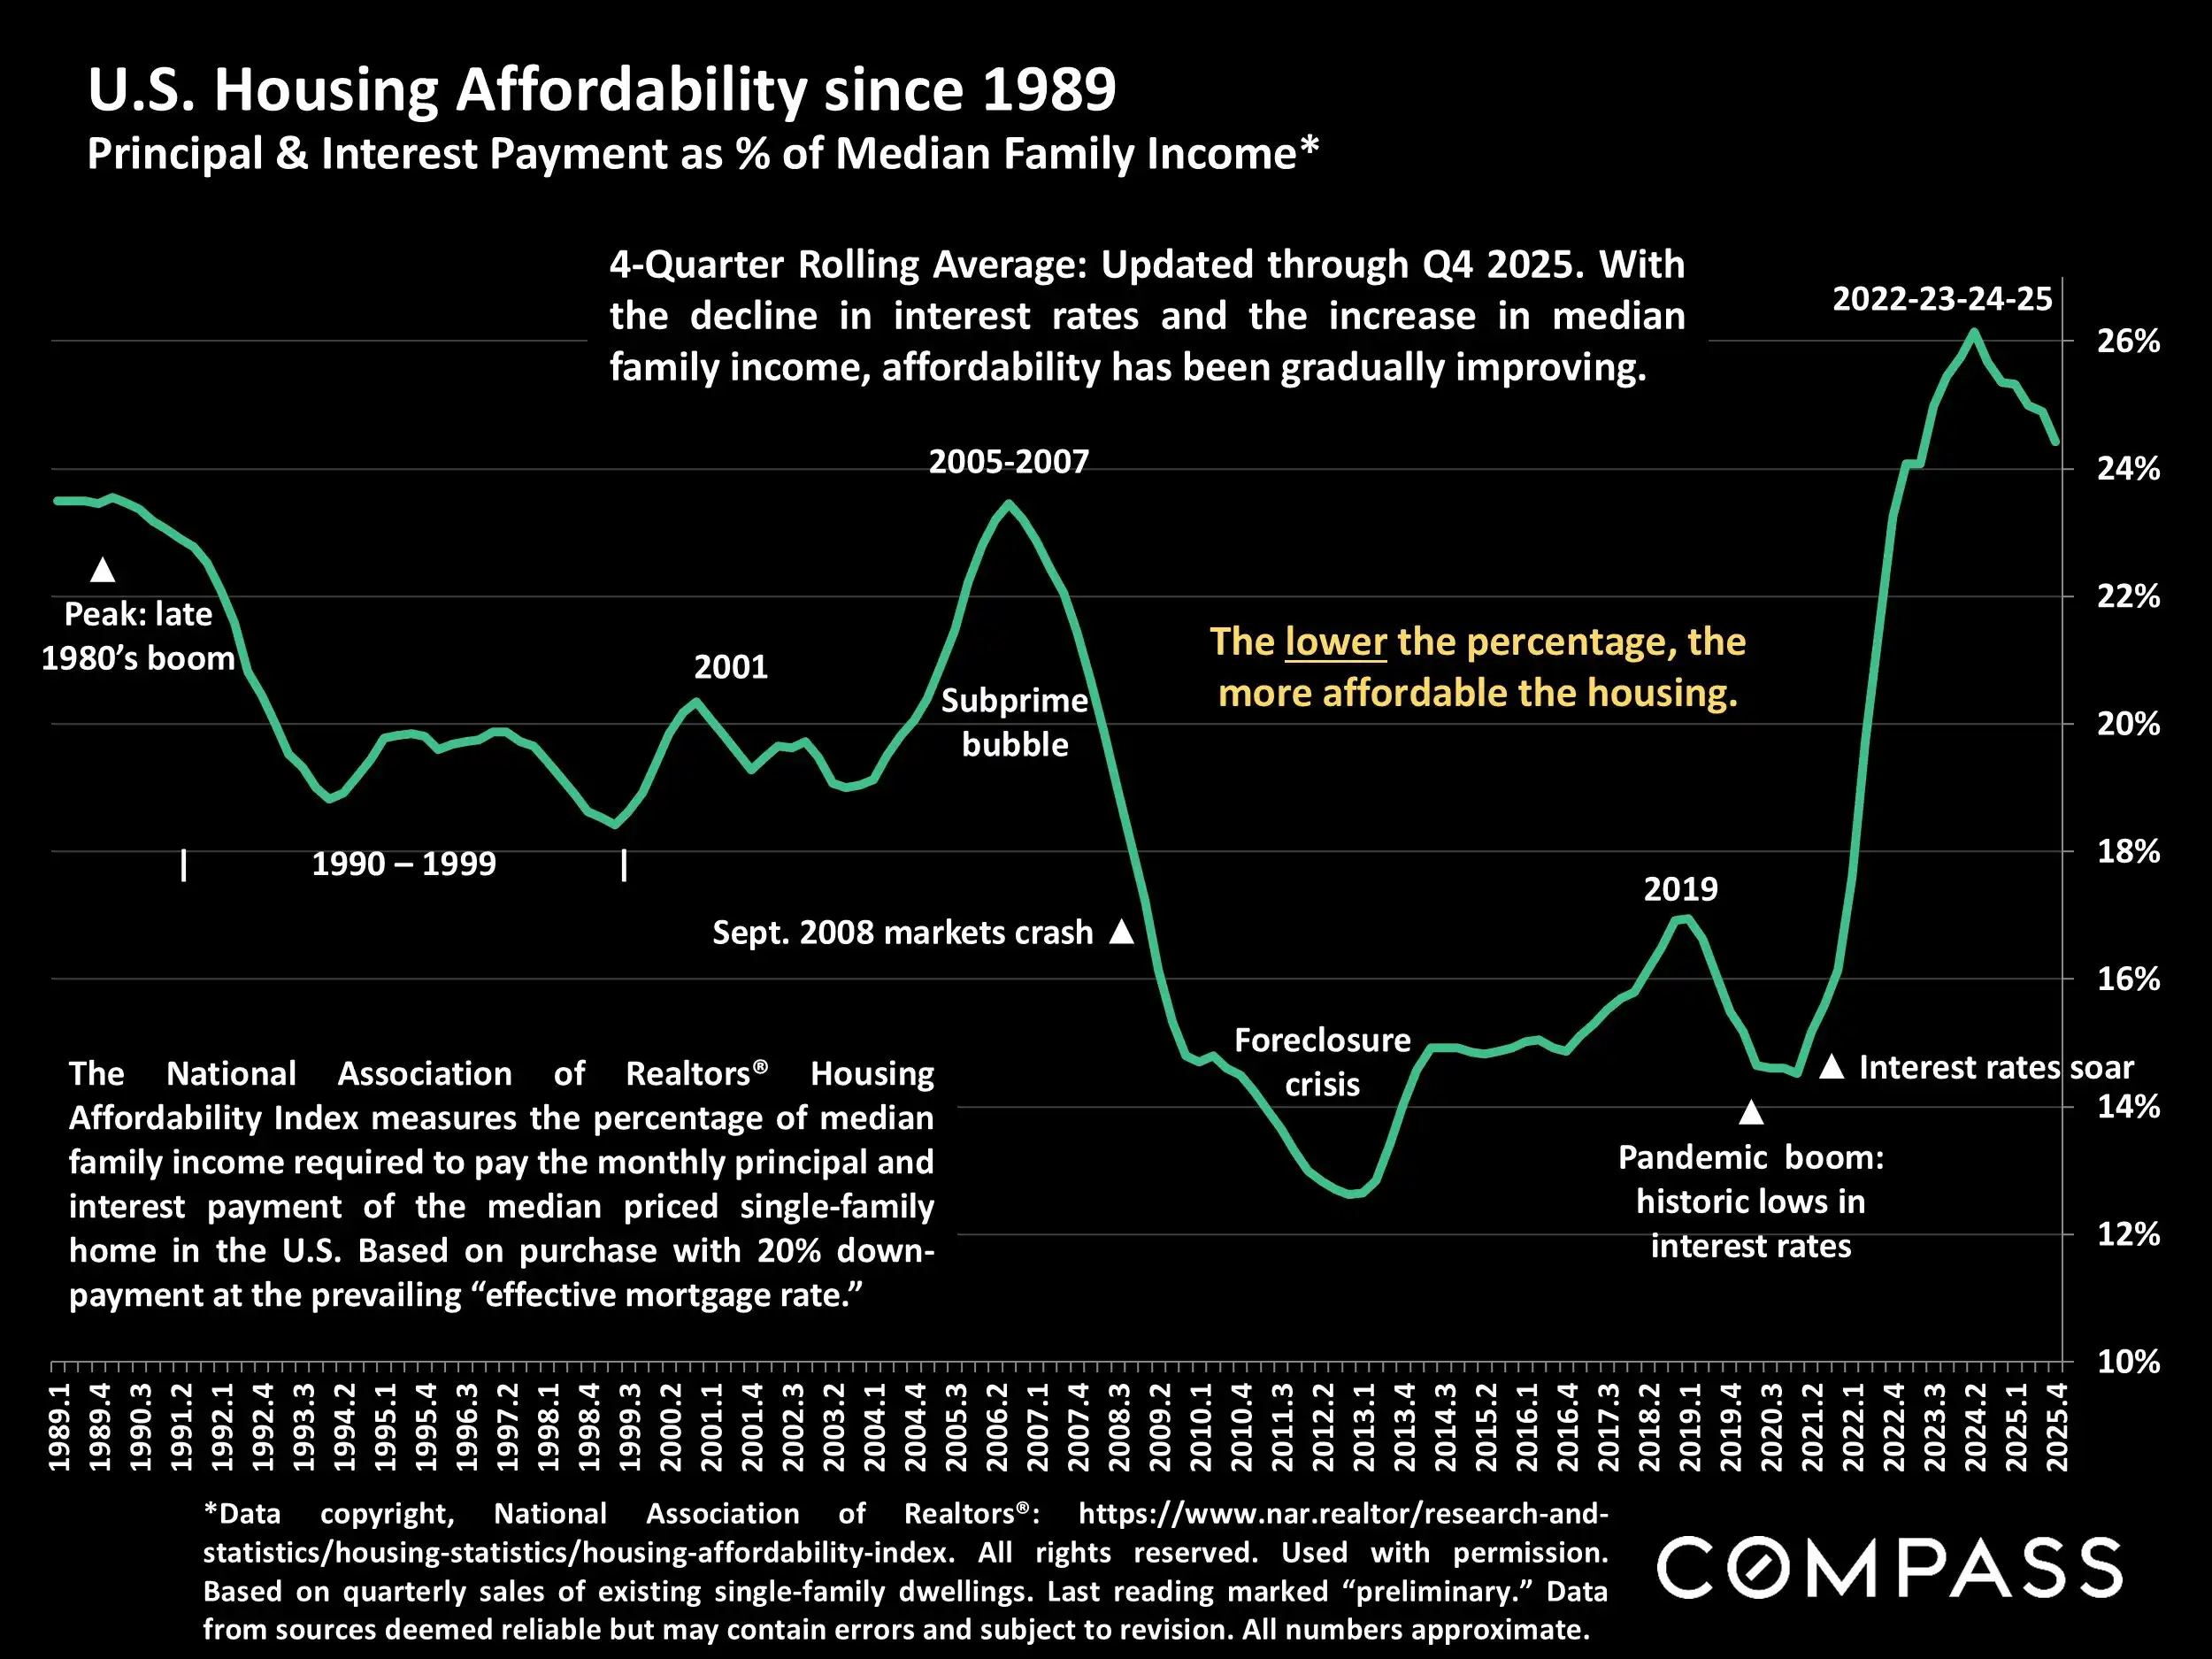
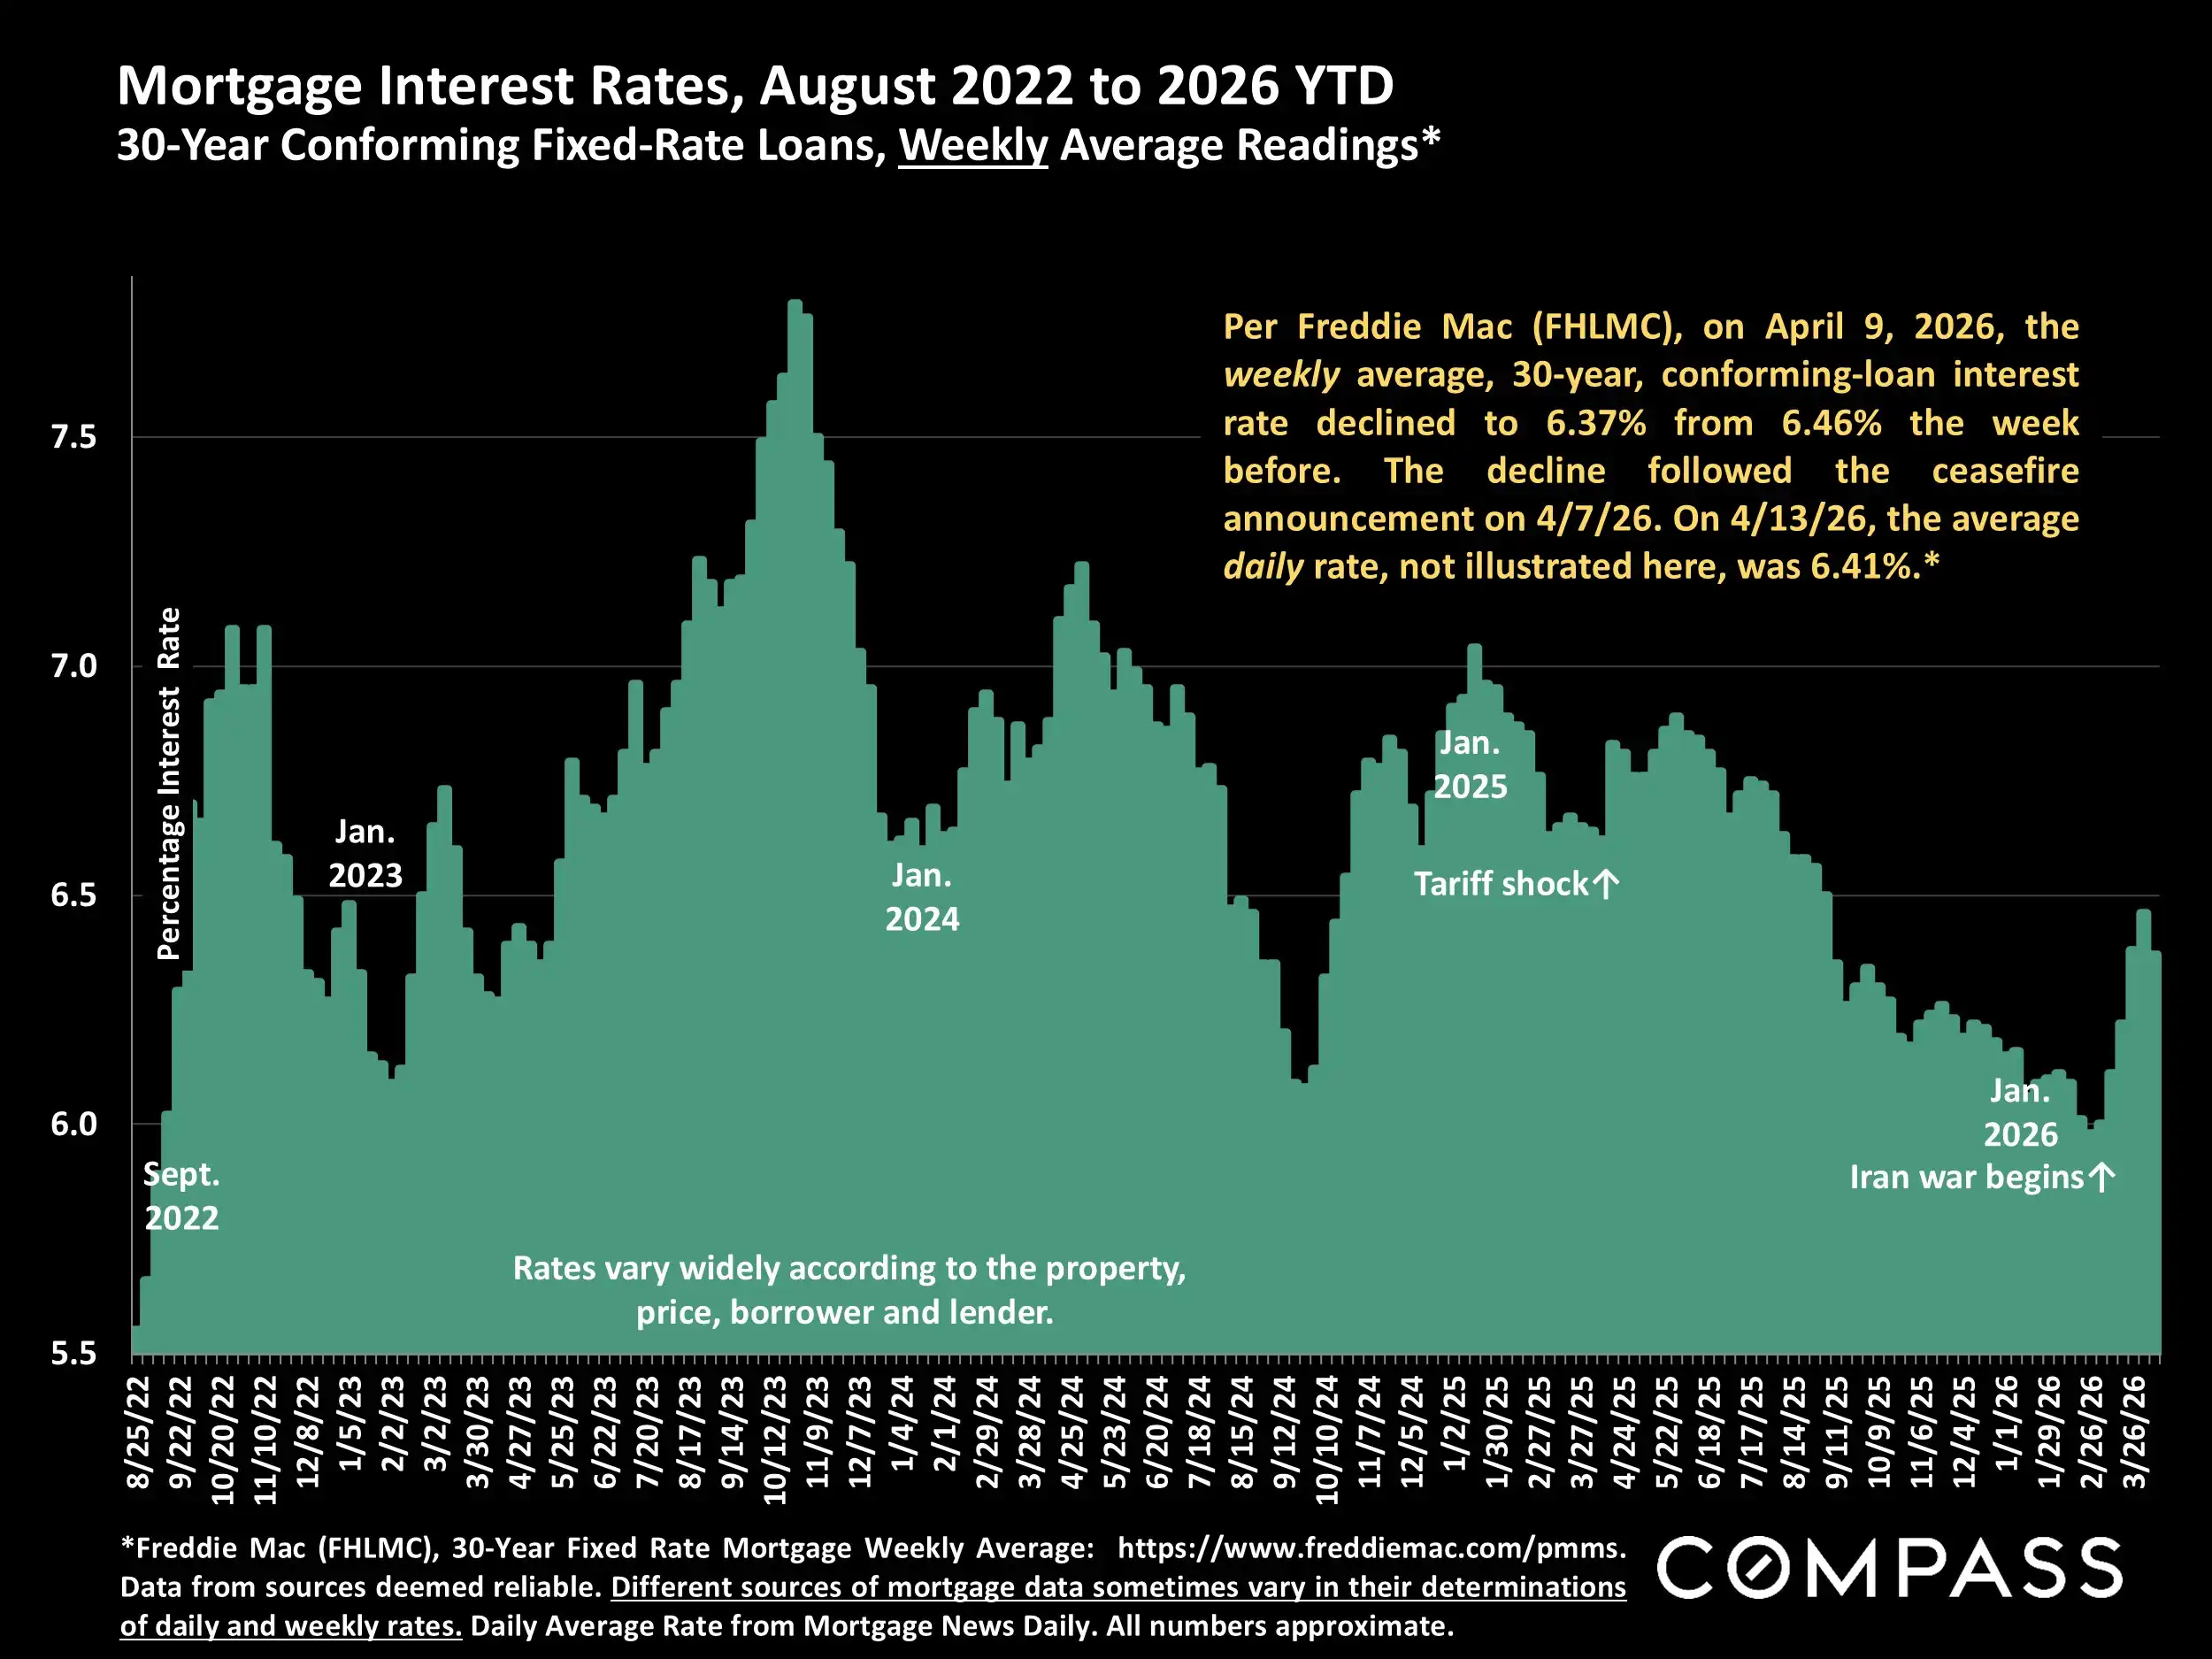
Mortgage rates remained near multi-year lows in mid-February, with the 30-year conforming loan interest rate near 6.09%. That helped support affordability compared with higher-rate periods in 2025, although the report also points to several crosscurrents affecting confidence, including stock market volatility, inflation concerns, employment uncertainty, and broader economic policy uncertainty.
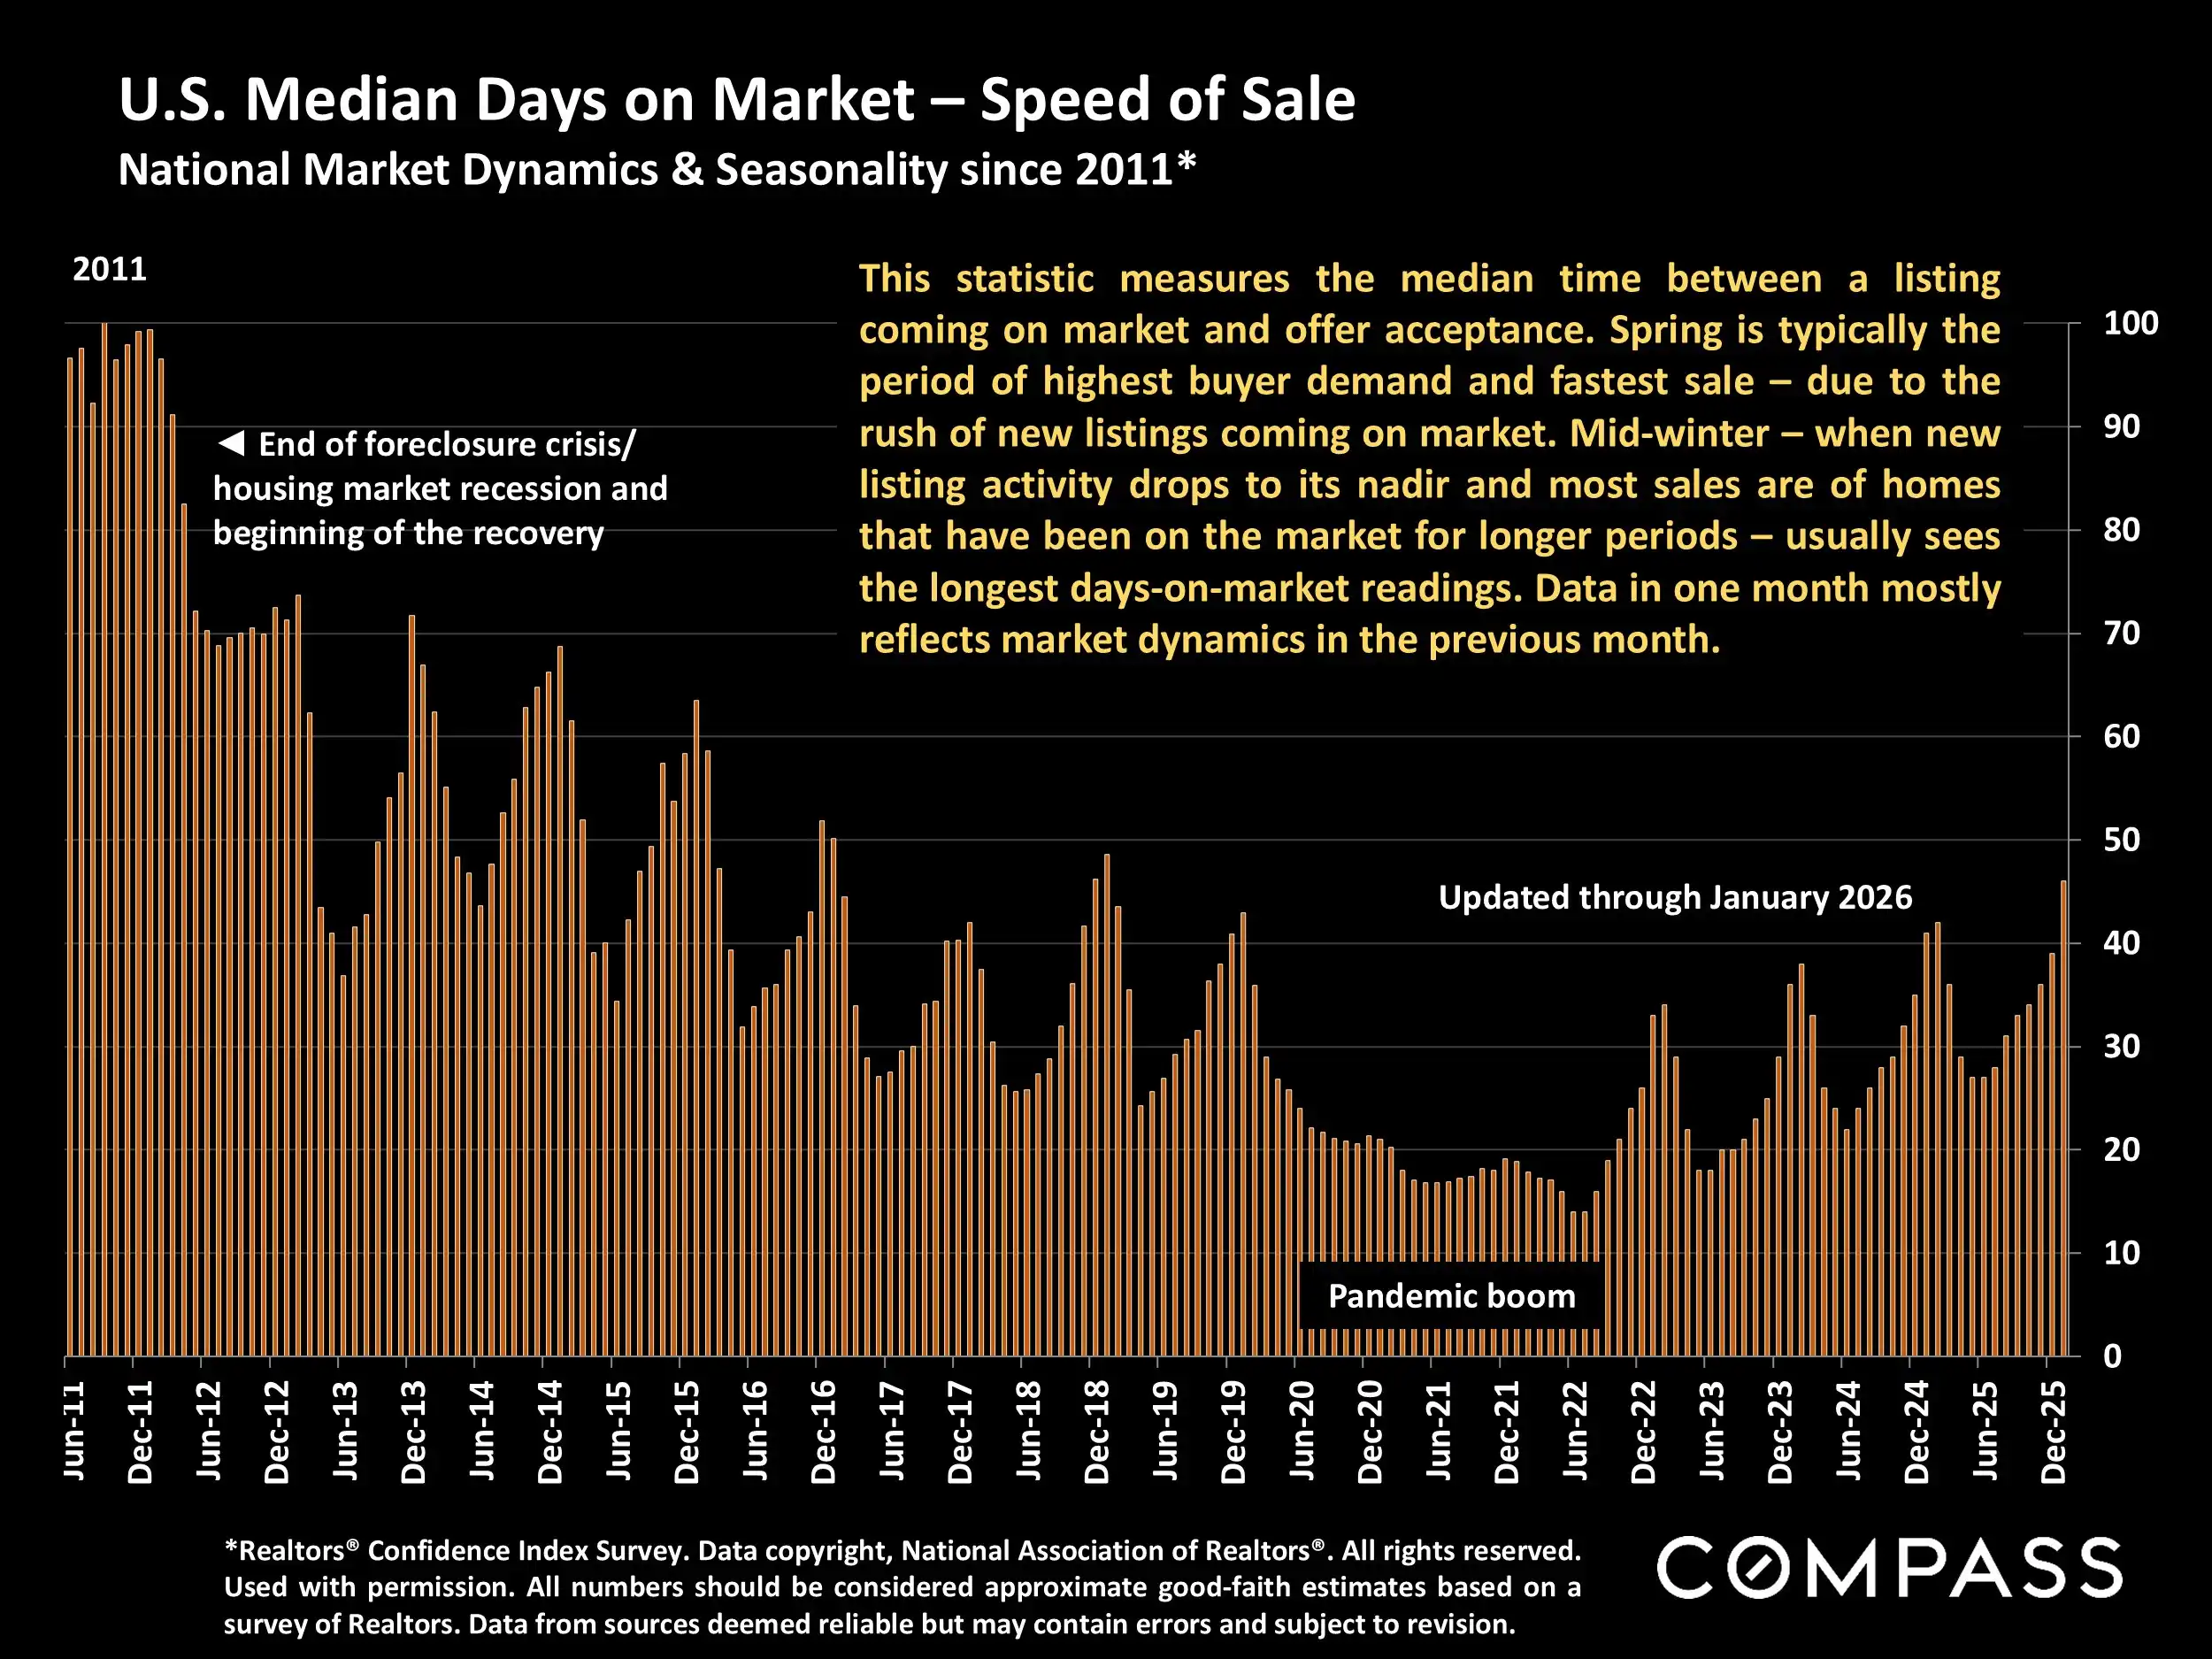
Overall, the February 2026 housing market reflects a gradual move toward better balance. Buyers are seeing more options and slightly more time to make decisions, with median time on market rising to 46 days, up from 41 days one year earlier. For both buyers and sellers, the key takeaway is that market conditions are improving, but strategy still matters. Pricing, timing, preparation, and local market knowledge will be especially important as inventory and buyer activity build into the spring season.
Market at a Glance
Mortgage Rates: Rates remained near multi-year lows in mid-February, helping support affordability.
Sales Activity: January sales were soft, falling about 7% year over year.
Home Prices: The national median single-family home sales price rose slightly year over year.
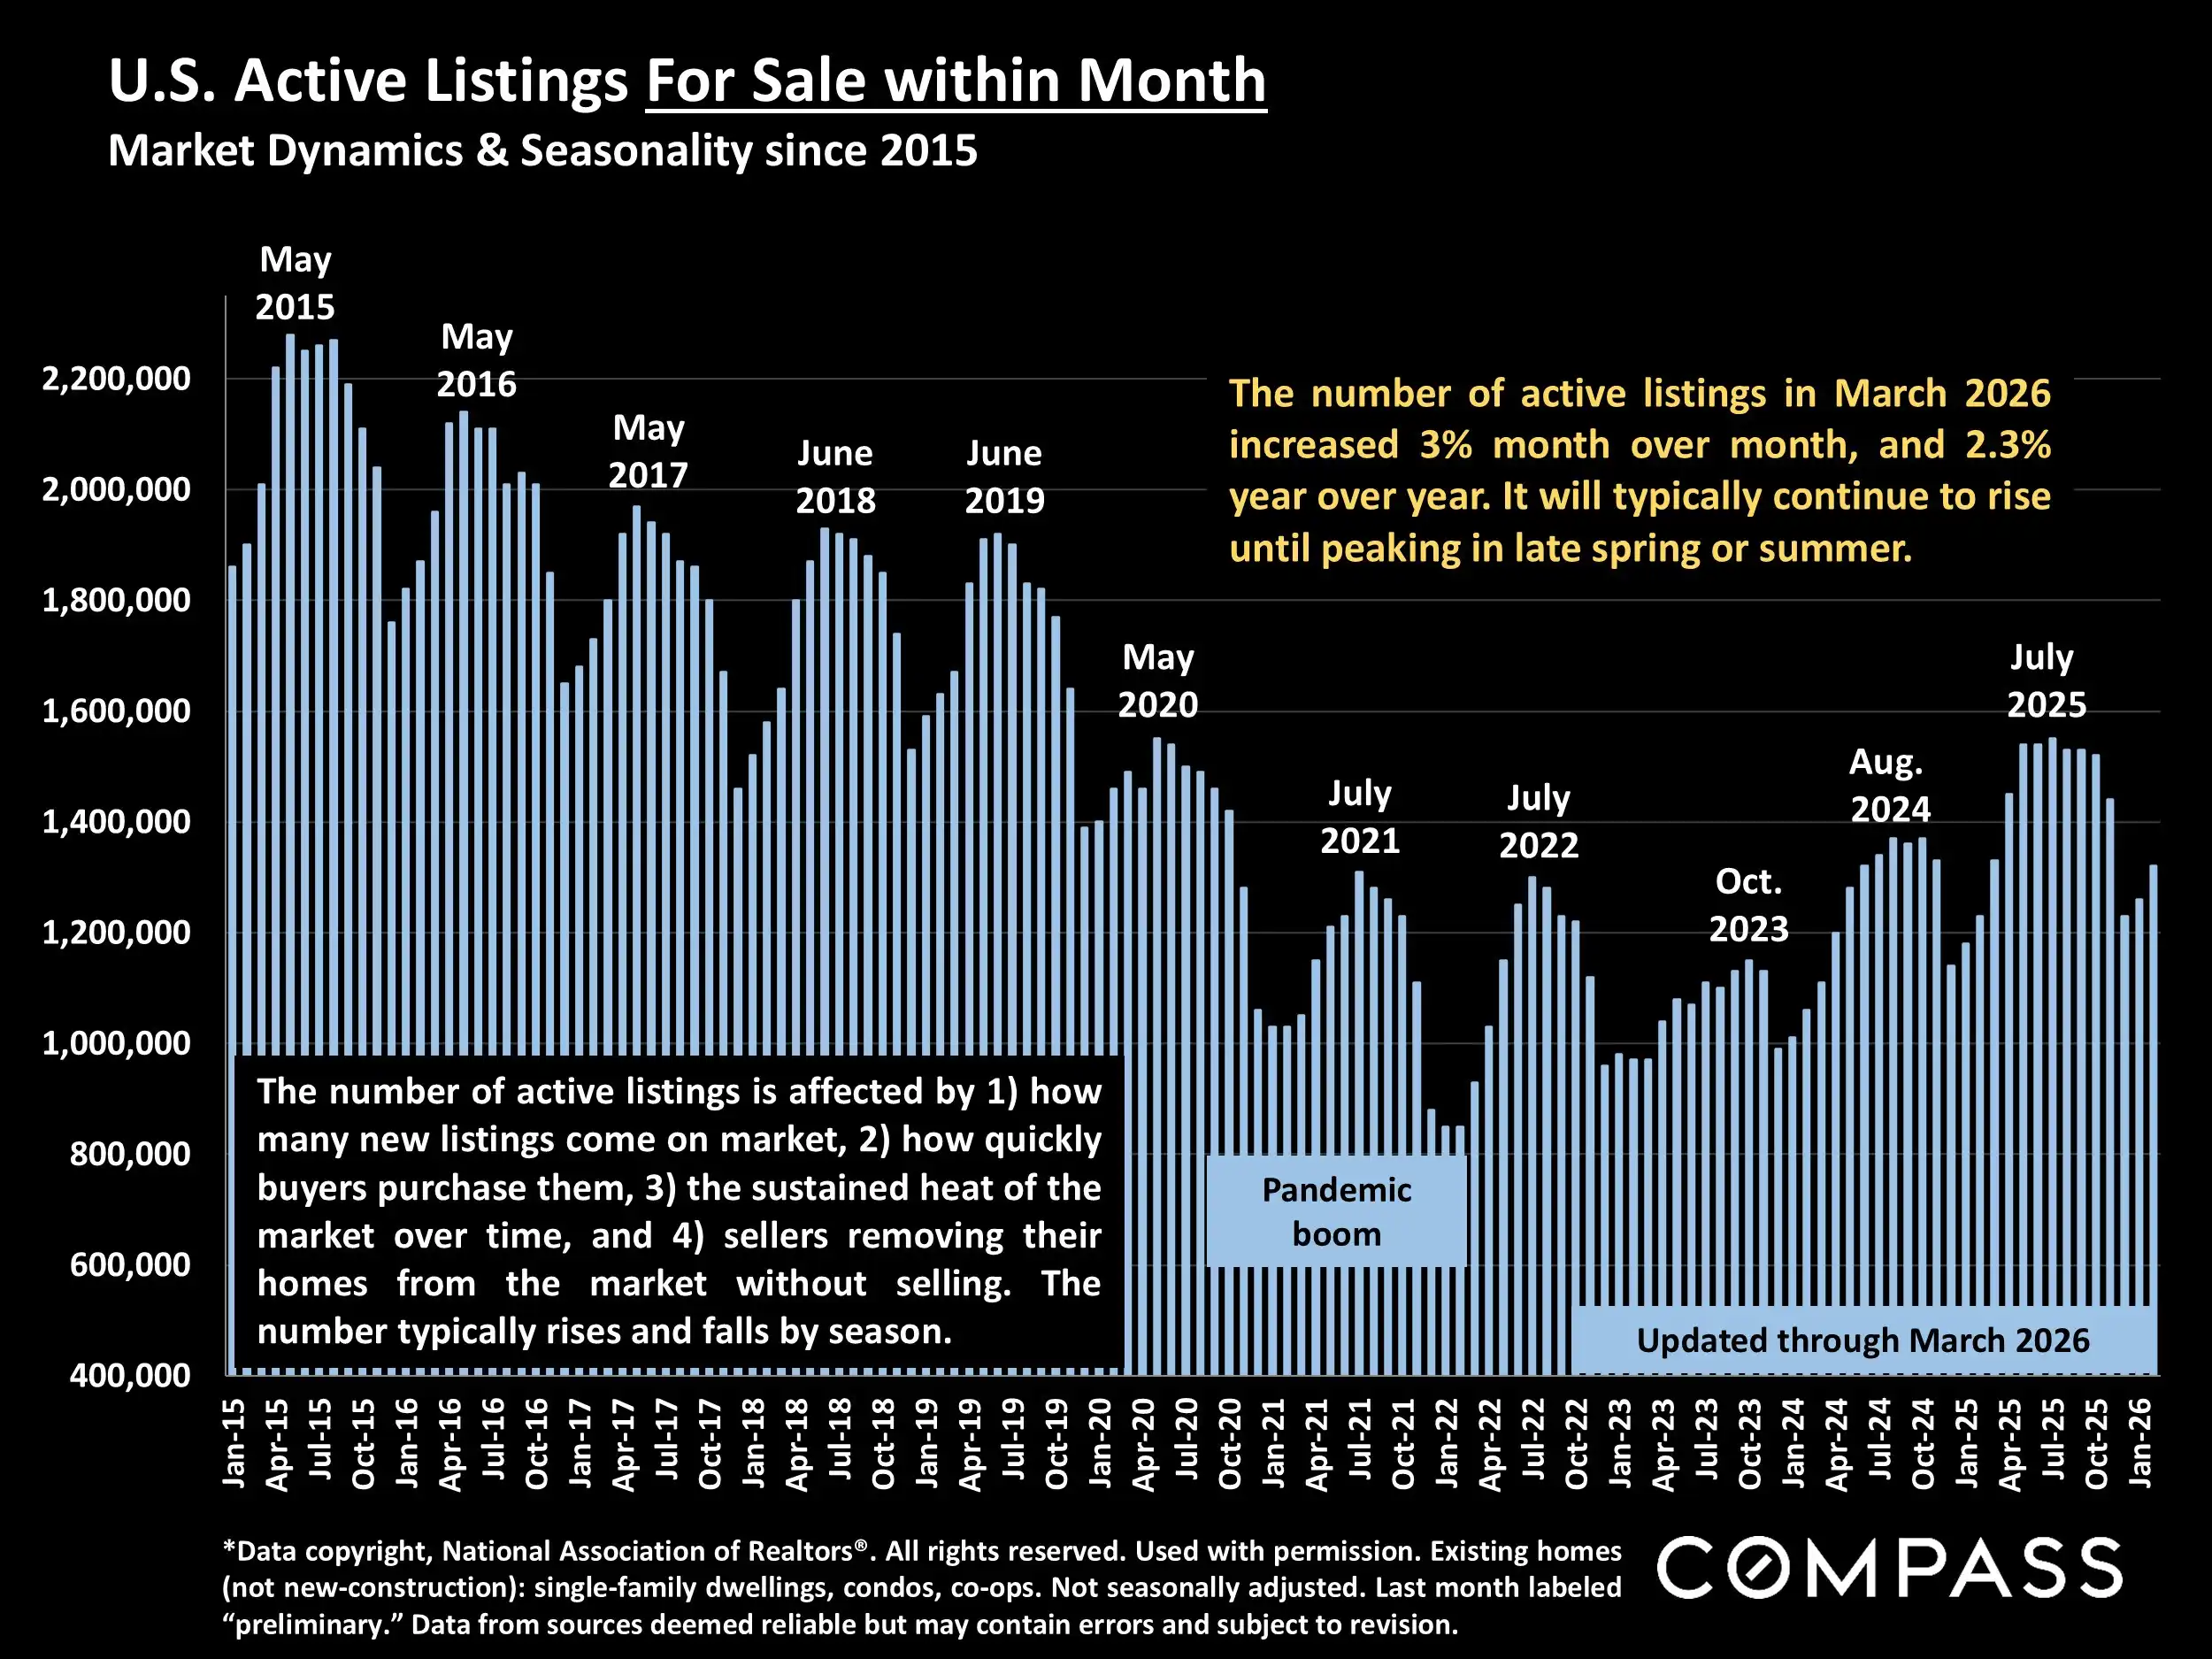
Inventory: Active listings increased 3.4% from the prior year, giving buyers more choices.
New Listings: New listing activity rebounded sharply from the typical December low.
Buyer Demand: Demand remained measured, with stronger activity expected as the spring market approaches.
Market Pace: Median time on market rose to 46 days, giving buyers more time to evaluate options.
2026 Outlook: Improving inventory and lower rates could support a stronger spring market if confidence holds.
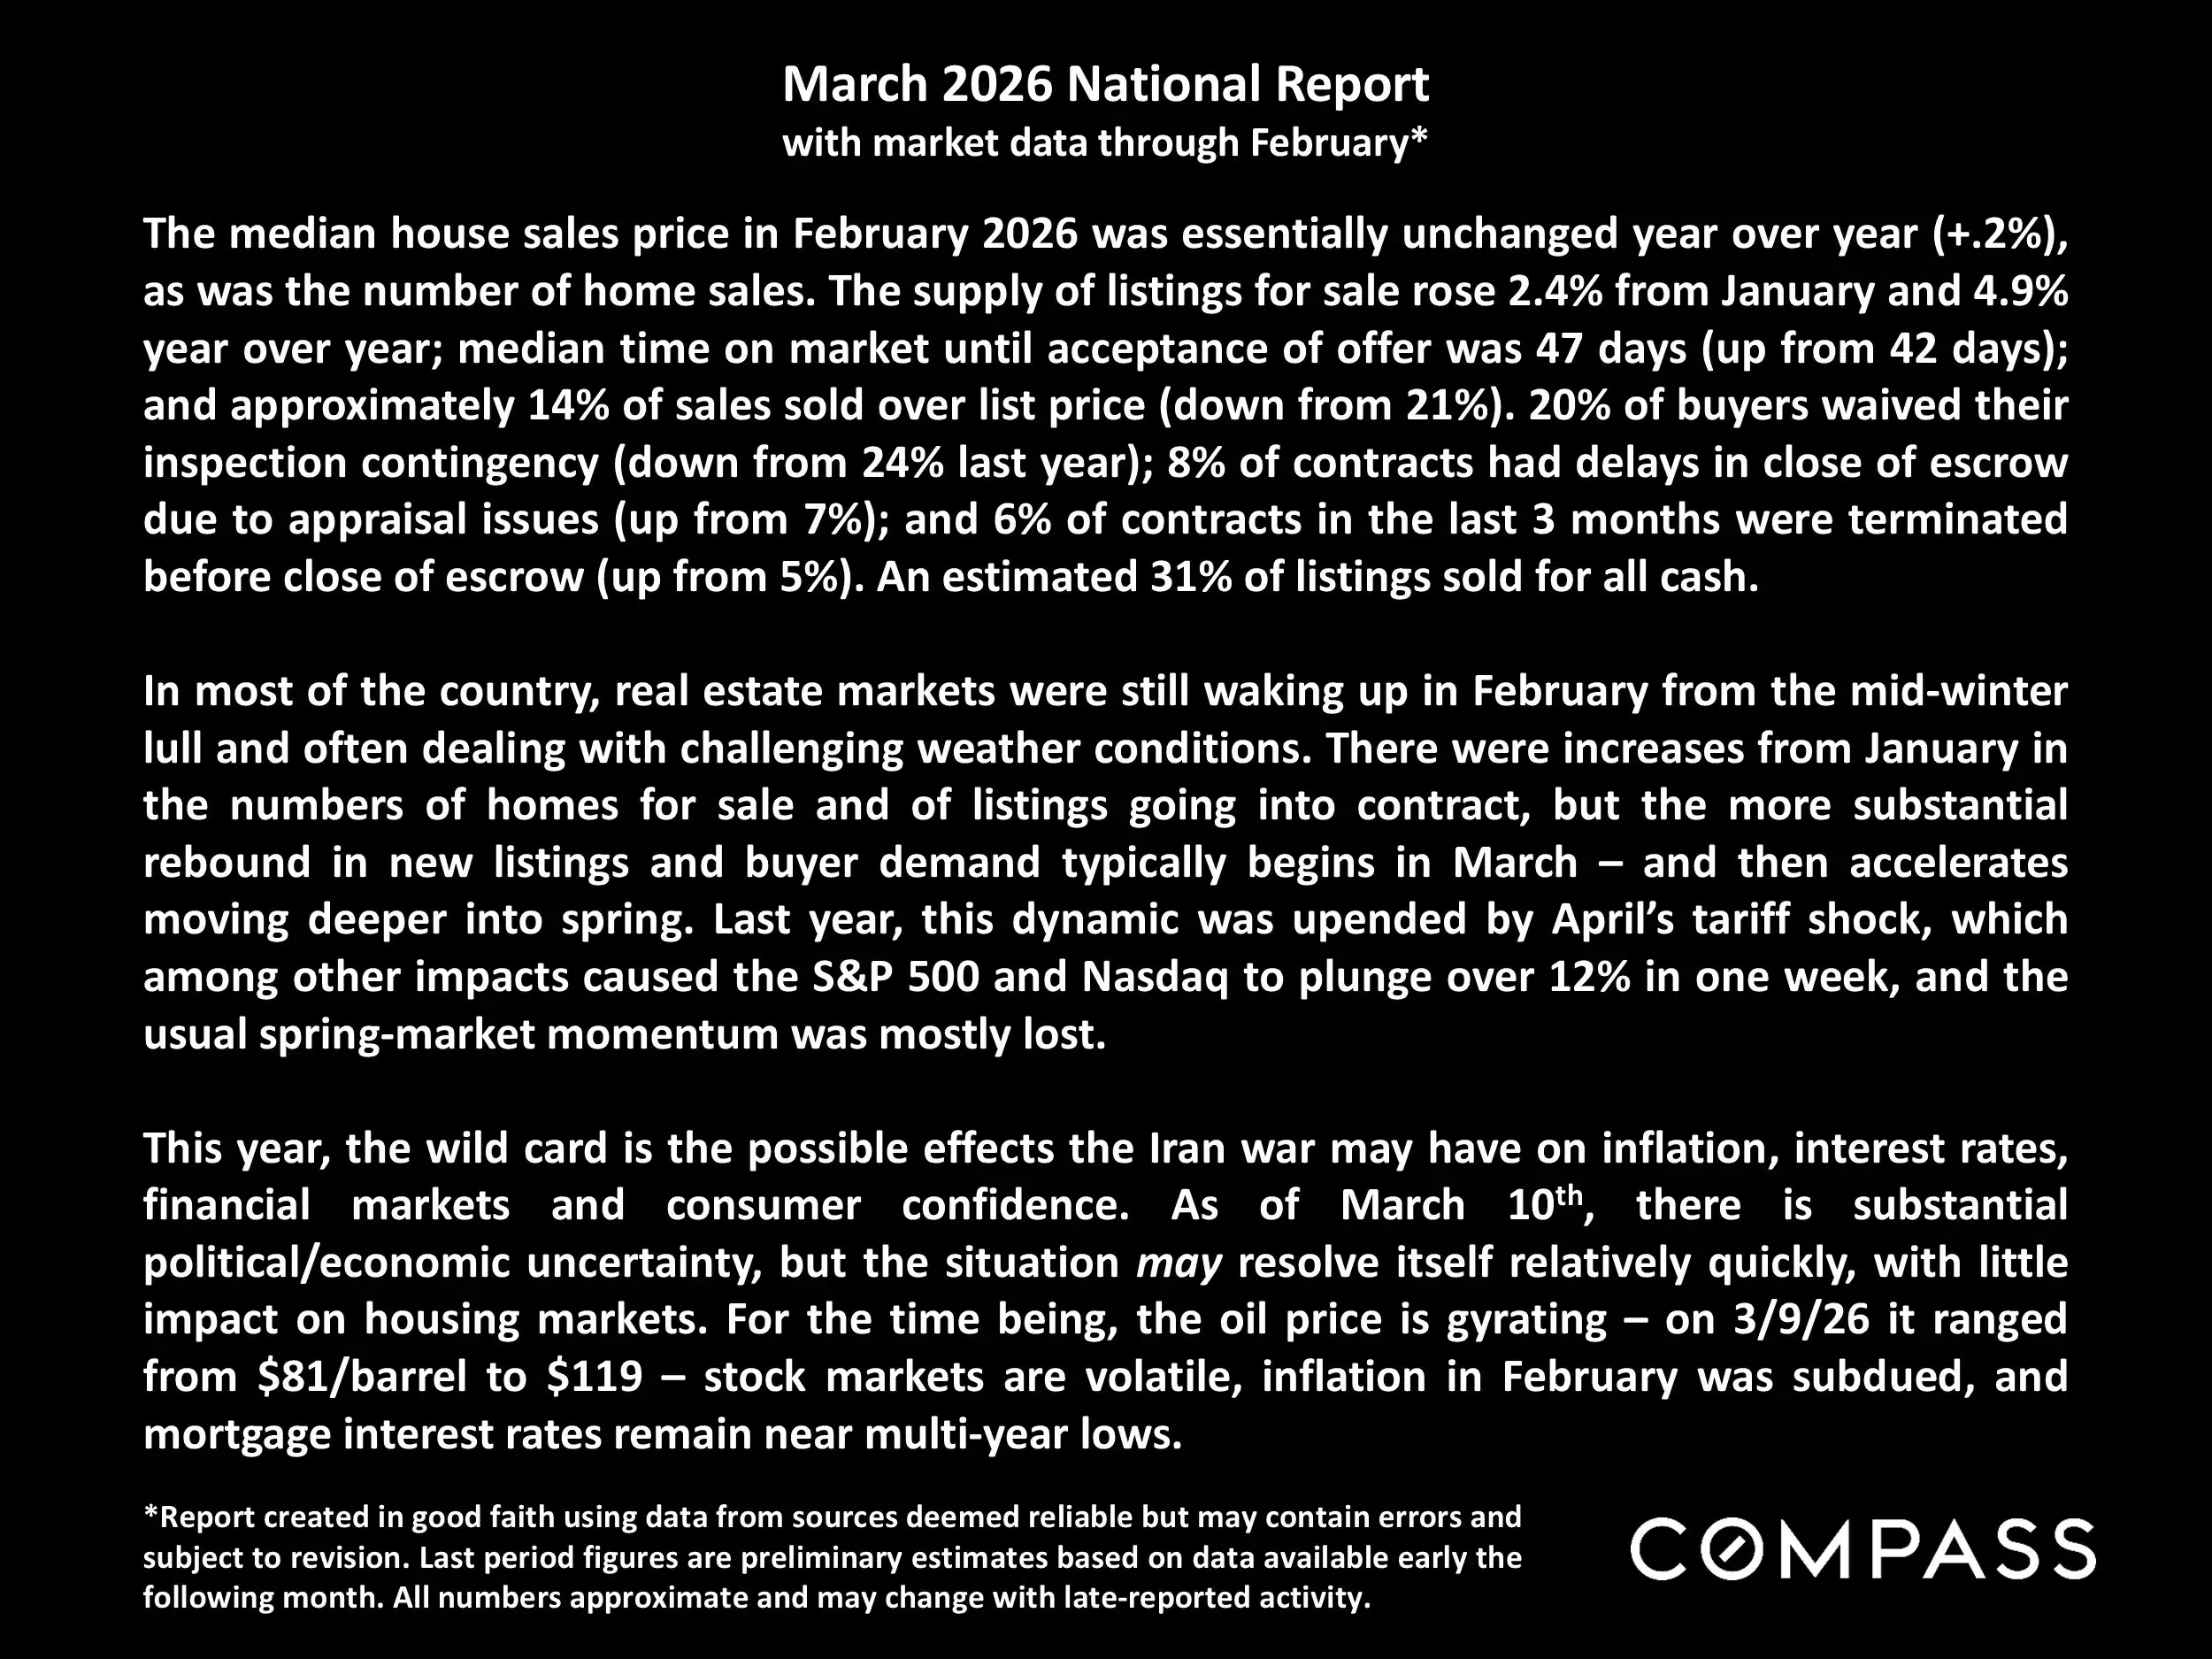
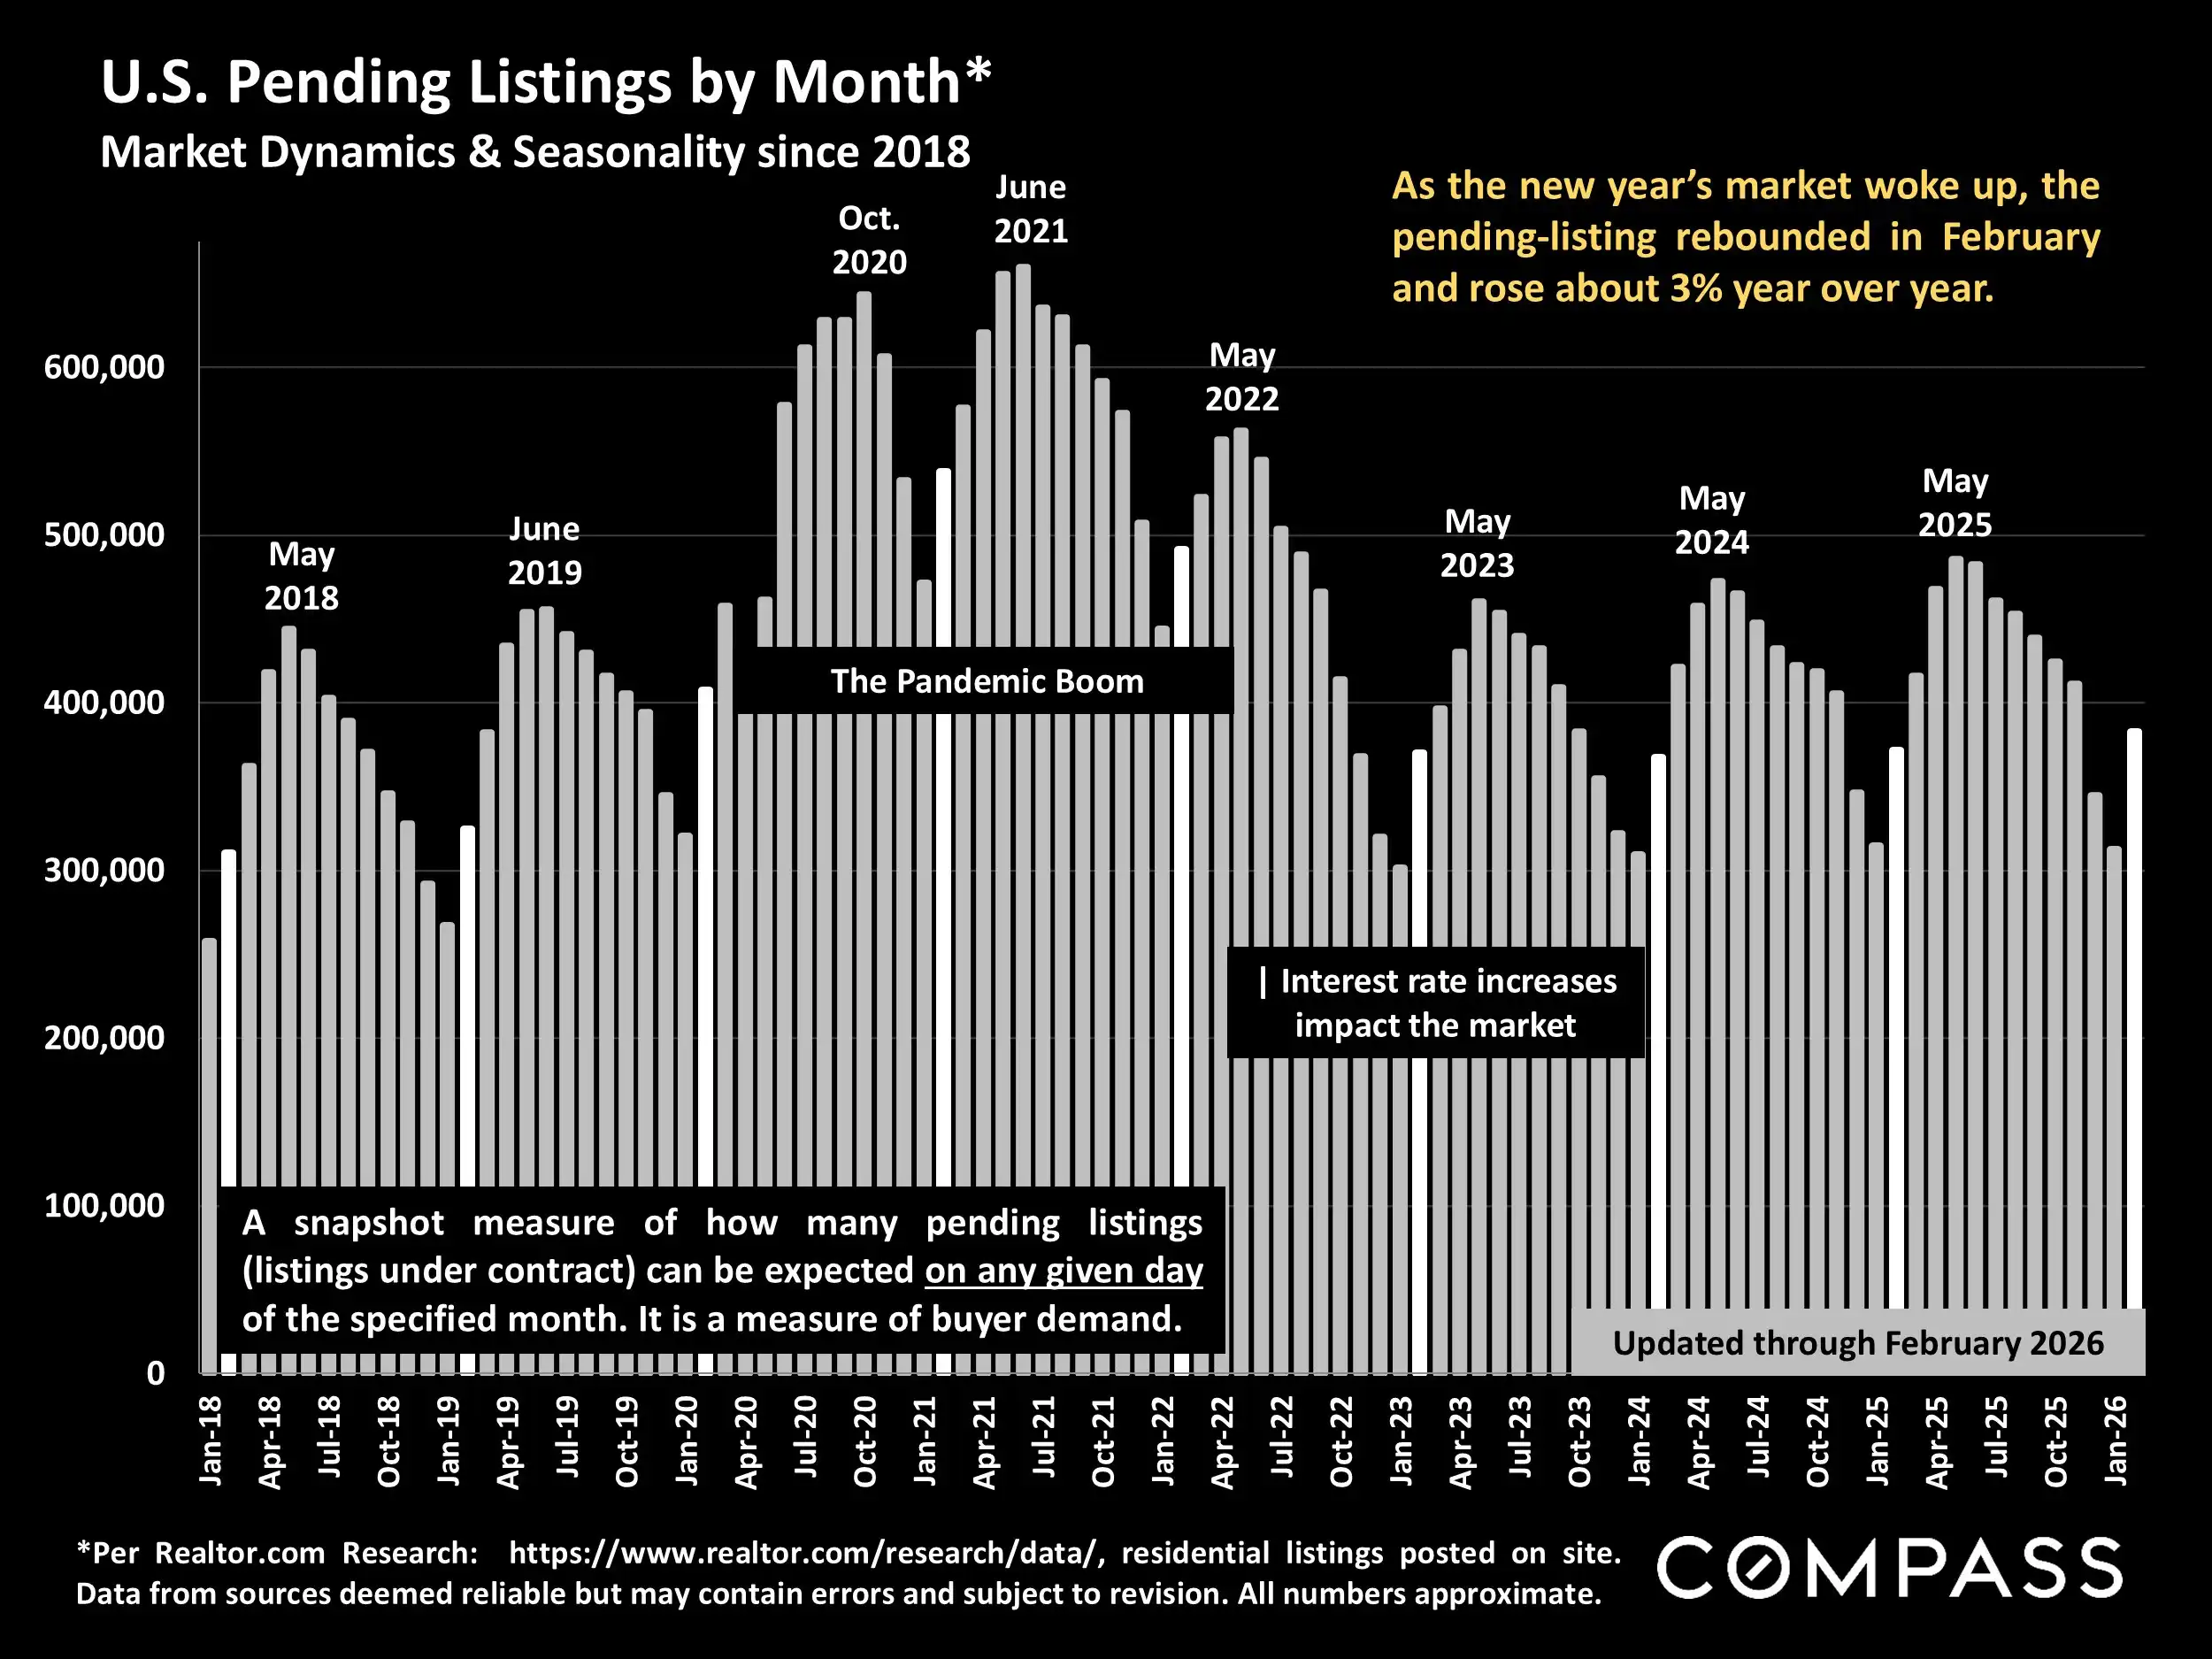
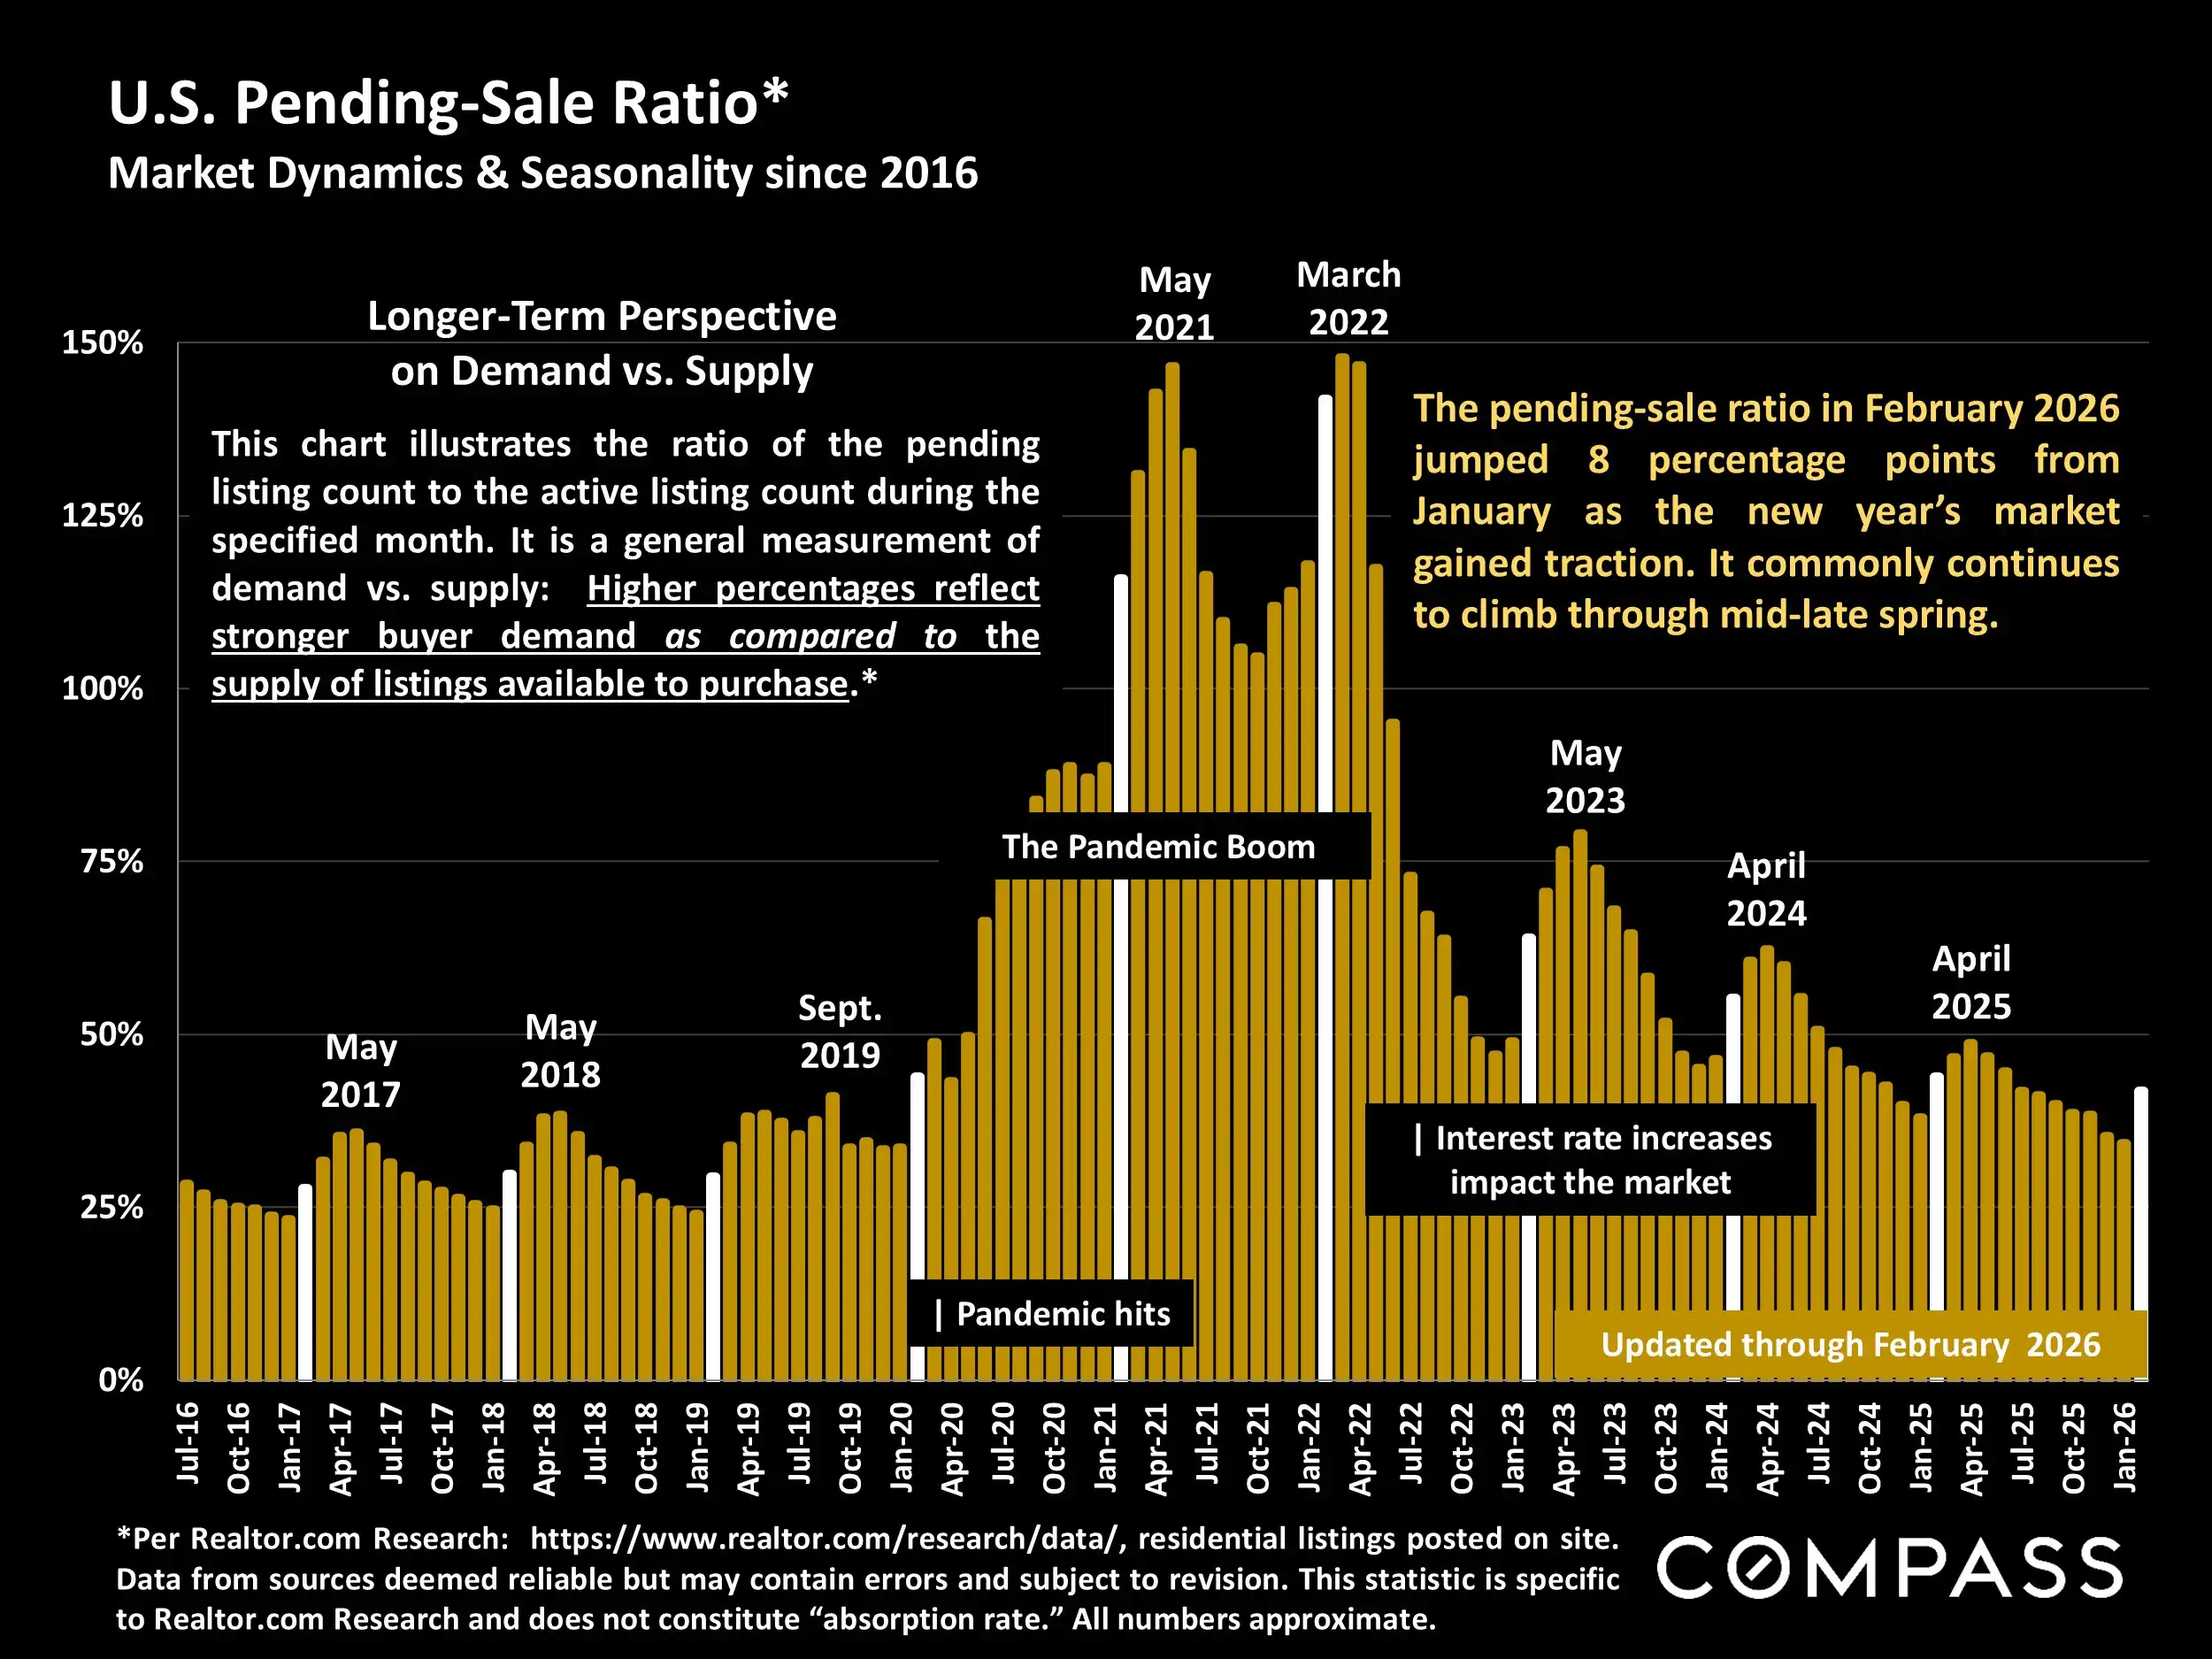
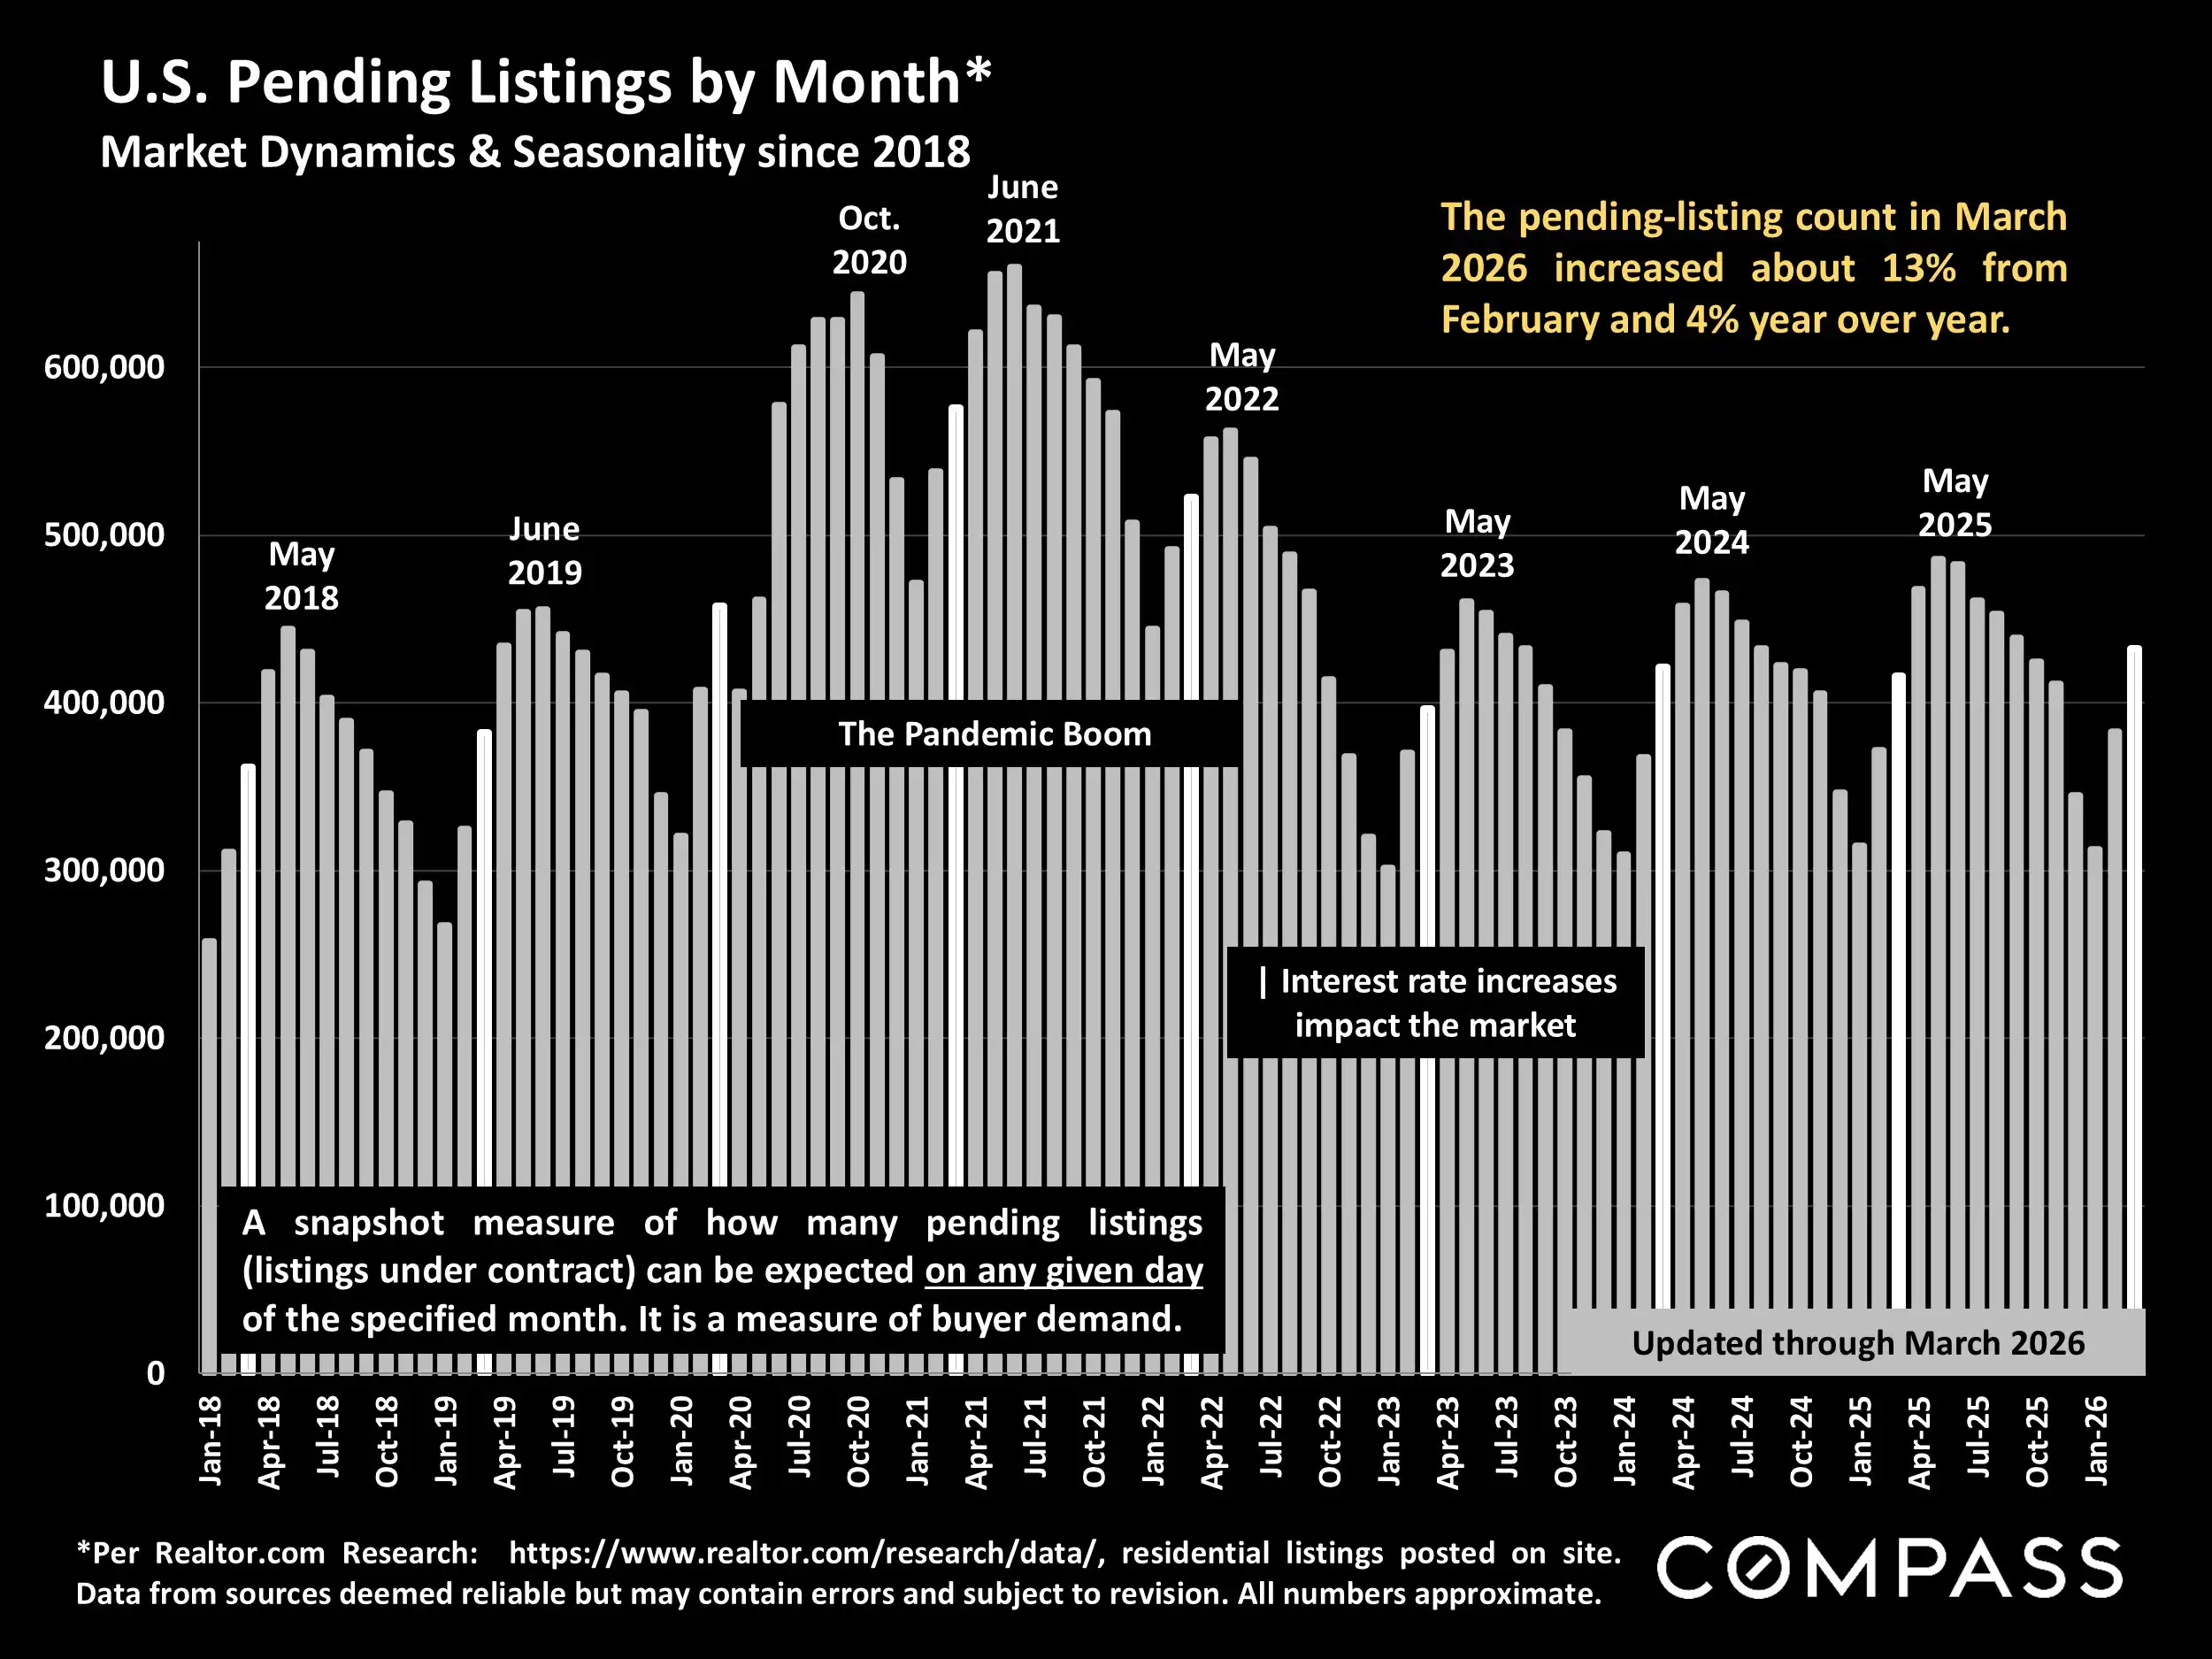
The March 2026 Compass National Real Estate Insights report reflects a housing market that is gradually waking from winter but still moving at a measured pace. February sales activity improved from January, new listings continued to rise, and pending activity increased modestly year over year, suggesting that buyer demand is present, but still selective.
National home prices remained resilient, with the median single-family home sales price essentially unchanged year over year. Inventory also continued to improve, giving buyers more options than they had during the tighter post-pandemic market, though supply remains below historical norms in many areas.
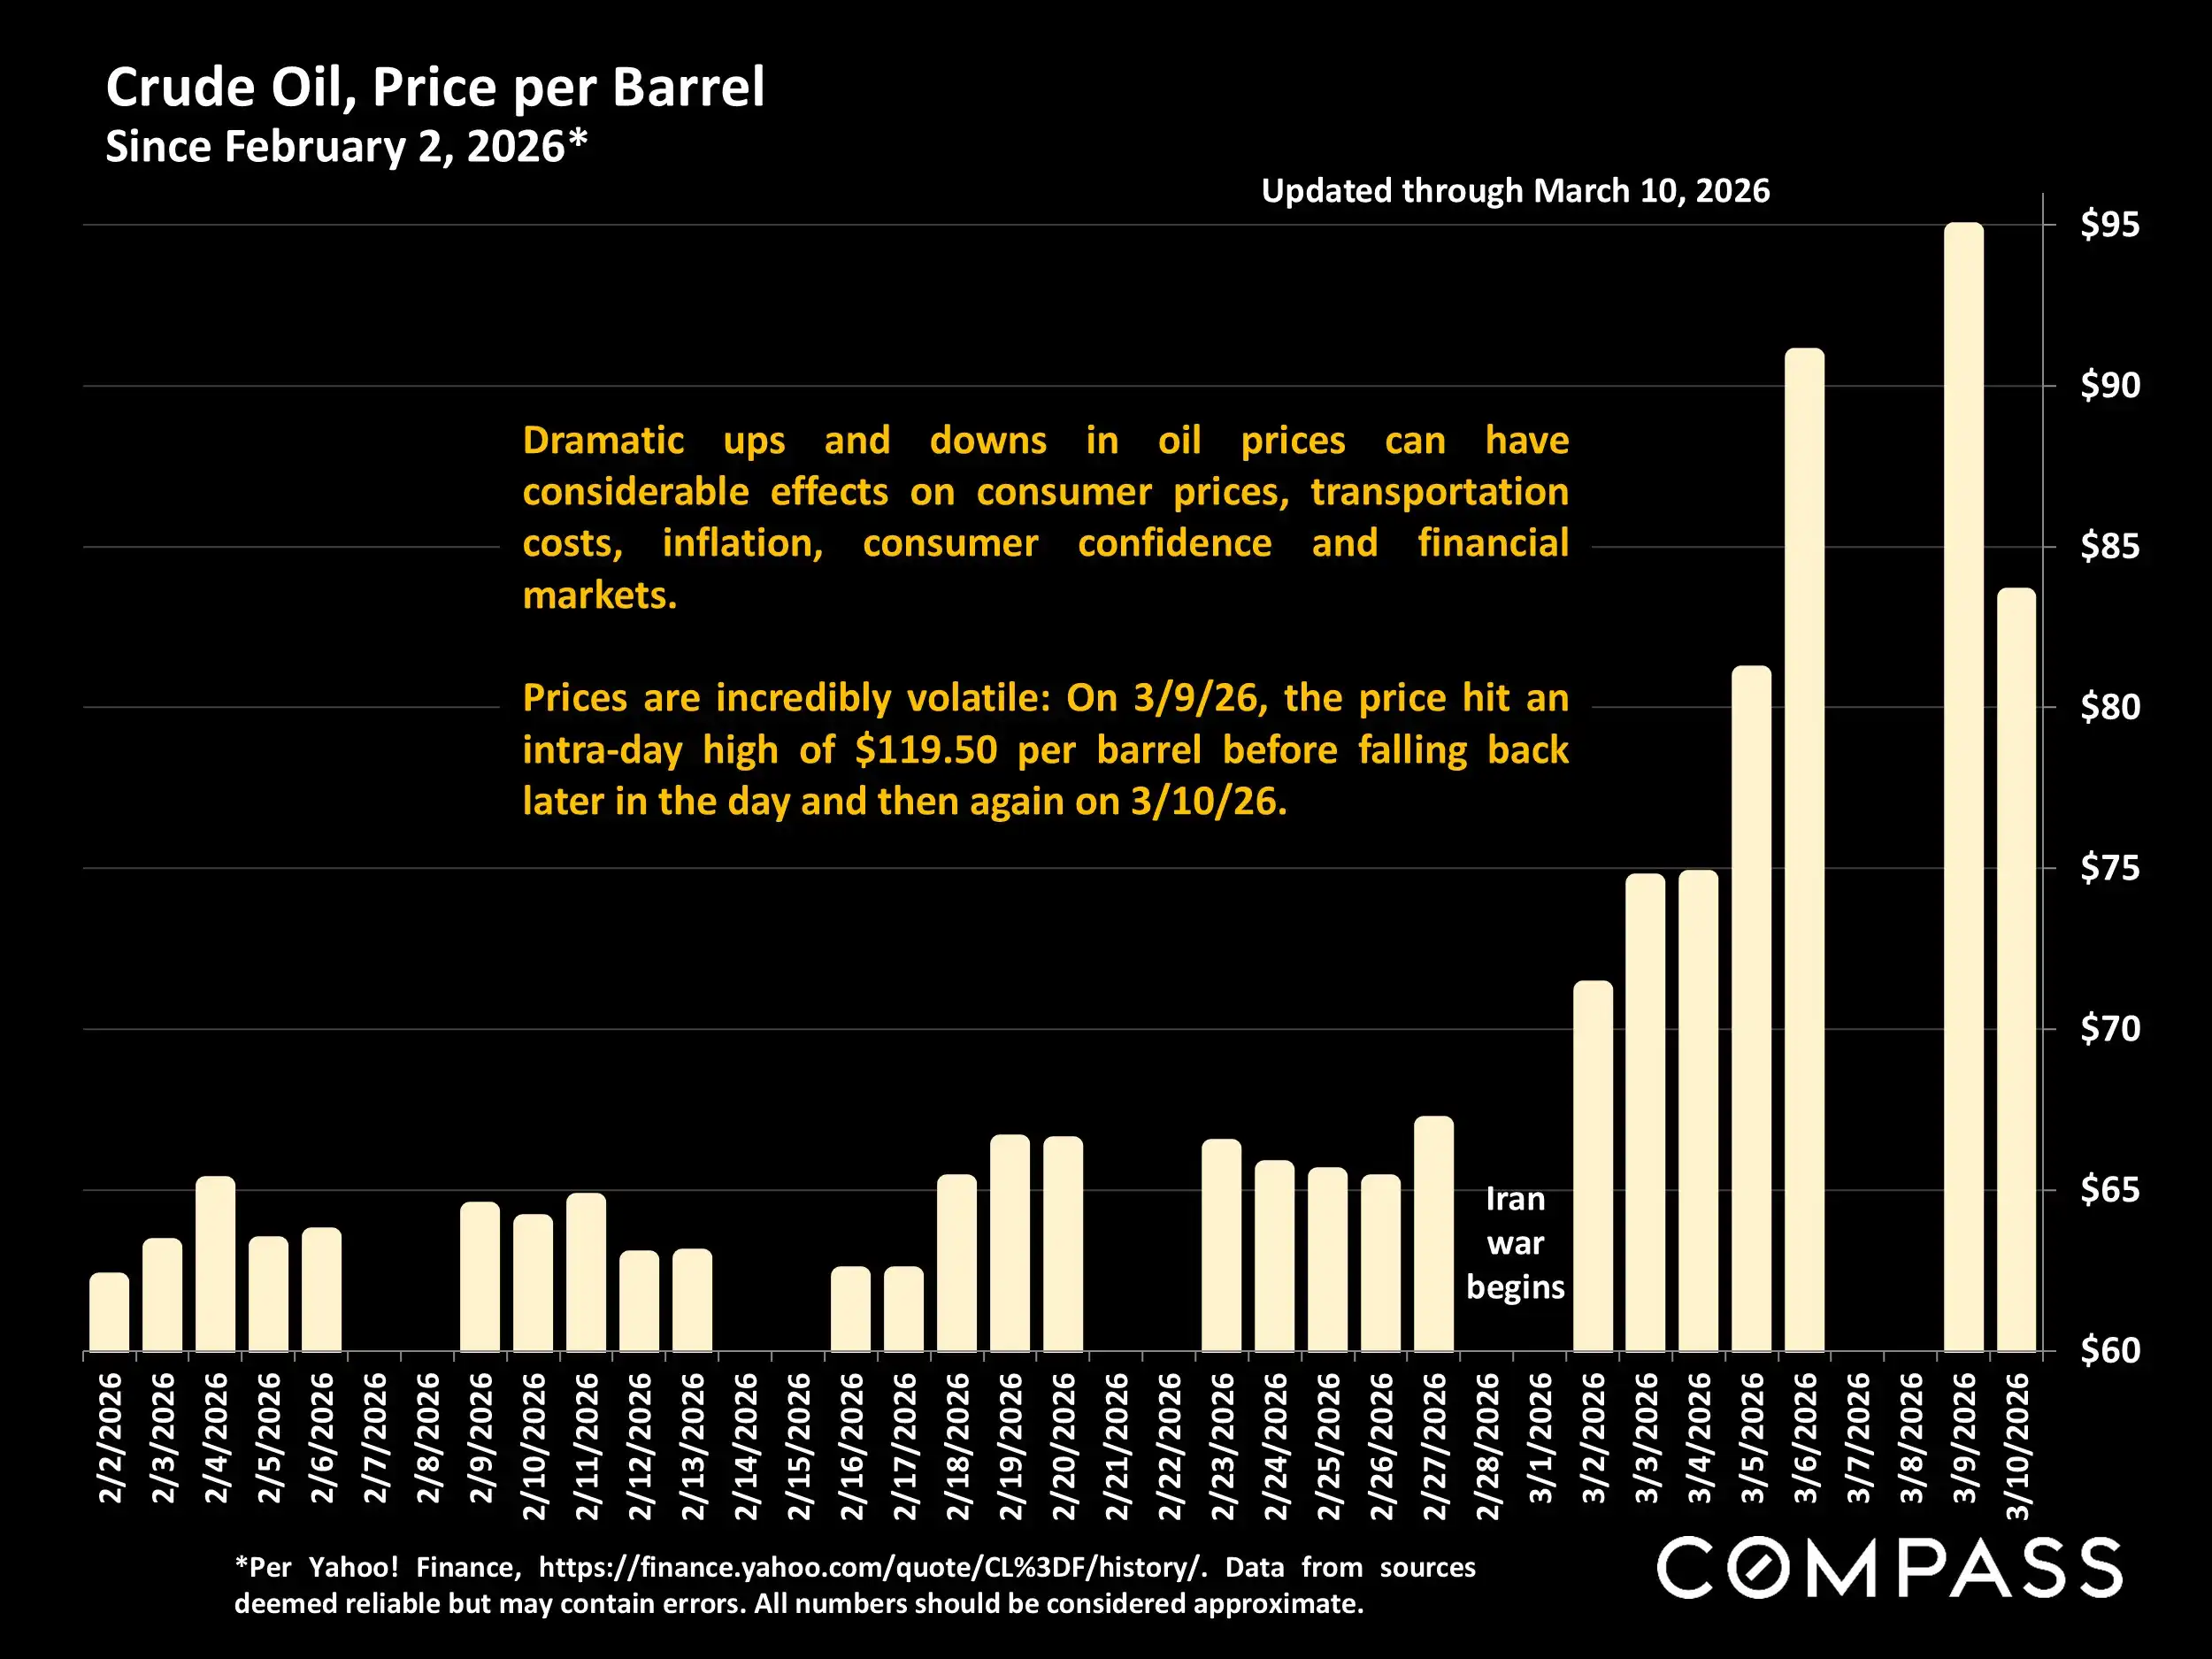
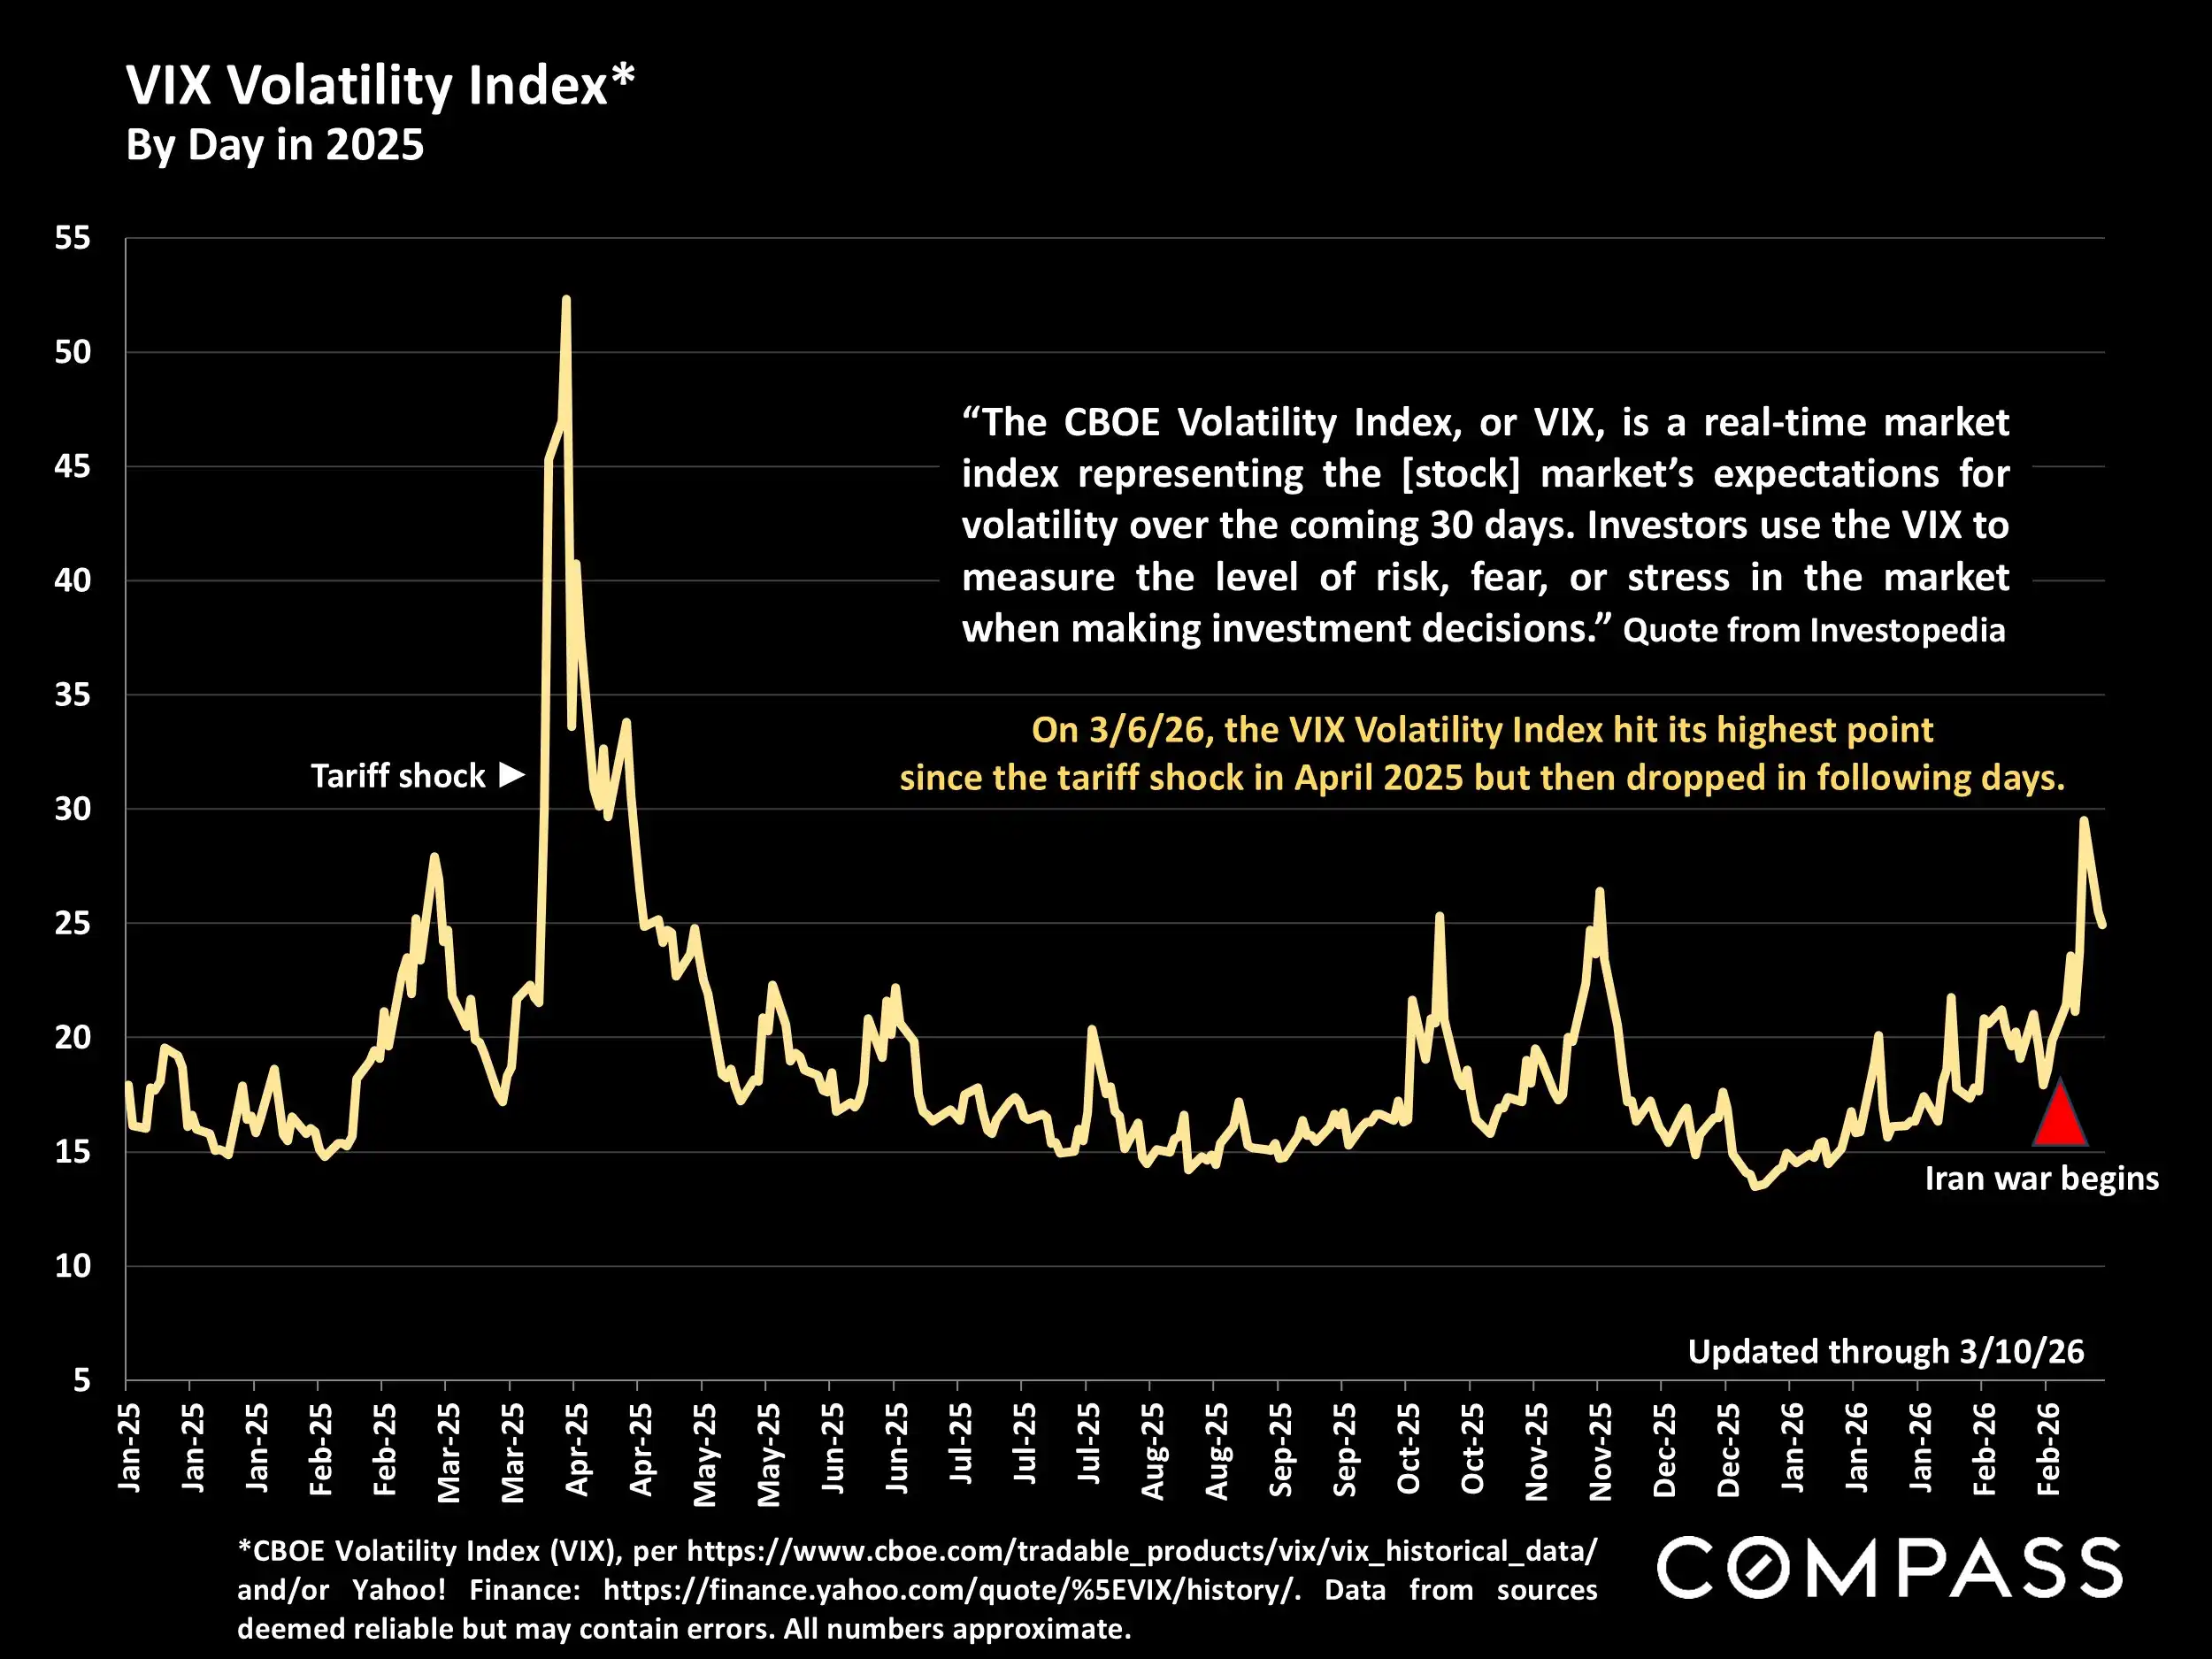
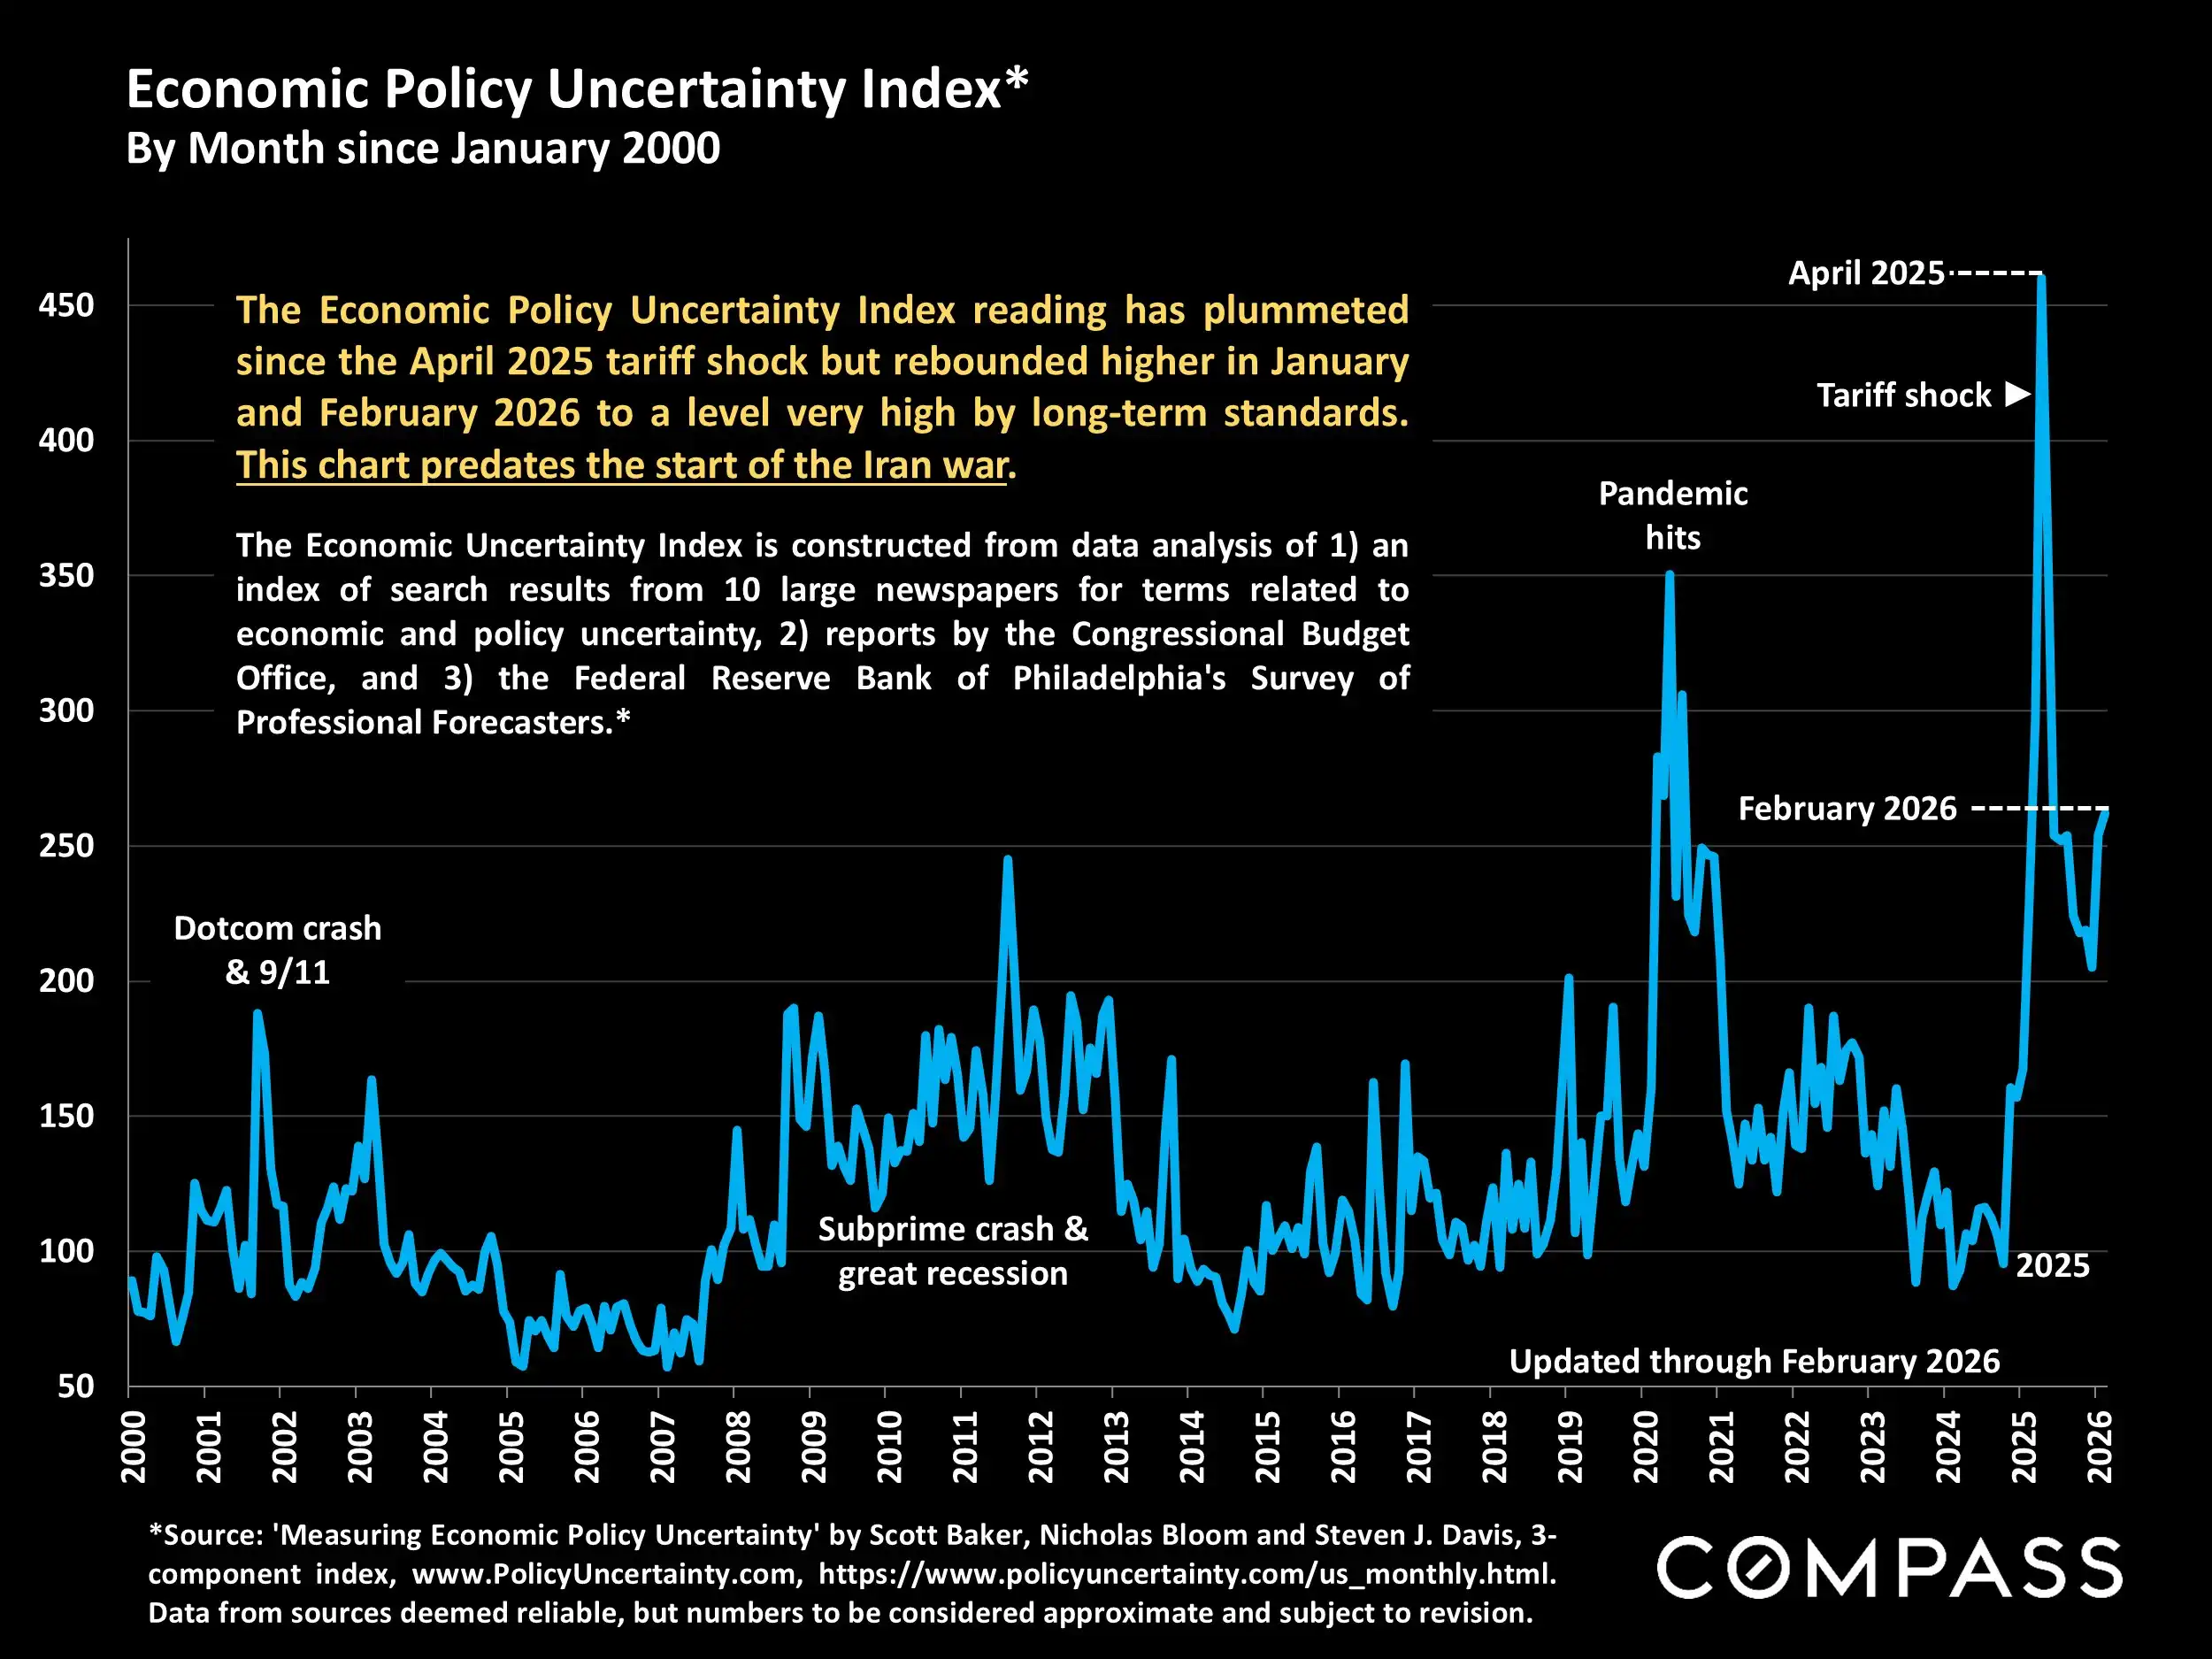
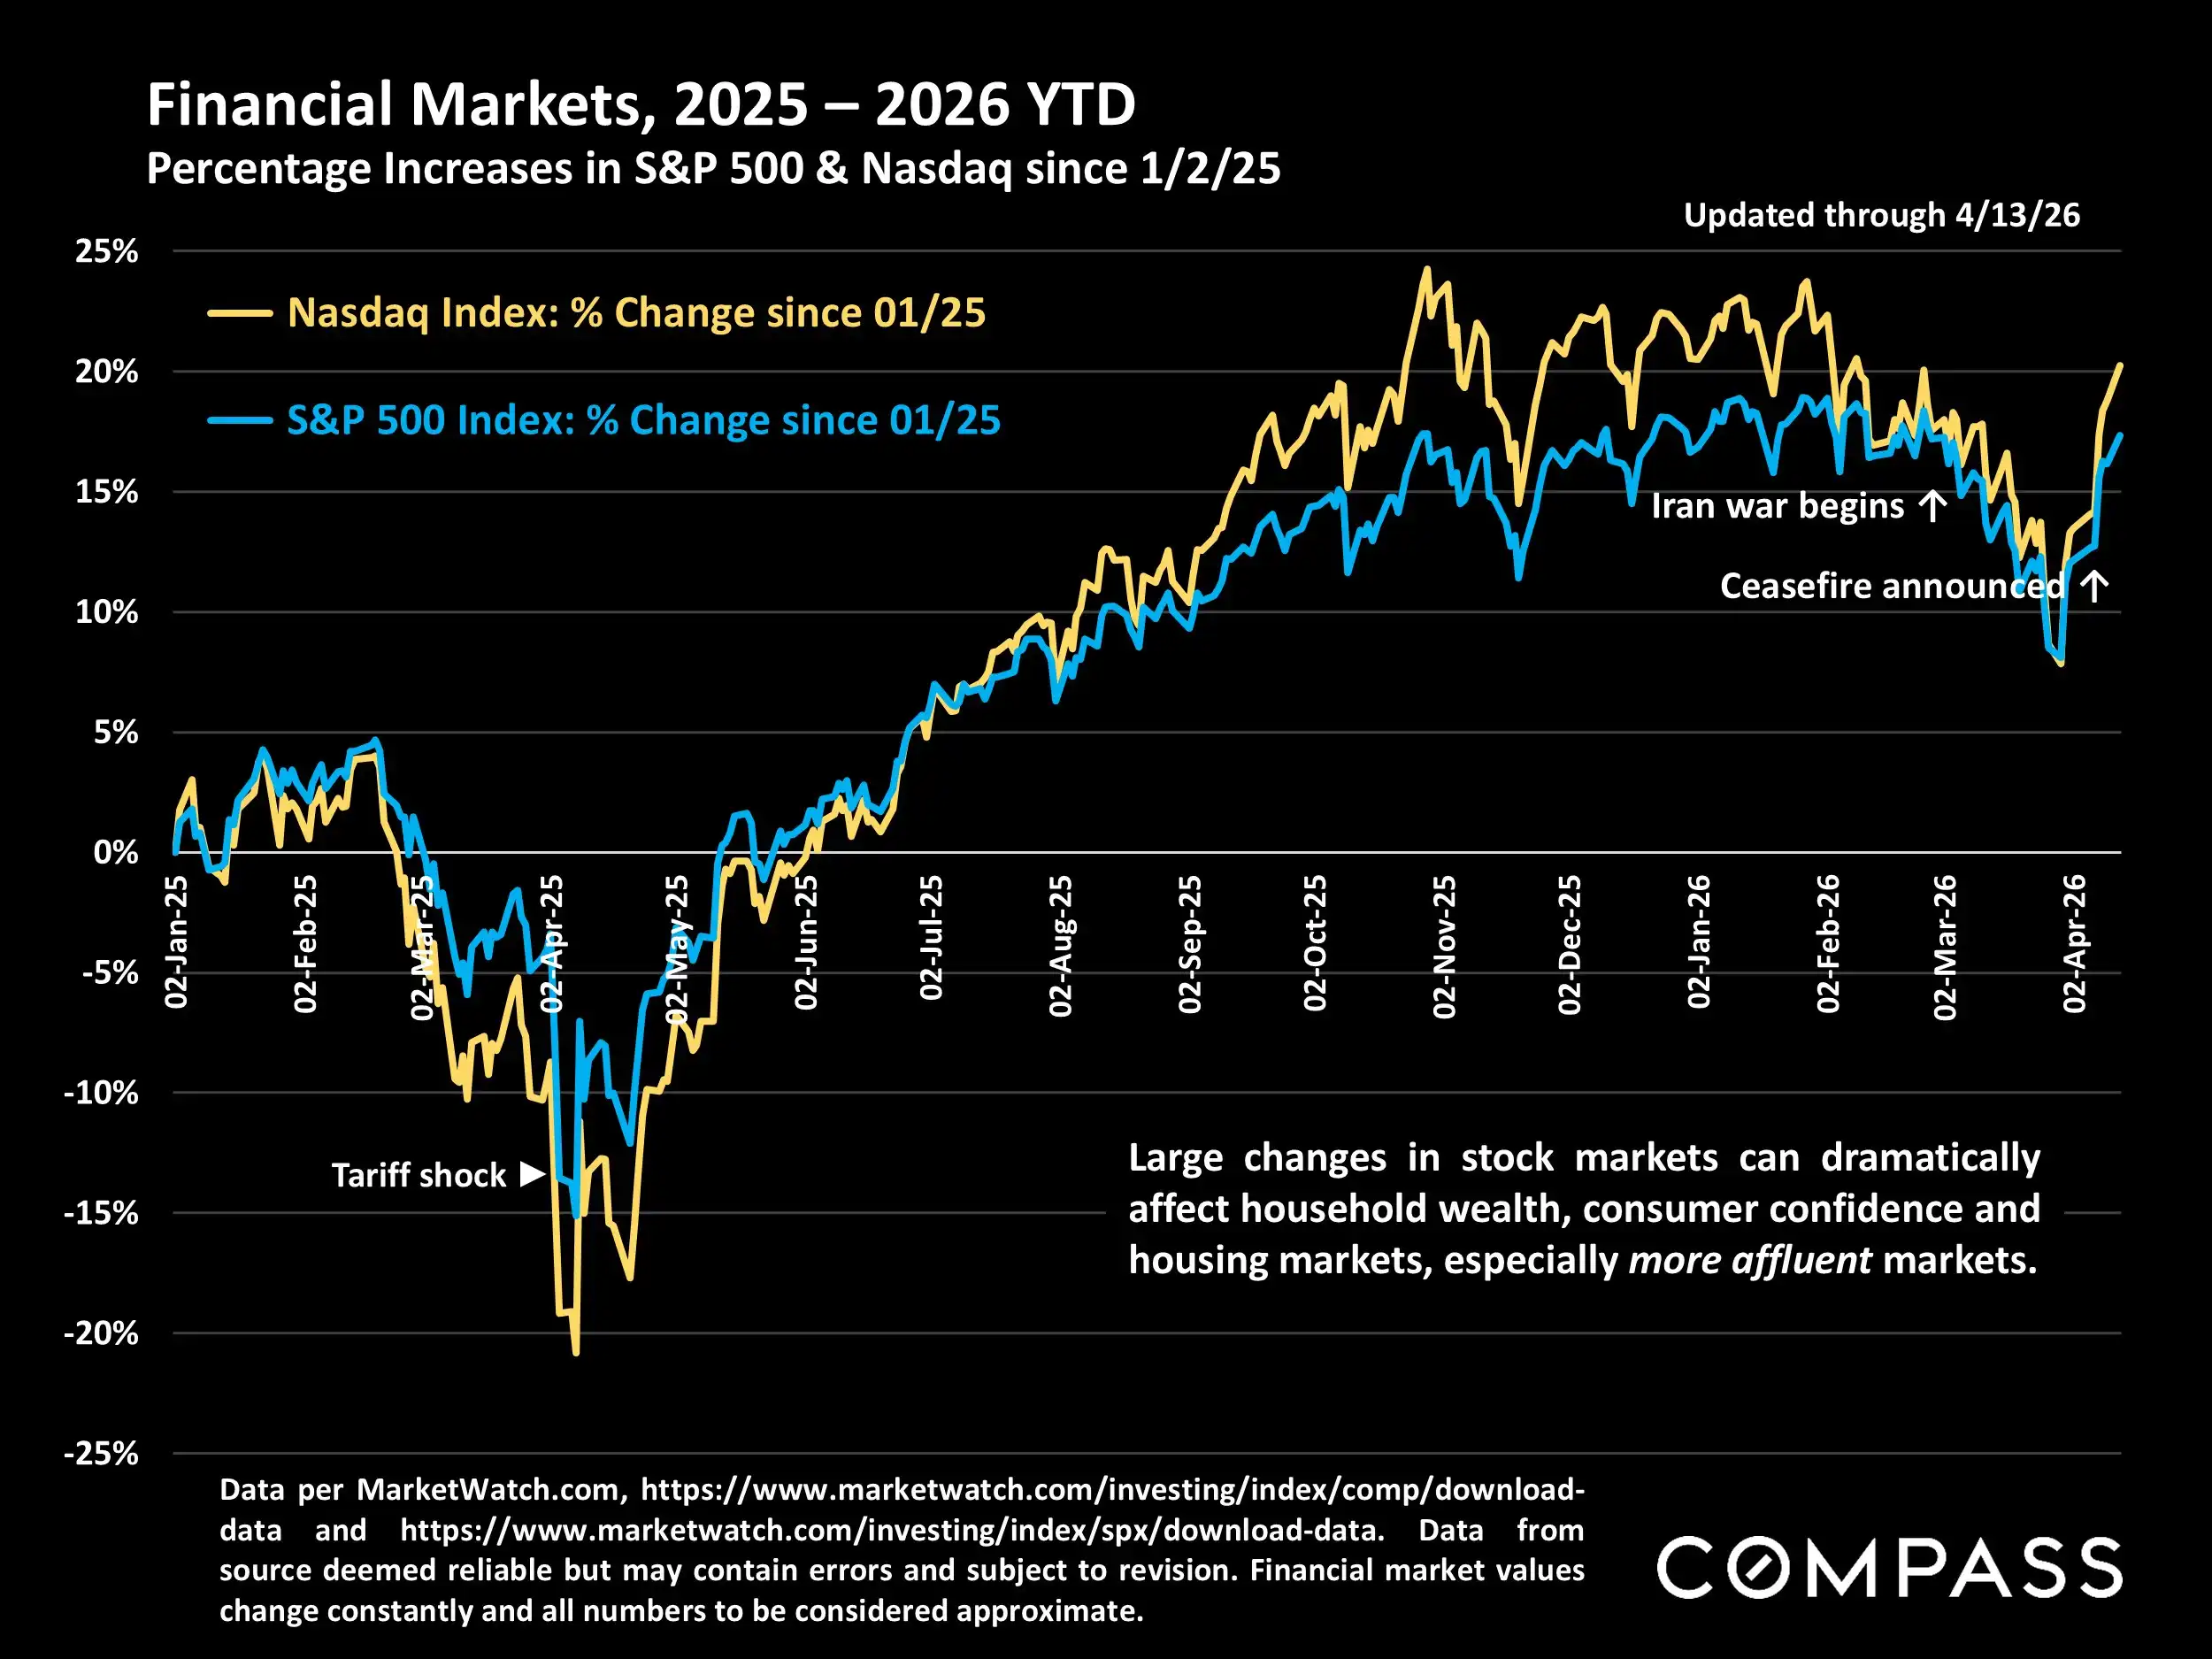
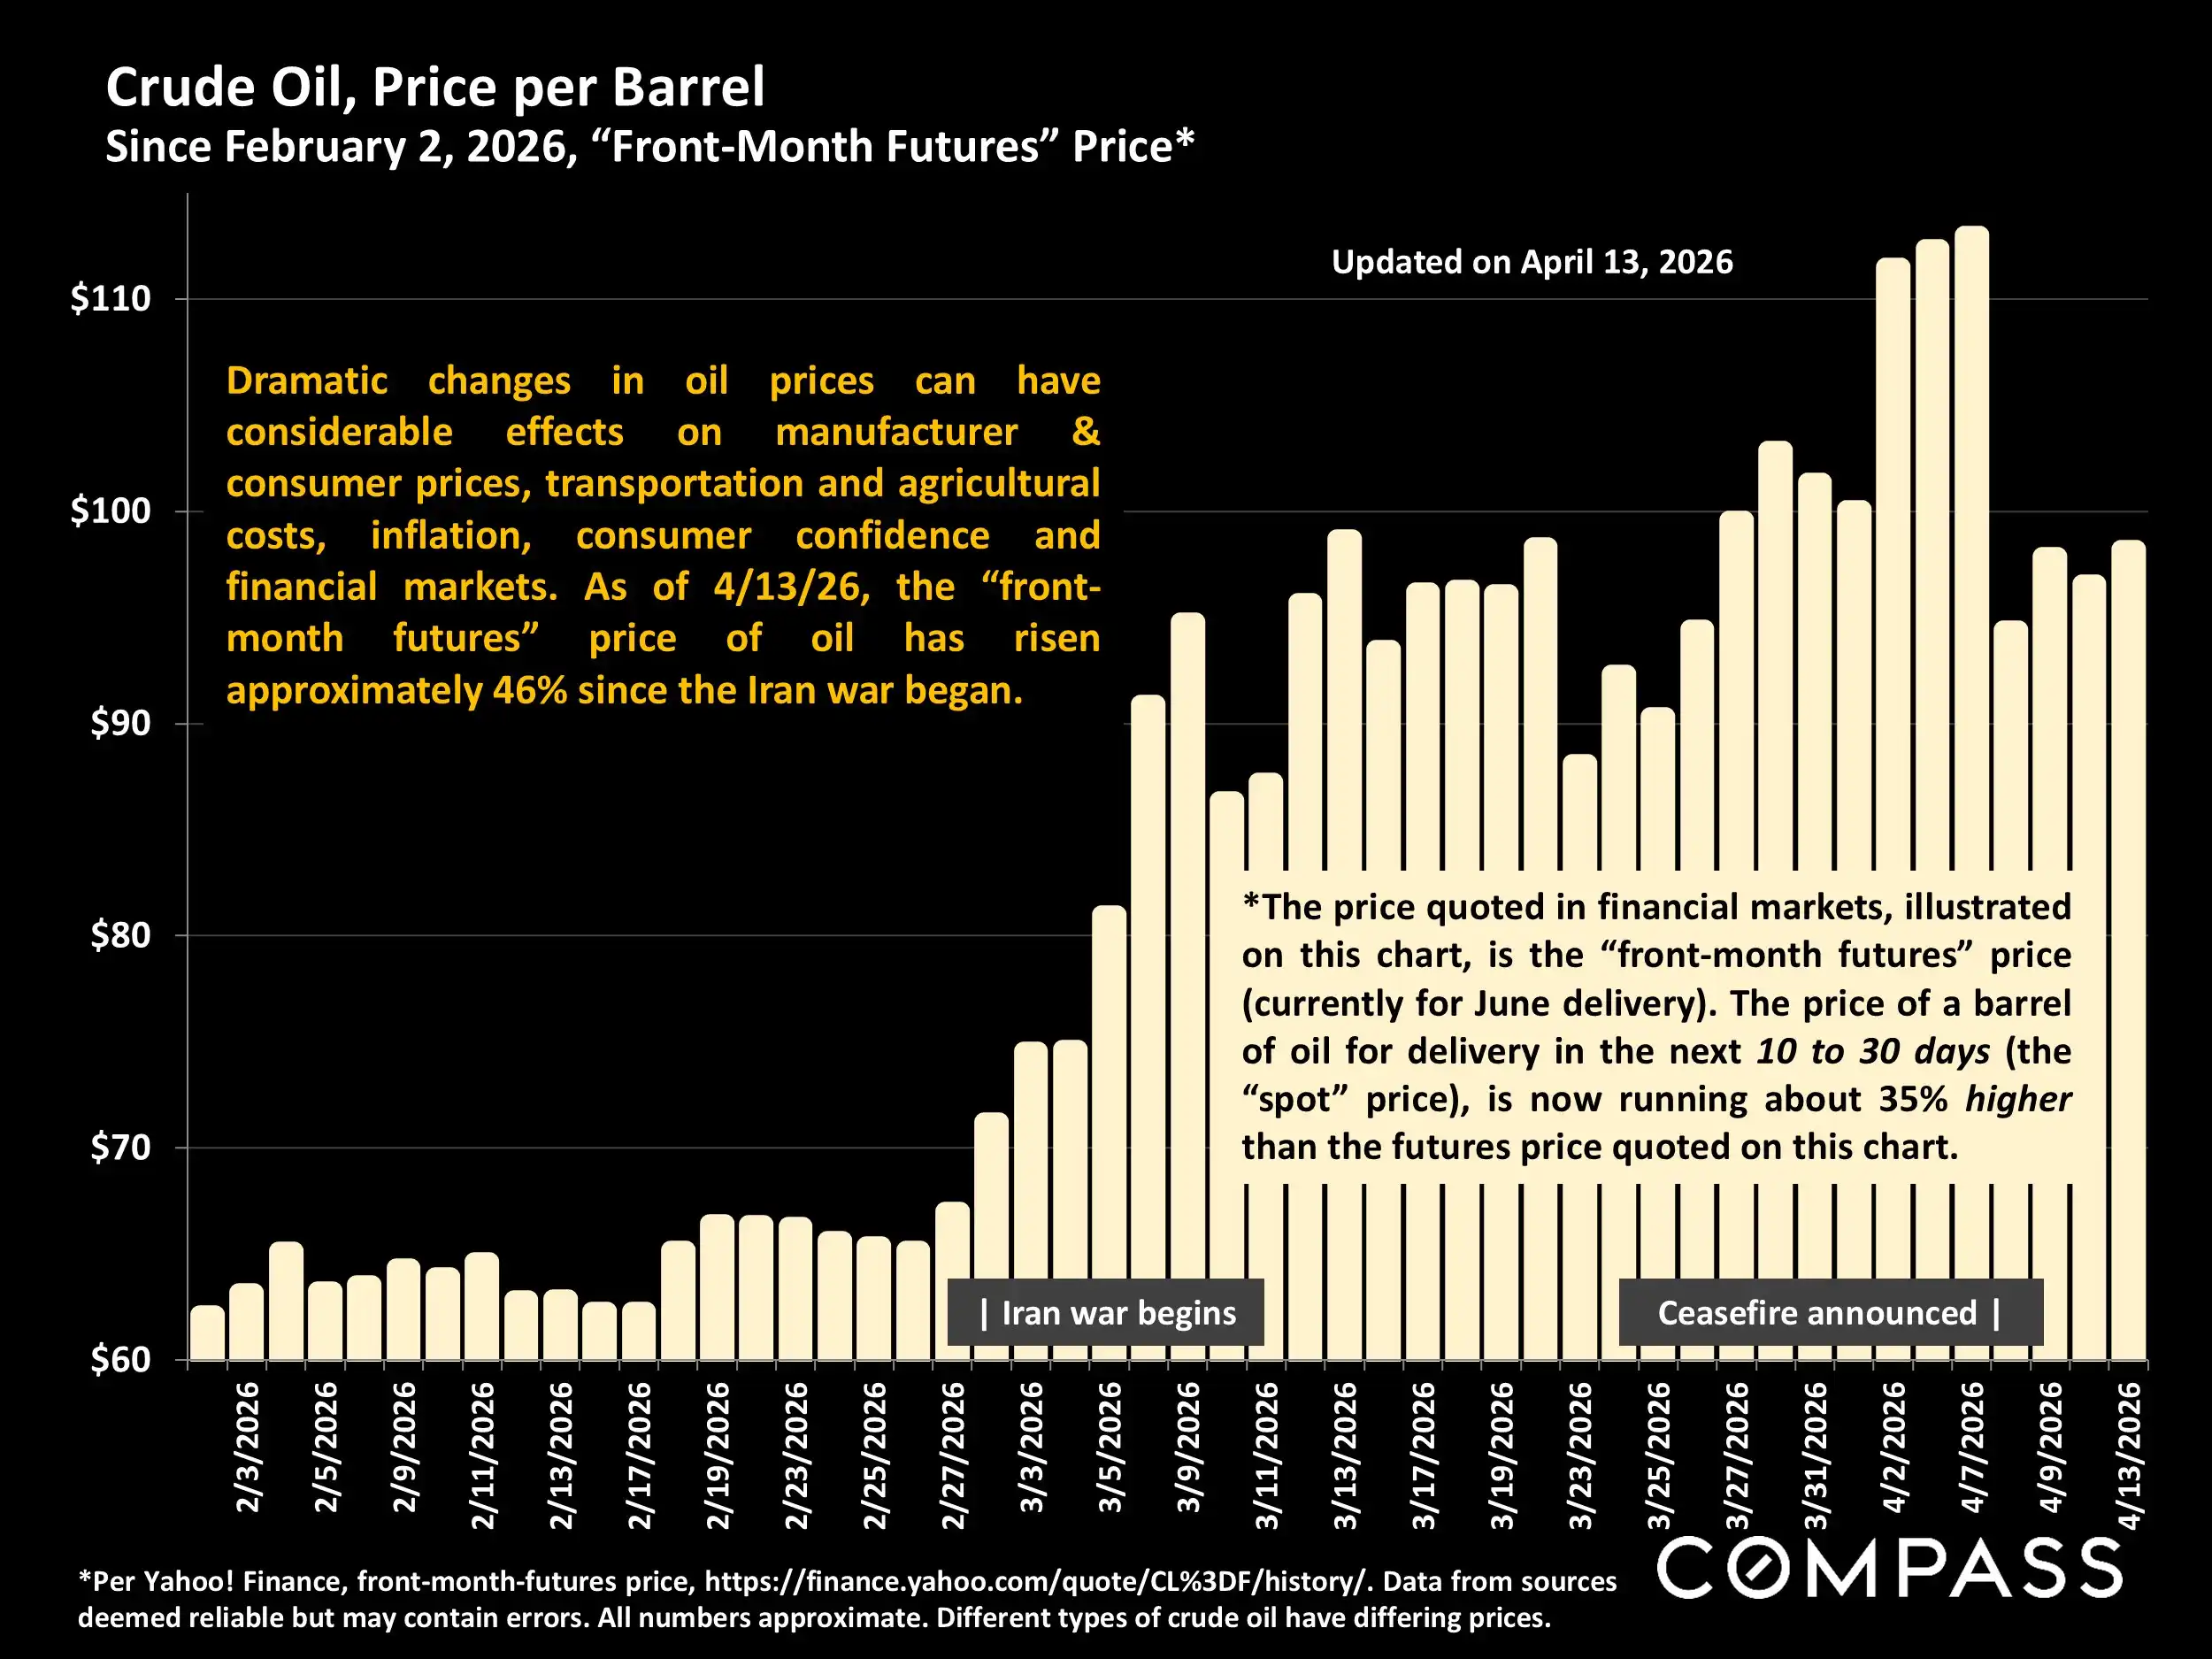
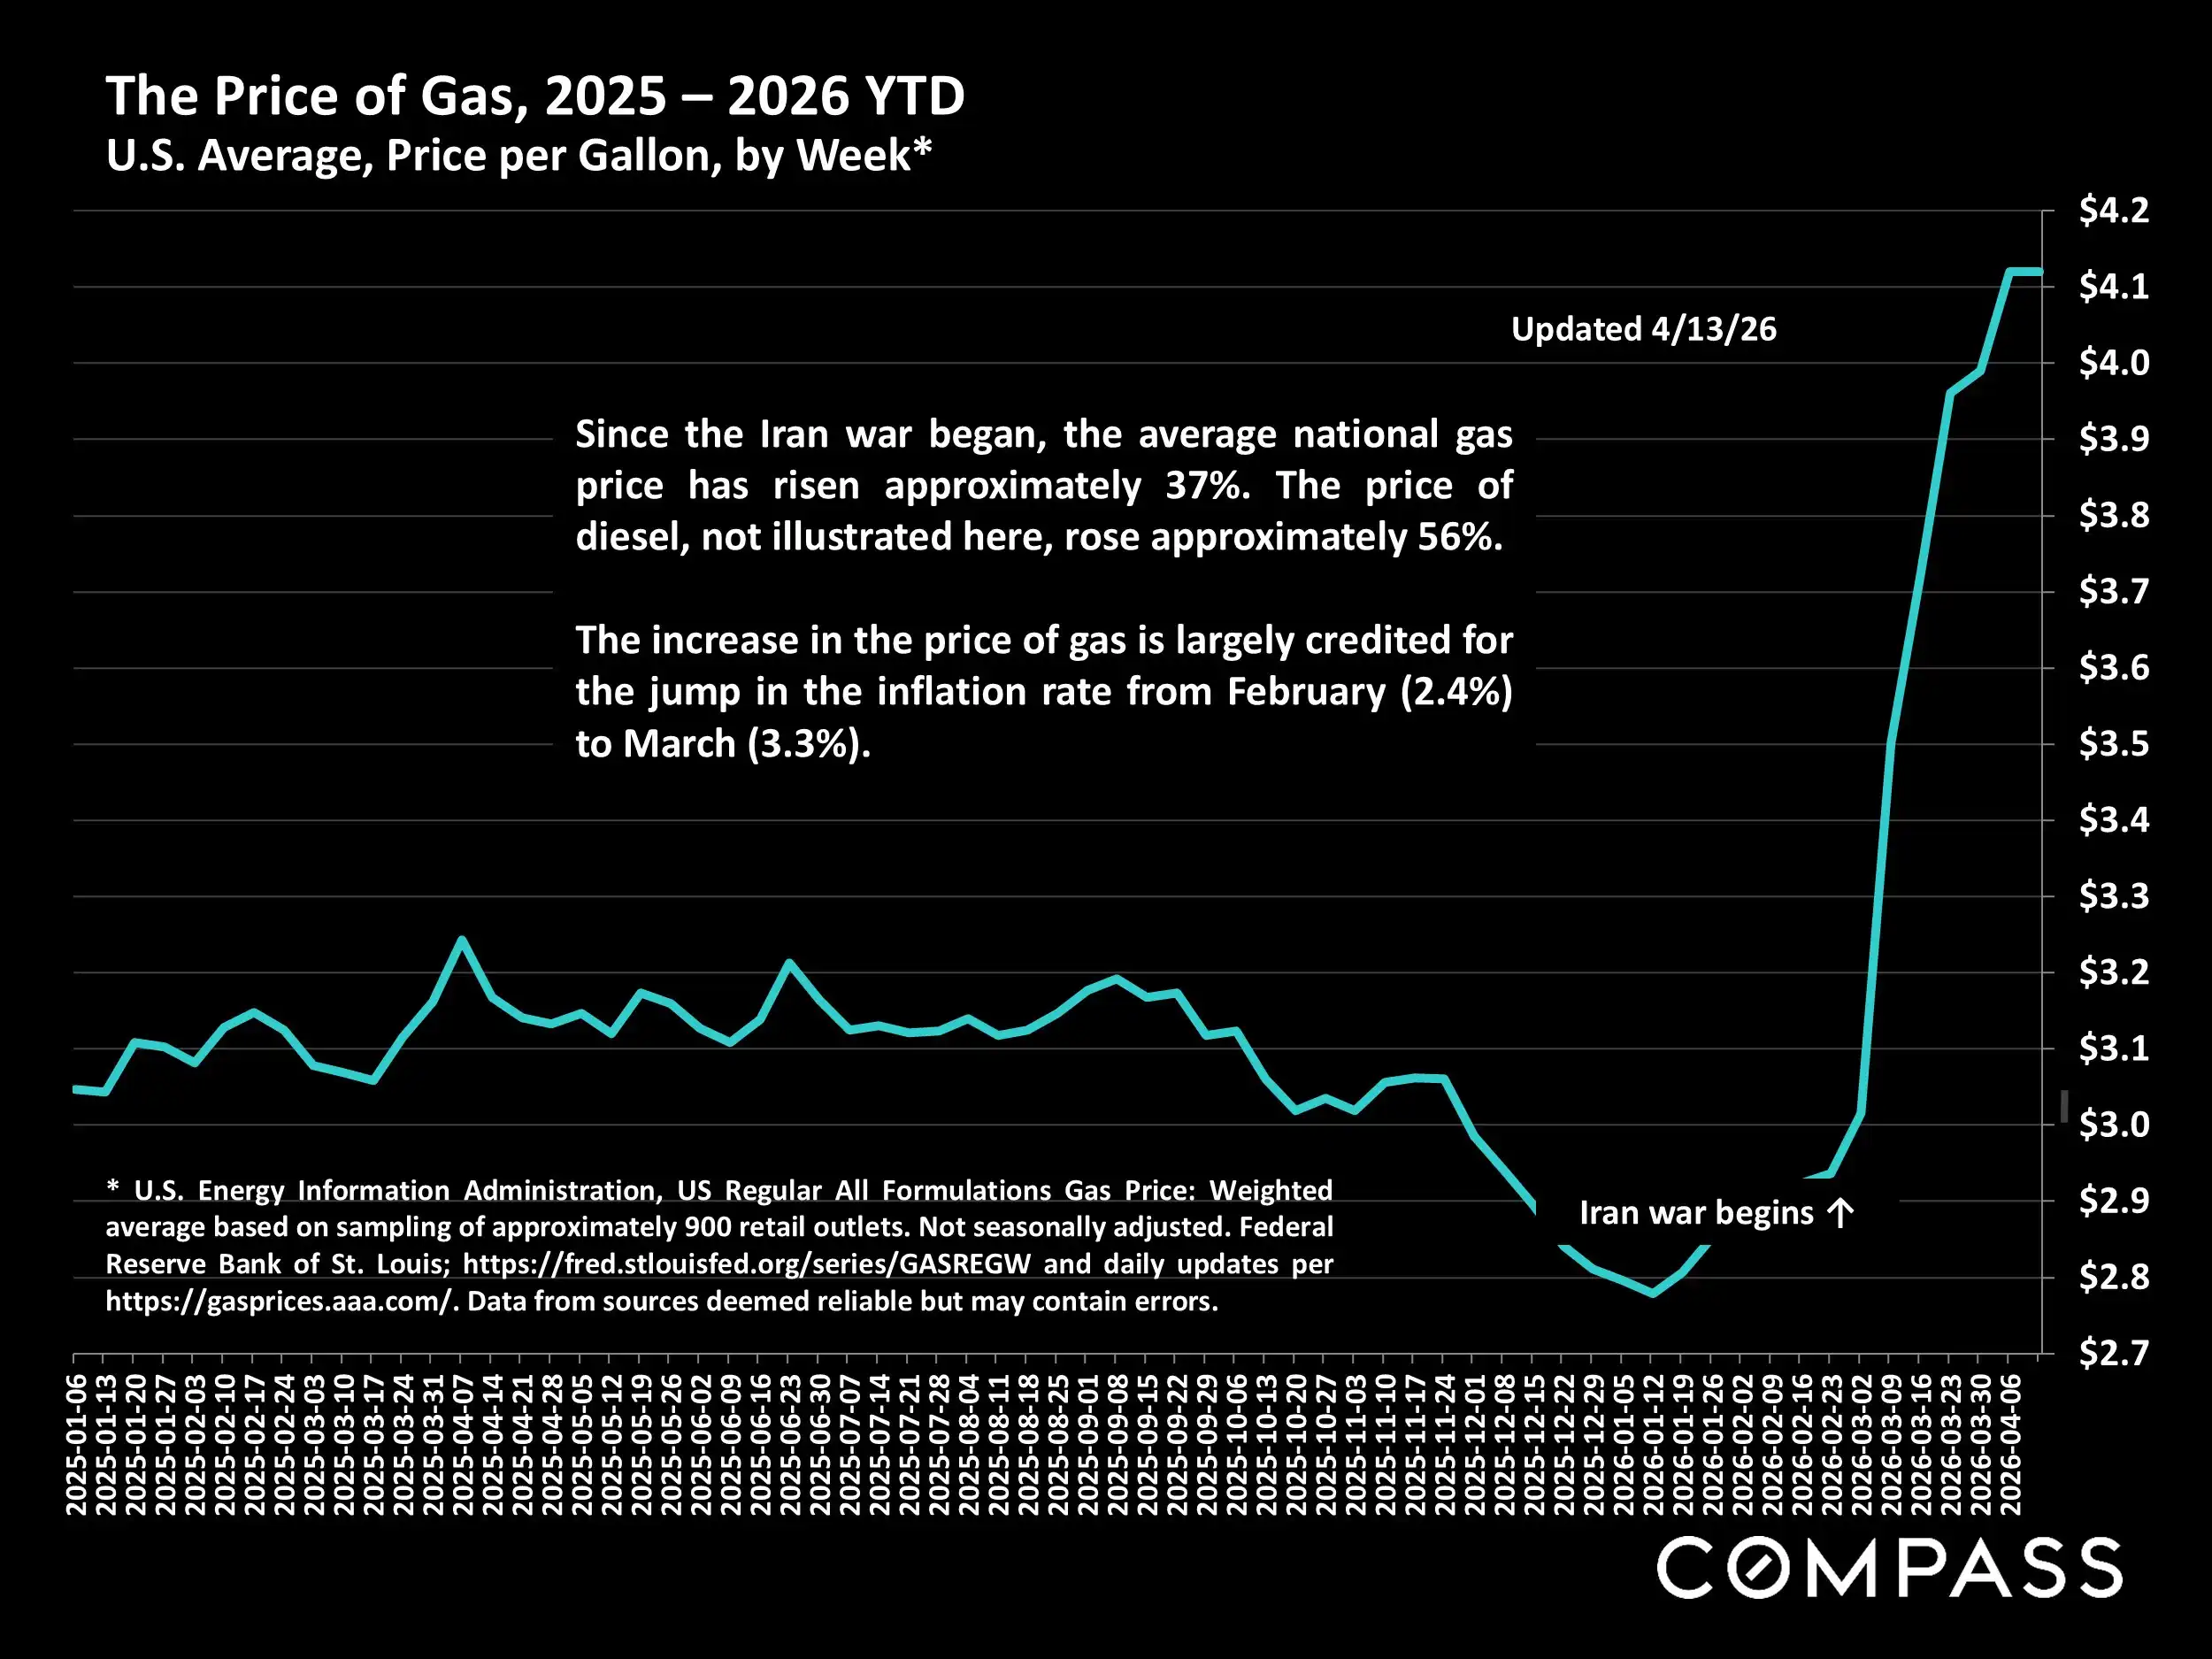
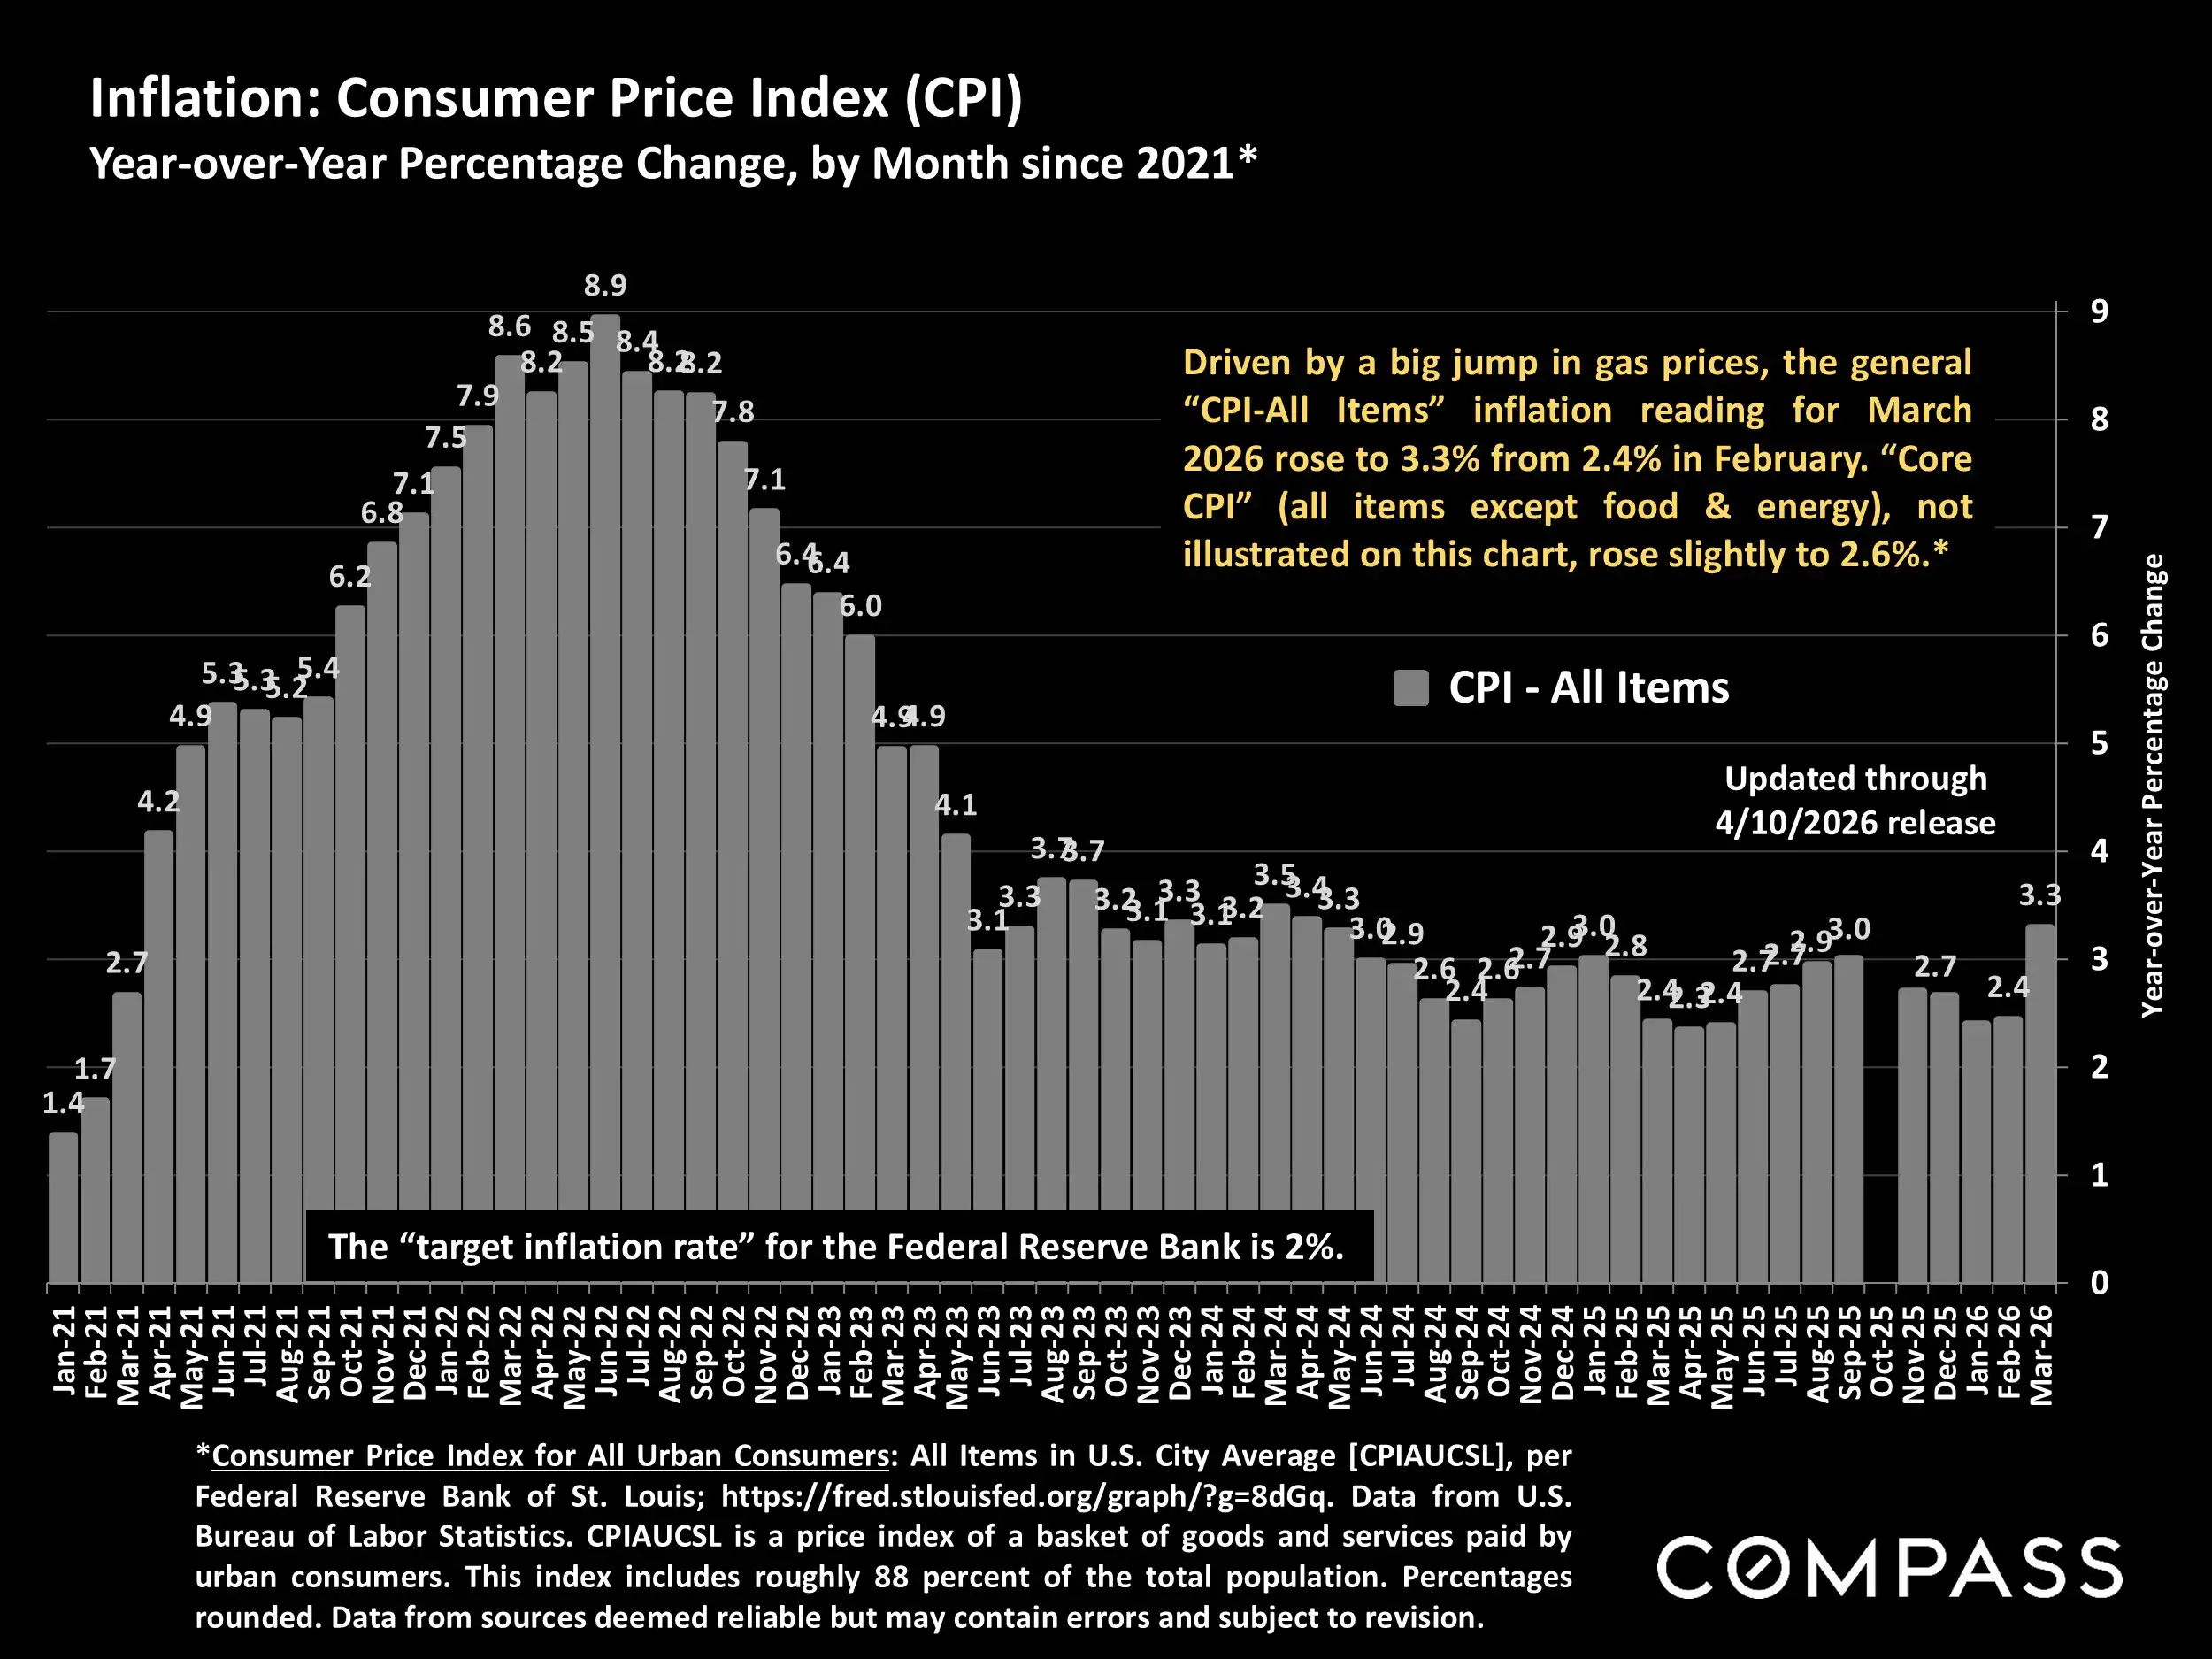
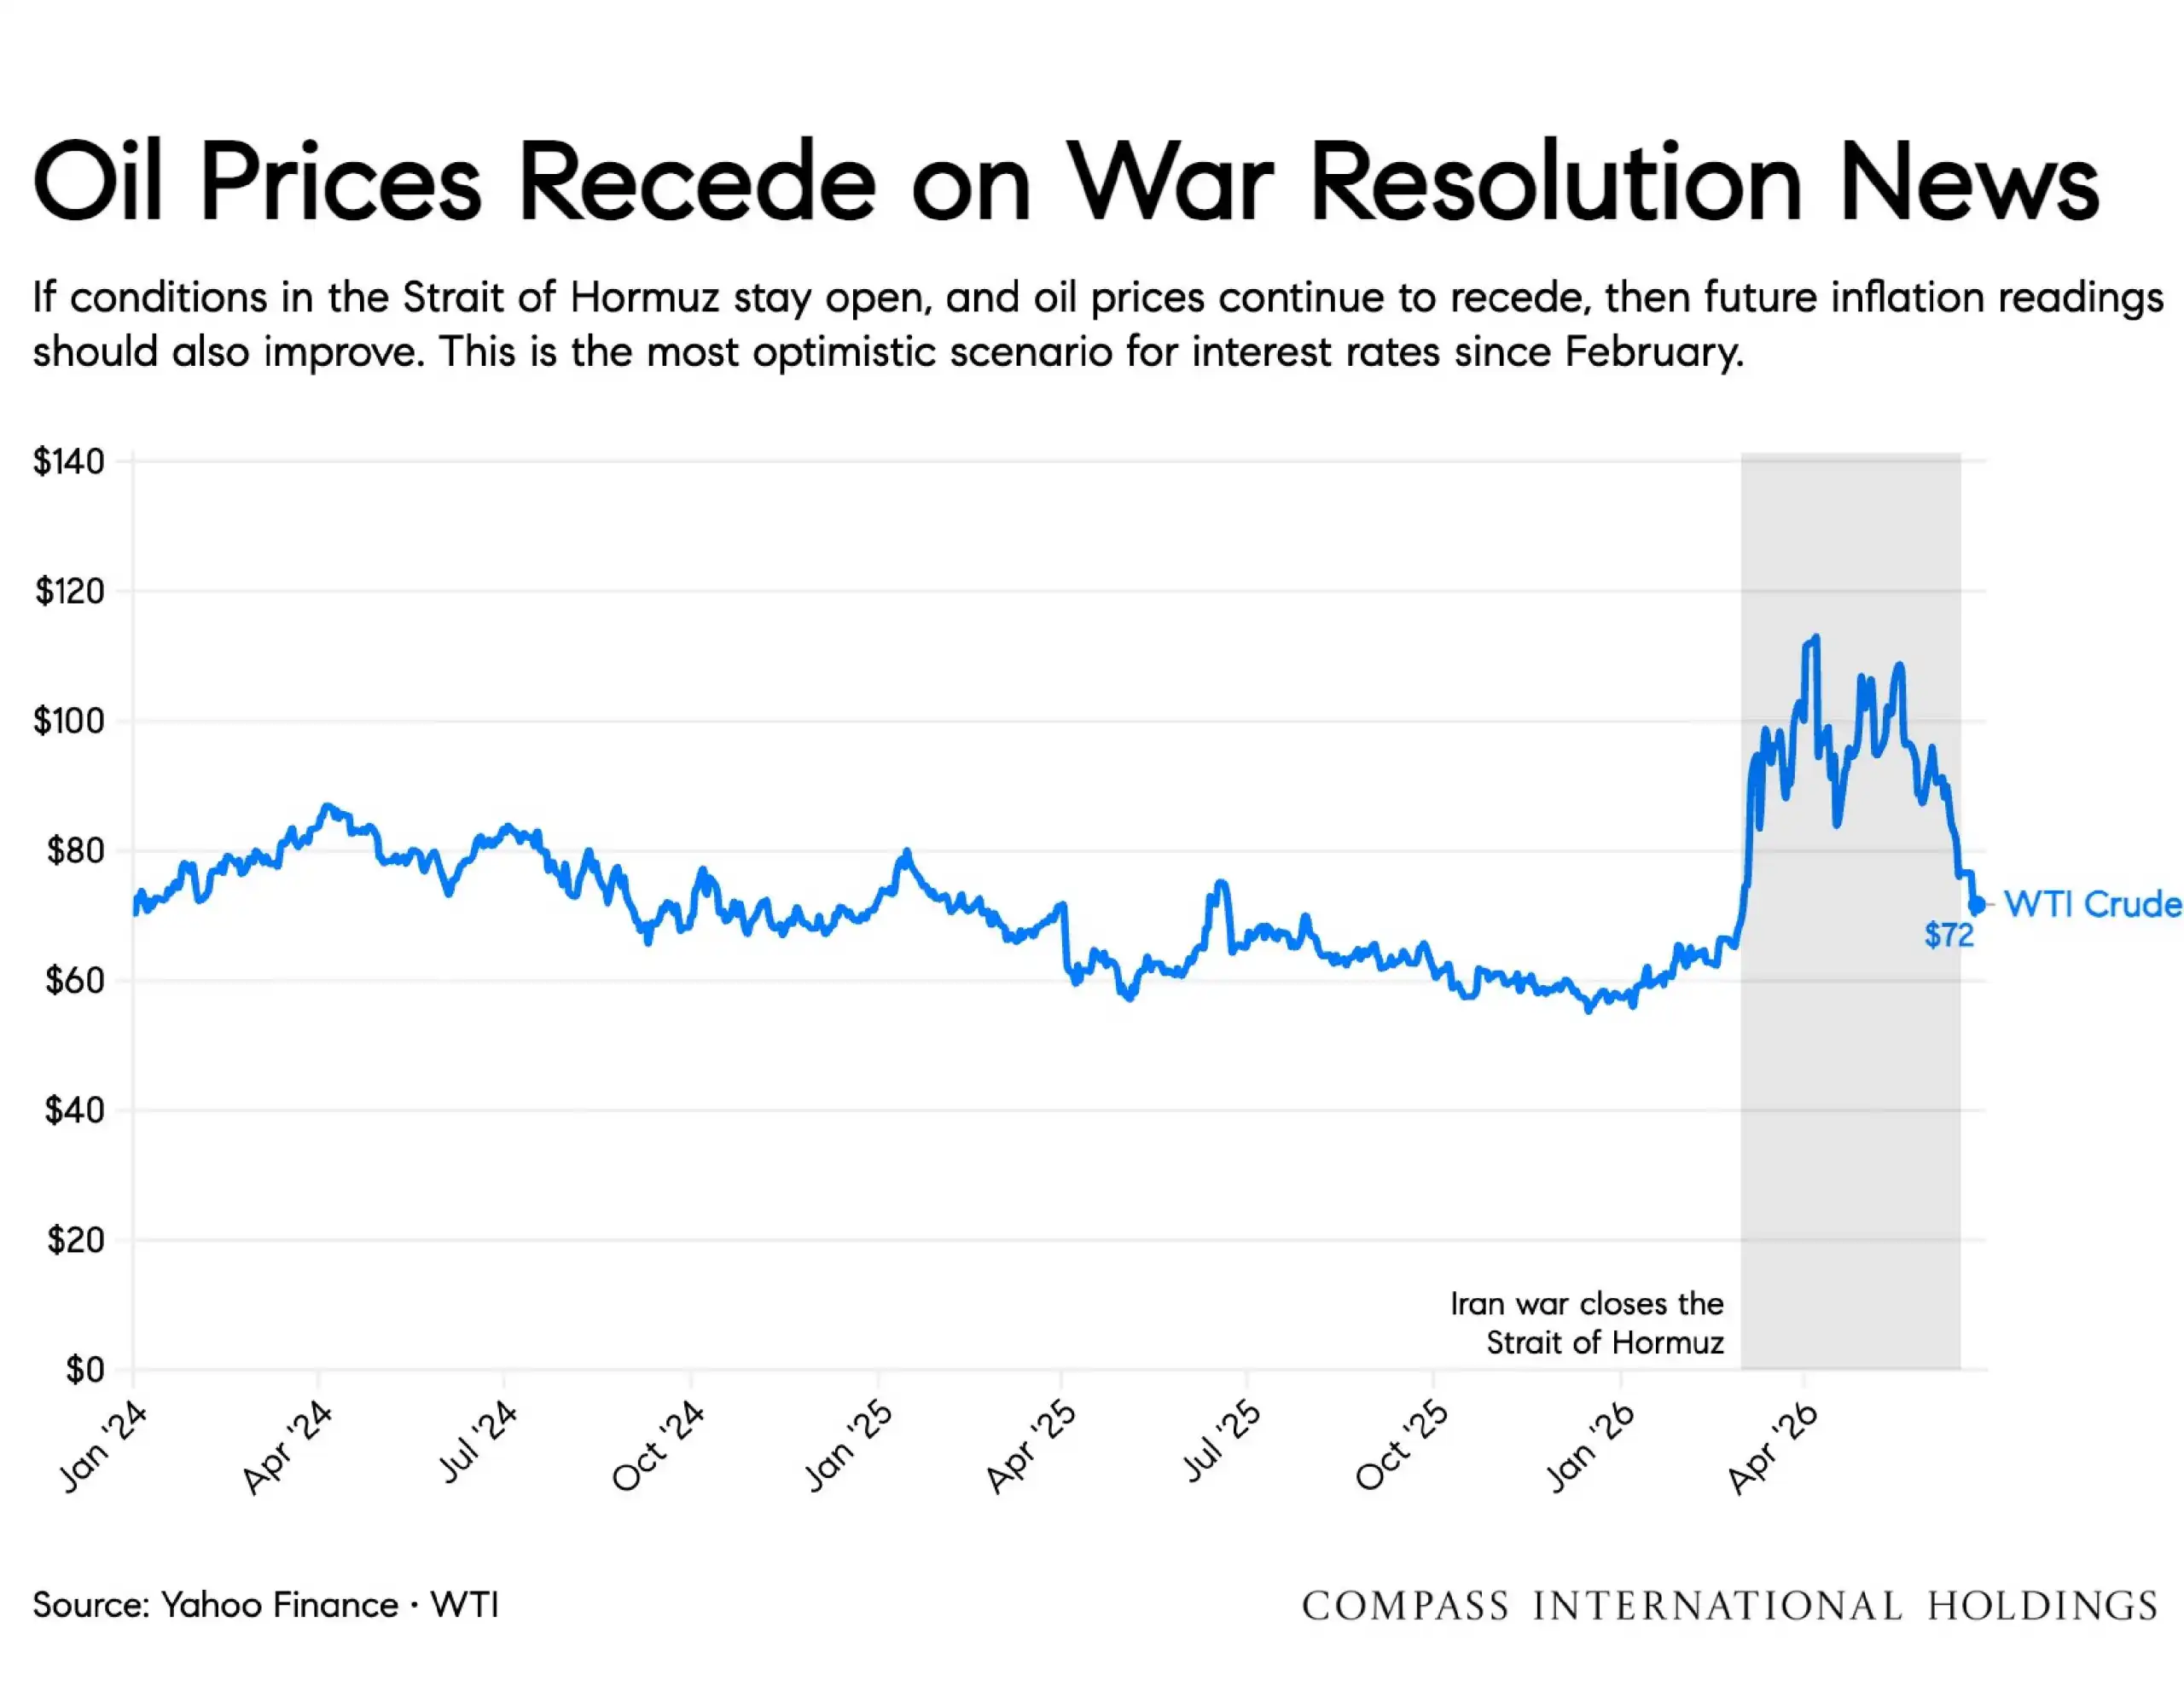
Mortgage rates stayed relatively stable in early March, while broader economic uncertainty, including stock market volatility, oil price swings, inflation concerns, and policy uncertainty, continued to influence consumer confidence. For buyers and sellers, the key takeaway is that the market is improving, but not uniformly. Pricing, preparation, property condition, and local market knowledge remain essential.
While national conditions continue to normalize, buyers remain highly sensitive to pricing, condition, and overall value positioning, especially in lifestyle-driven coastal markets. In markets like Northern Palm Beach County, hyper-local pricing strategy, thoughtful preparation, and neighborhood-specific demand trends continue to shape outcomes more than national headlines alone.
As spring activity builds, well-positioned homes continue to attract attention, while buyers are becoming more thoughtful and value-conscious. In this environment, strategy matters more than ever.
Market at a Glance
Mortgage Rates: Rates remained relatively stable near early-2026 levels.
Home Prices: National single-family home prices were essentially flat year over year.
Inventory: Active listings increased year over year, giving buyers more options.
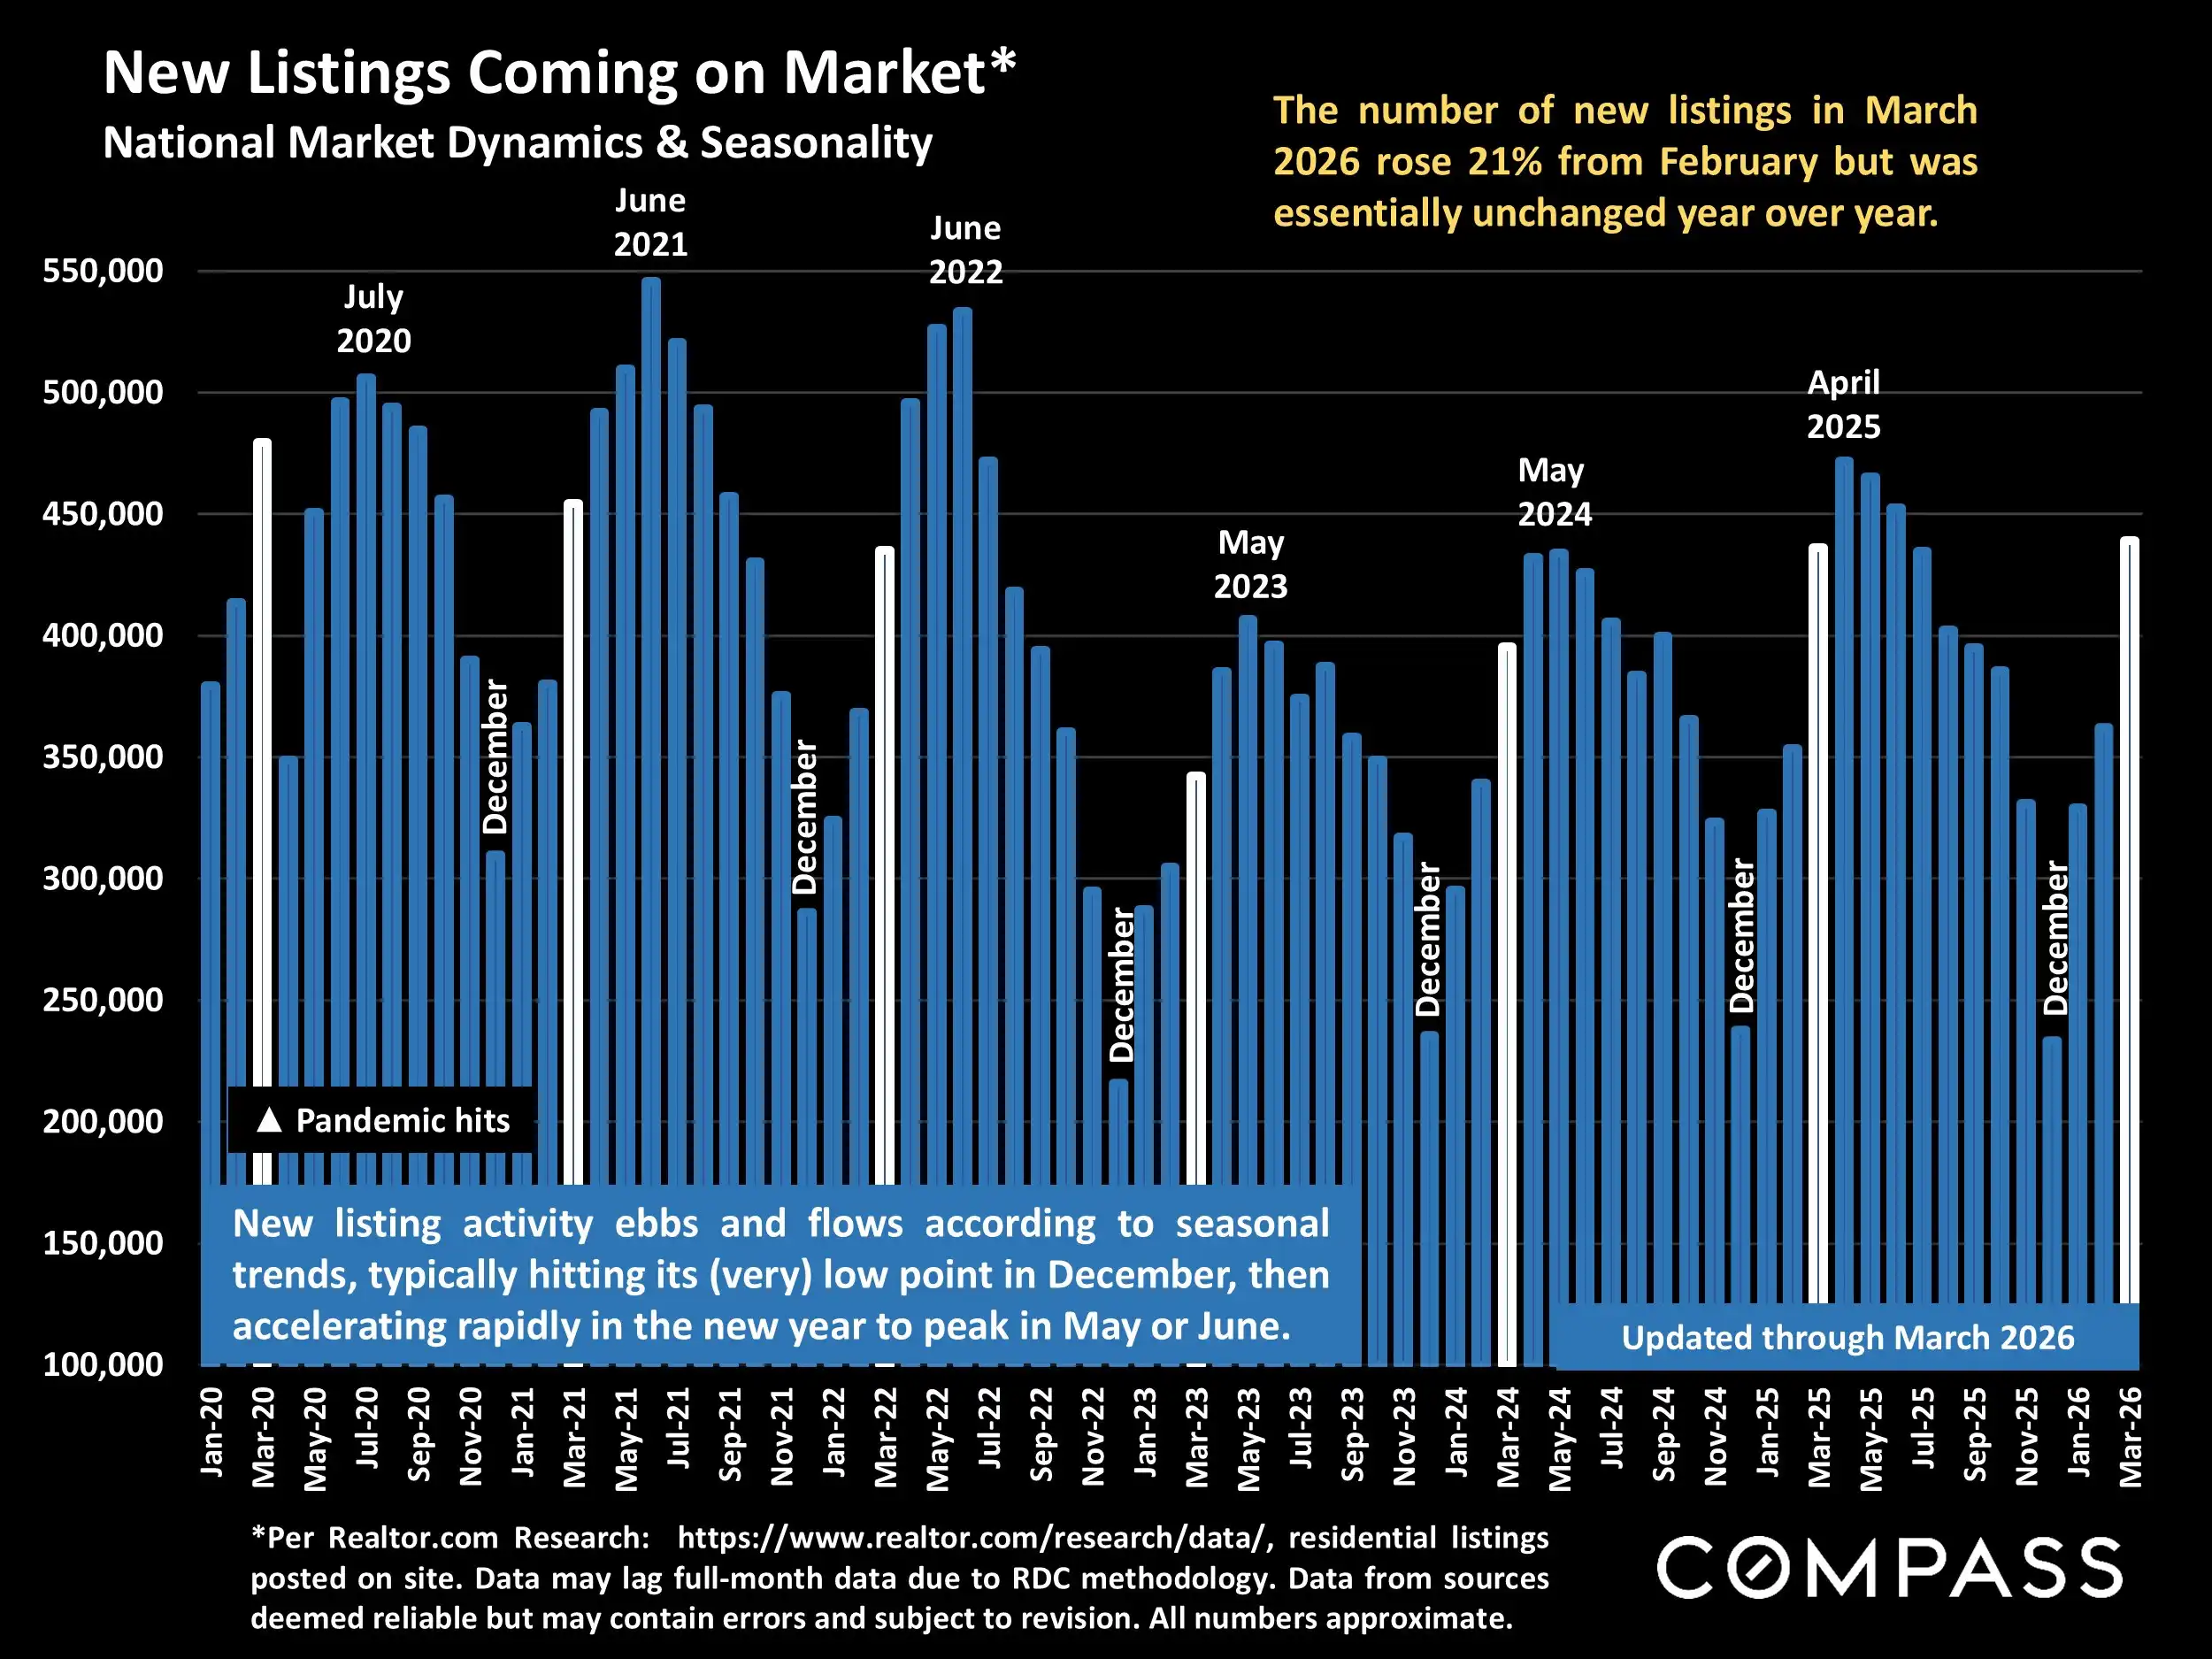
New Listings: New listing activity continued to rise heading into spring.
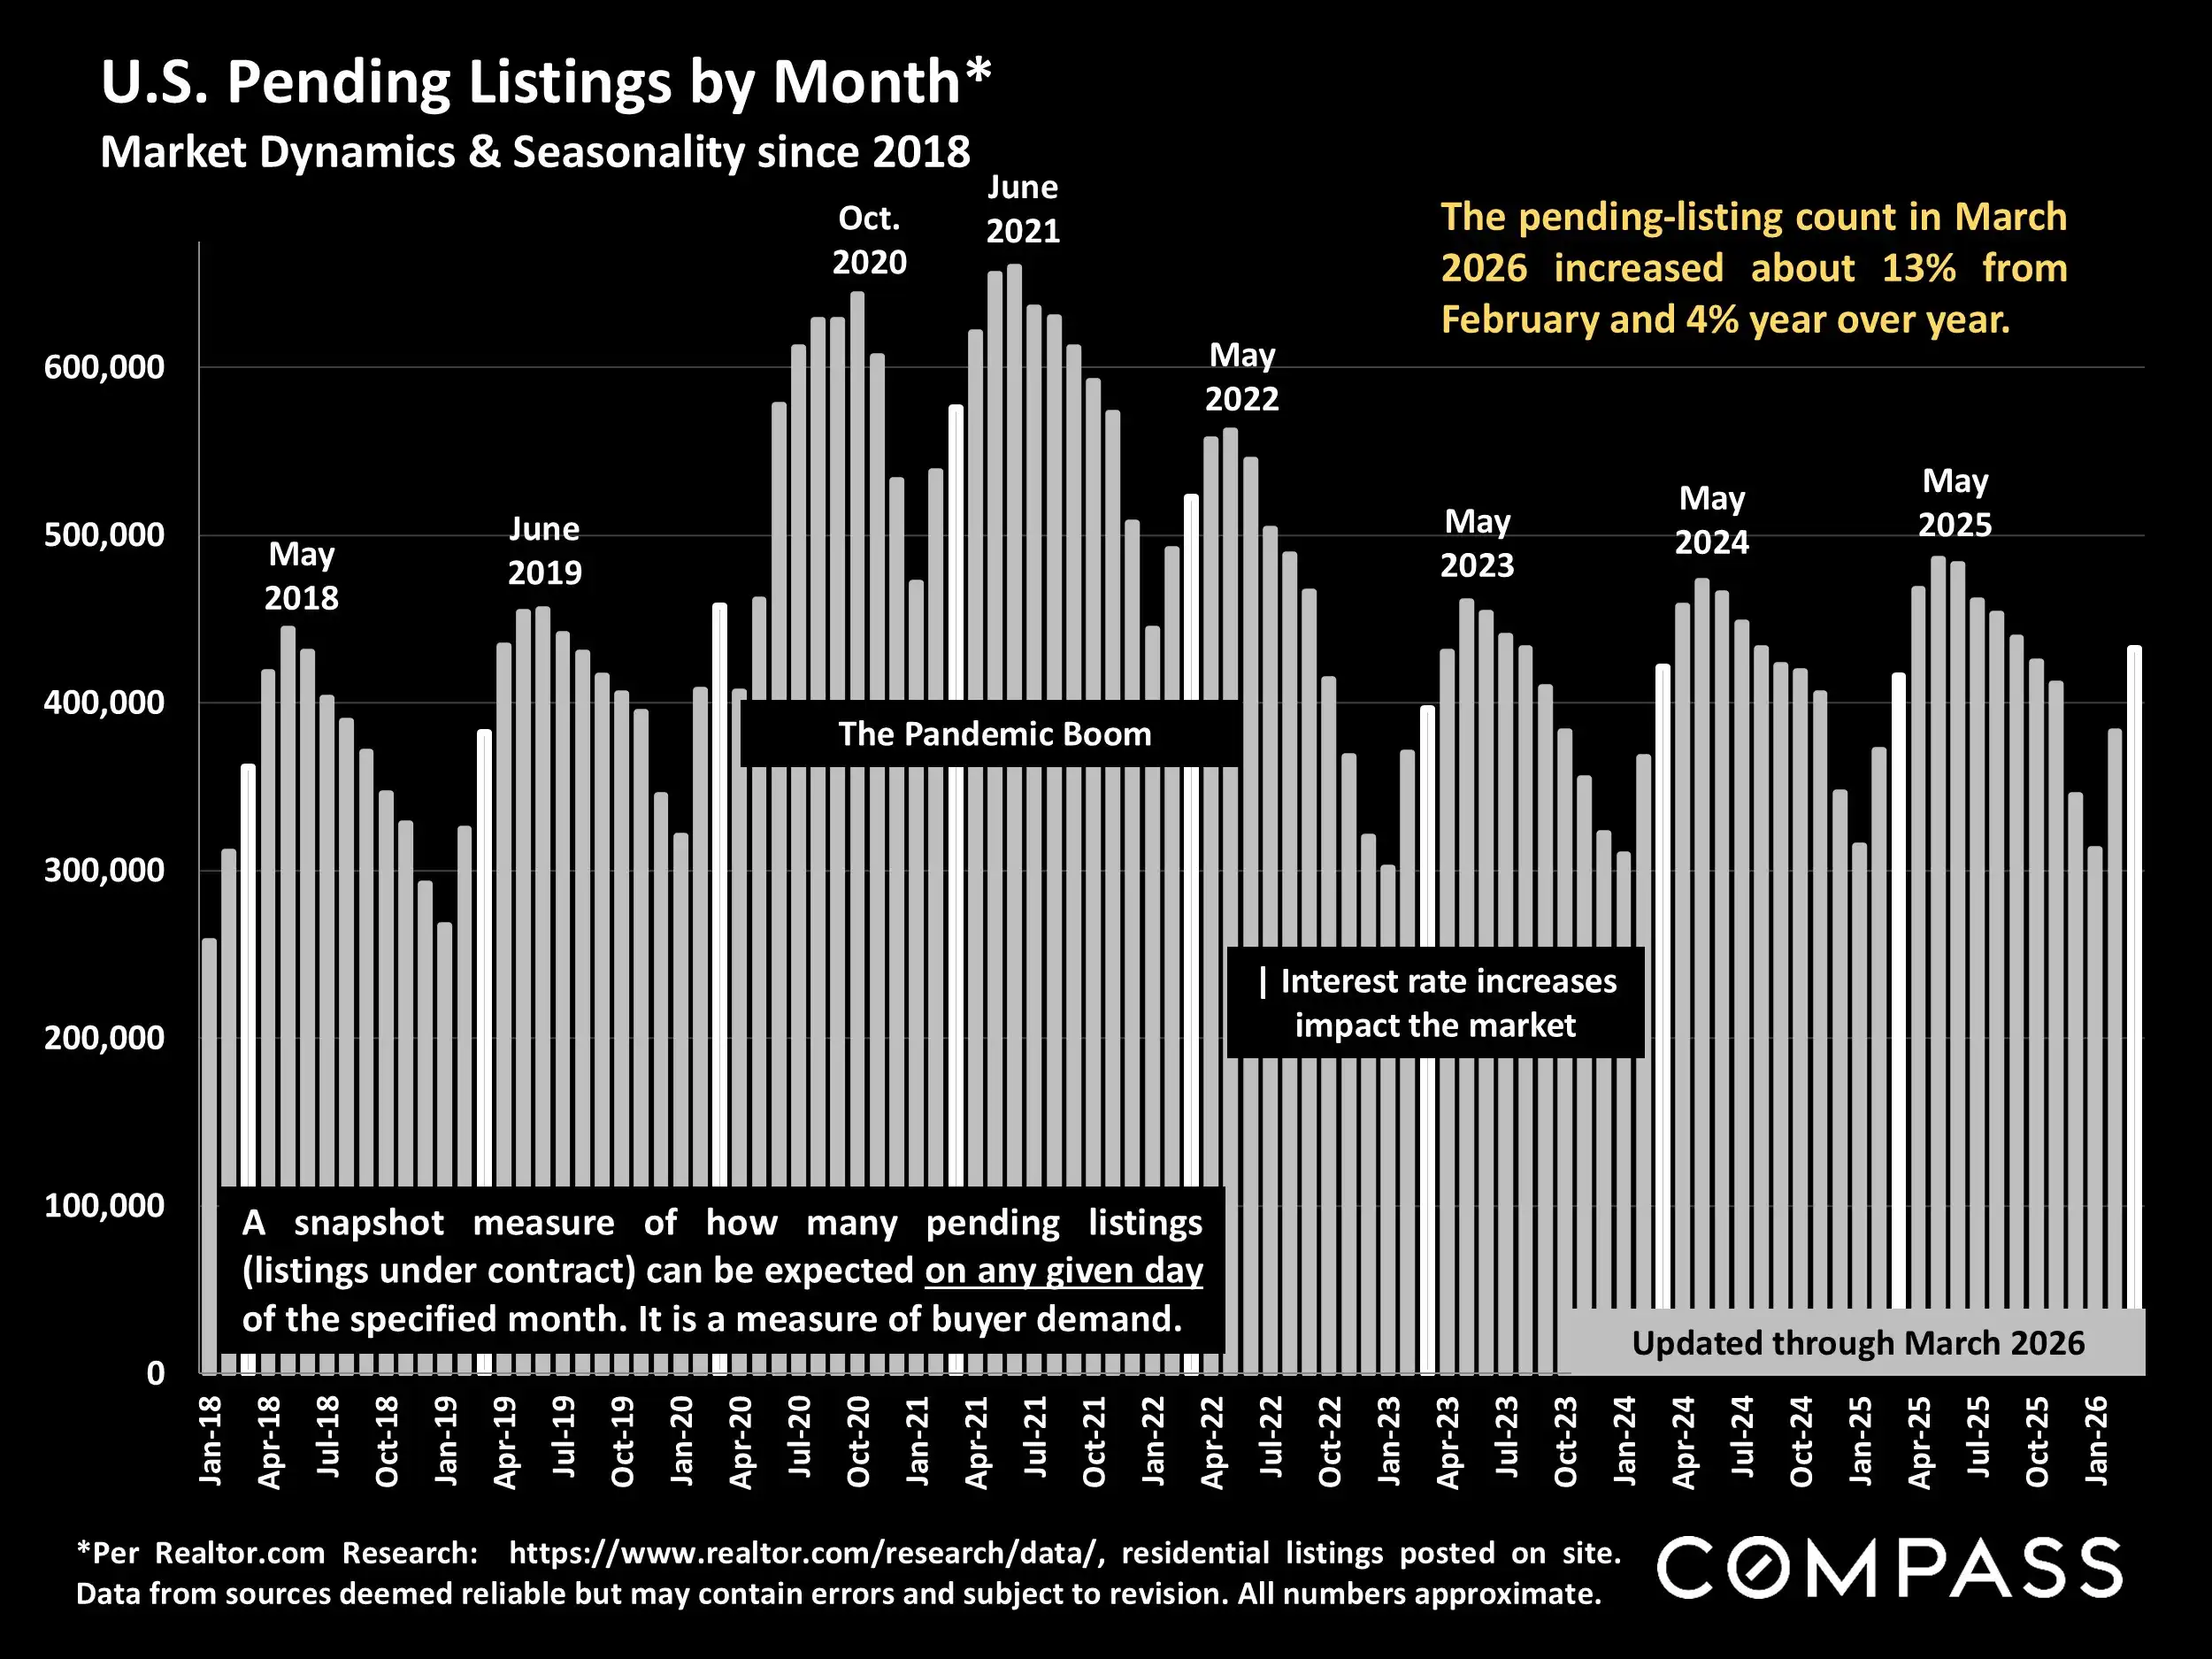
Pending Sales: Pending activity improved modestly from January and year over year.
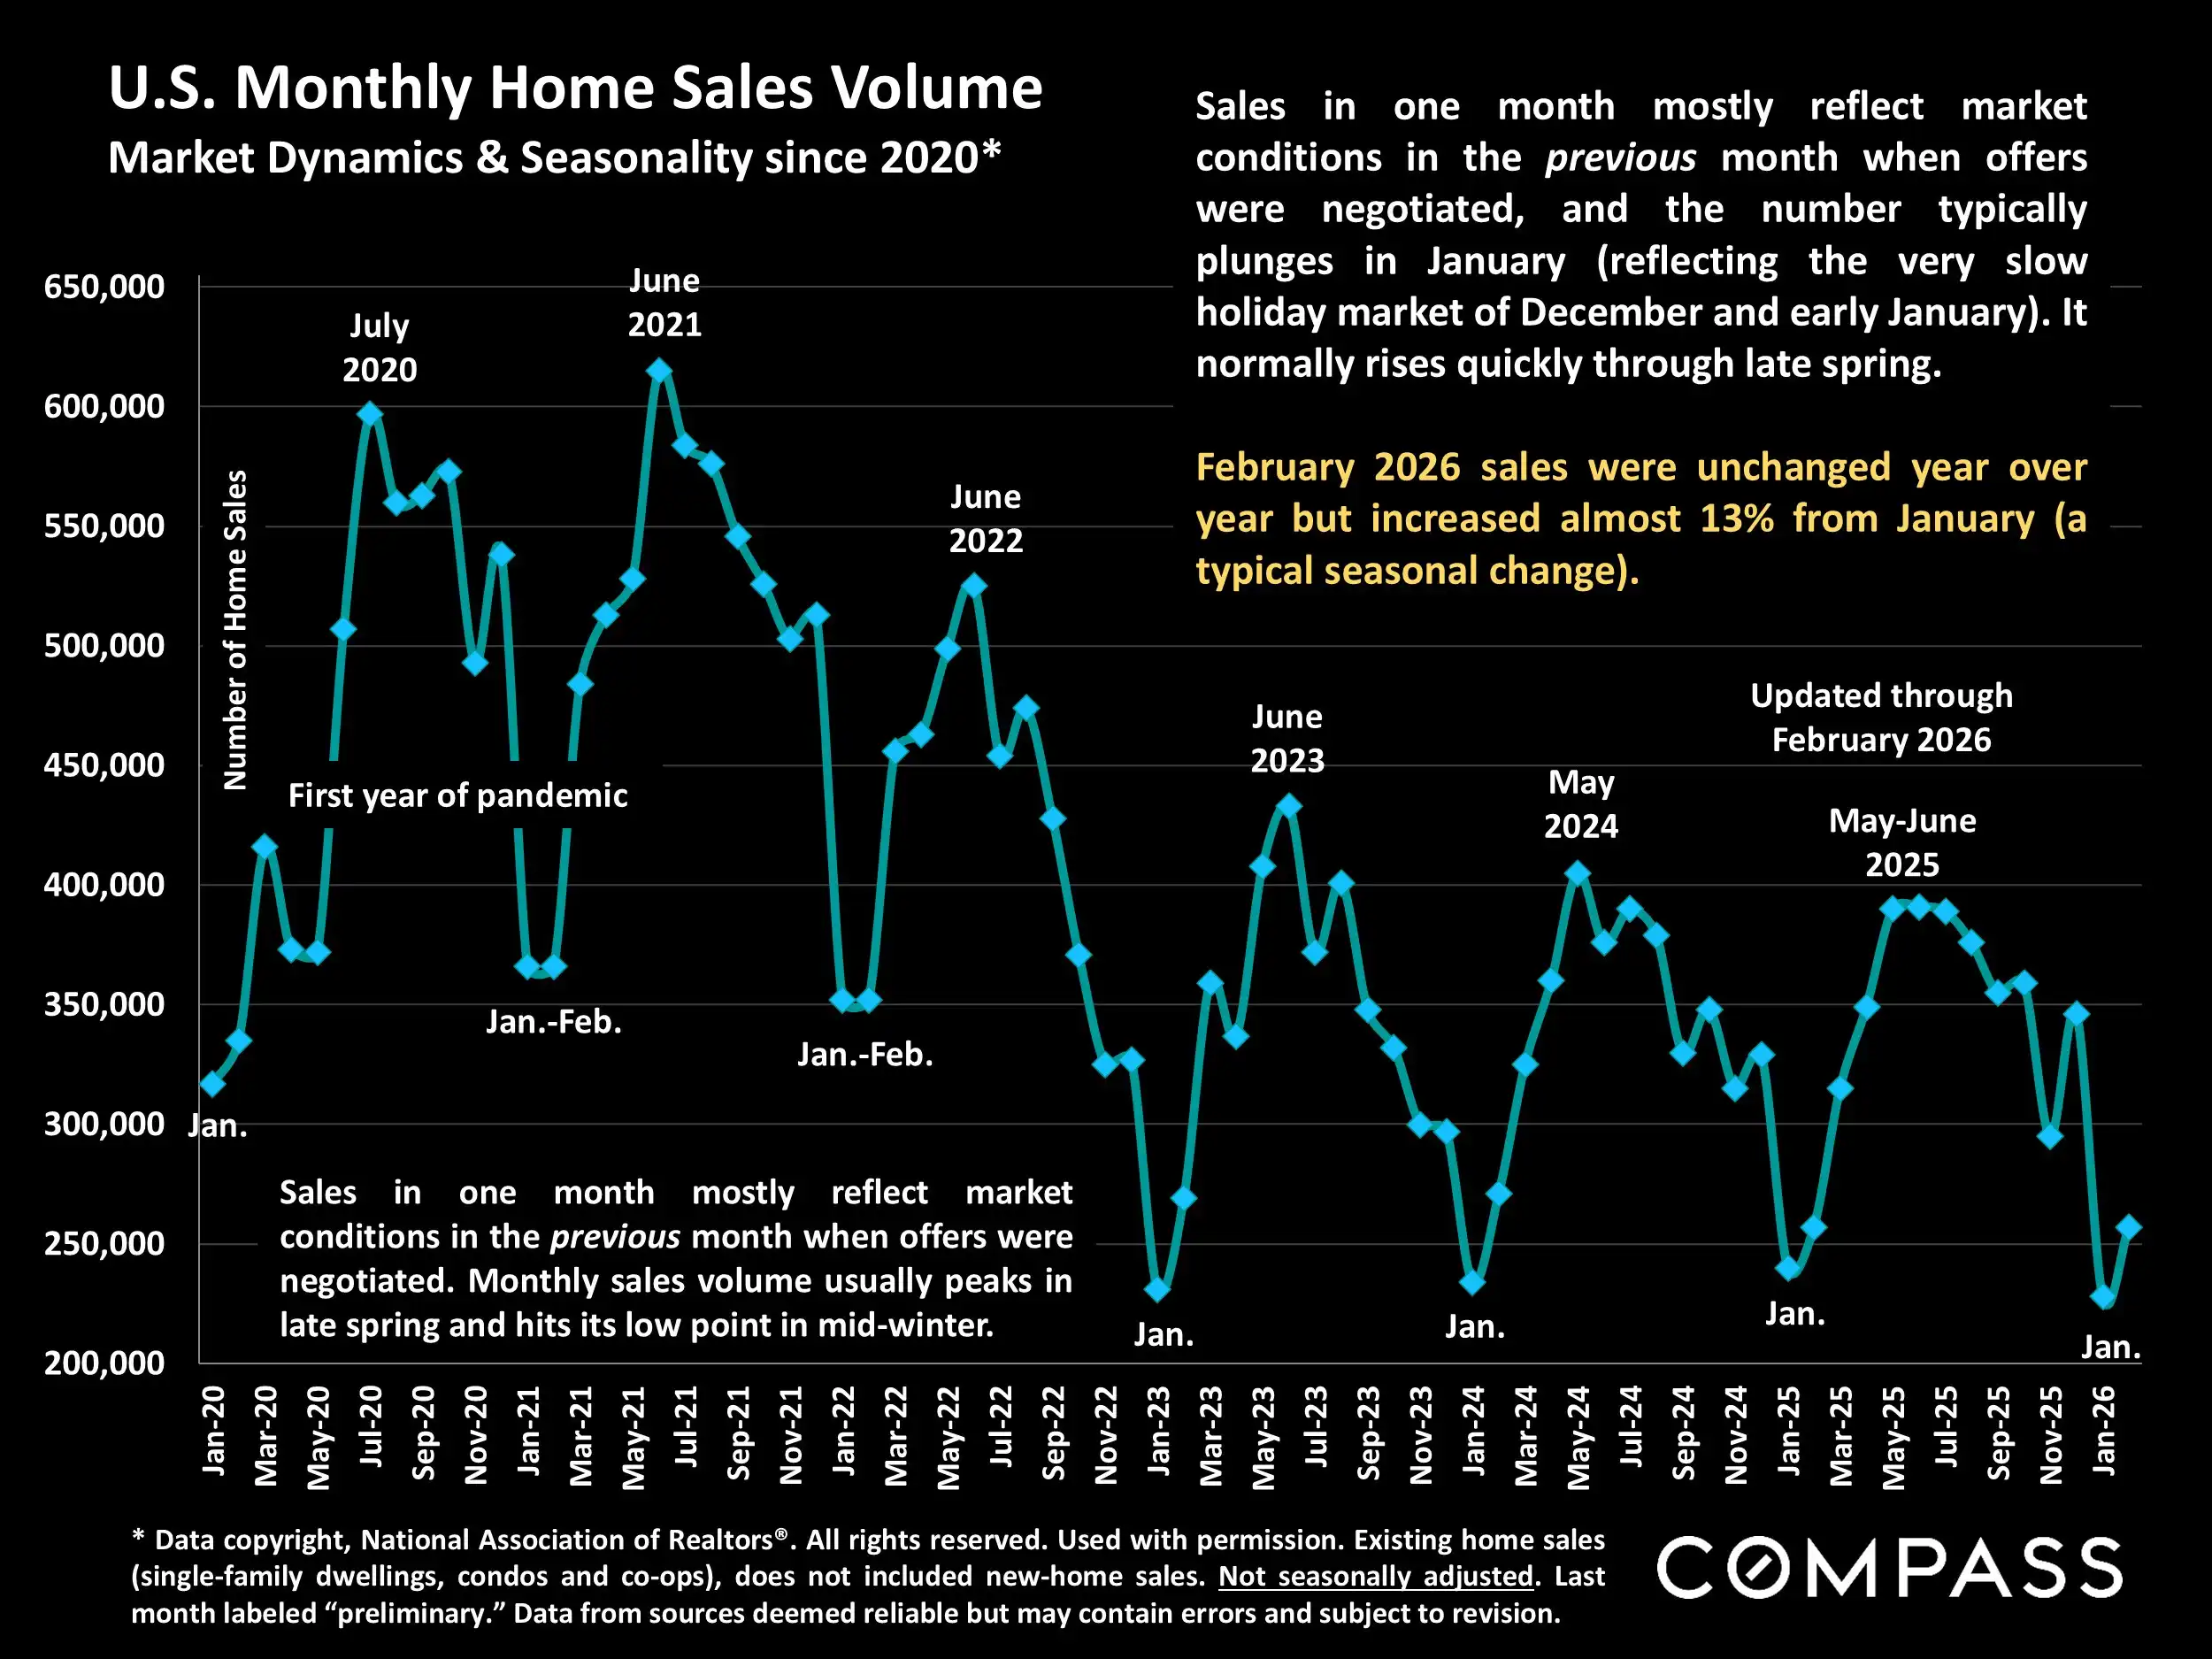
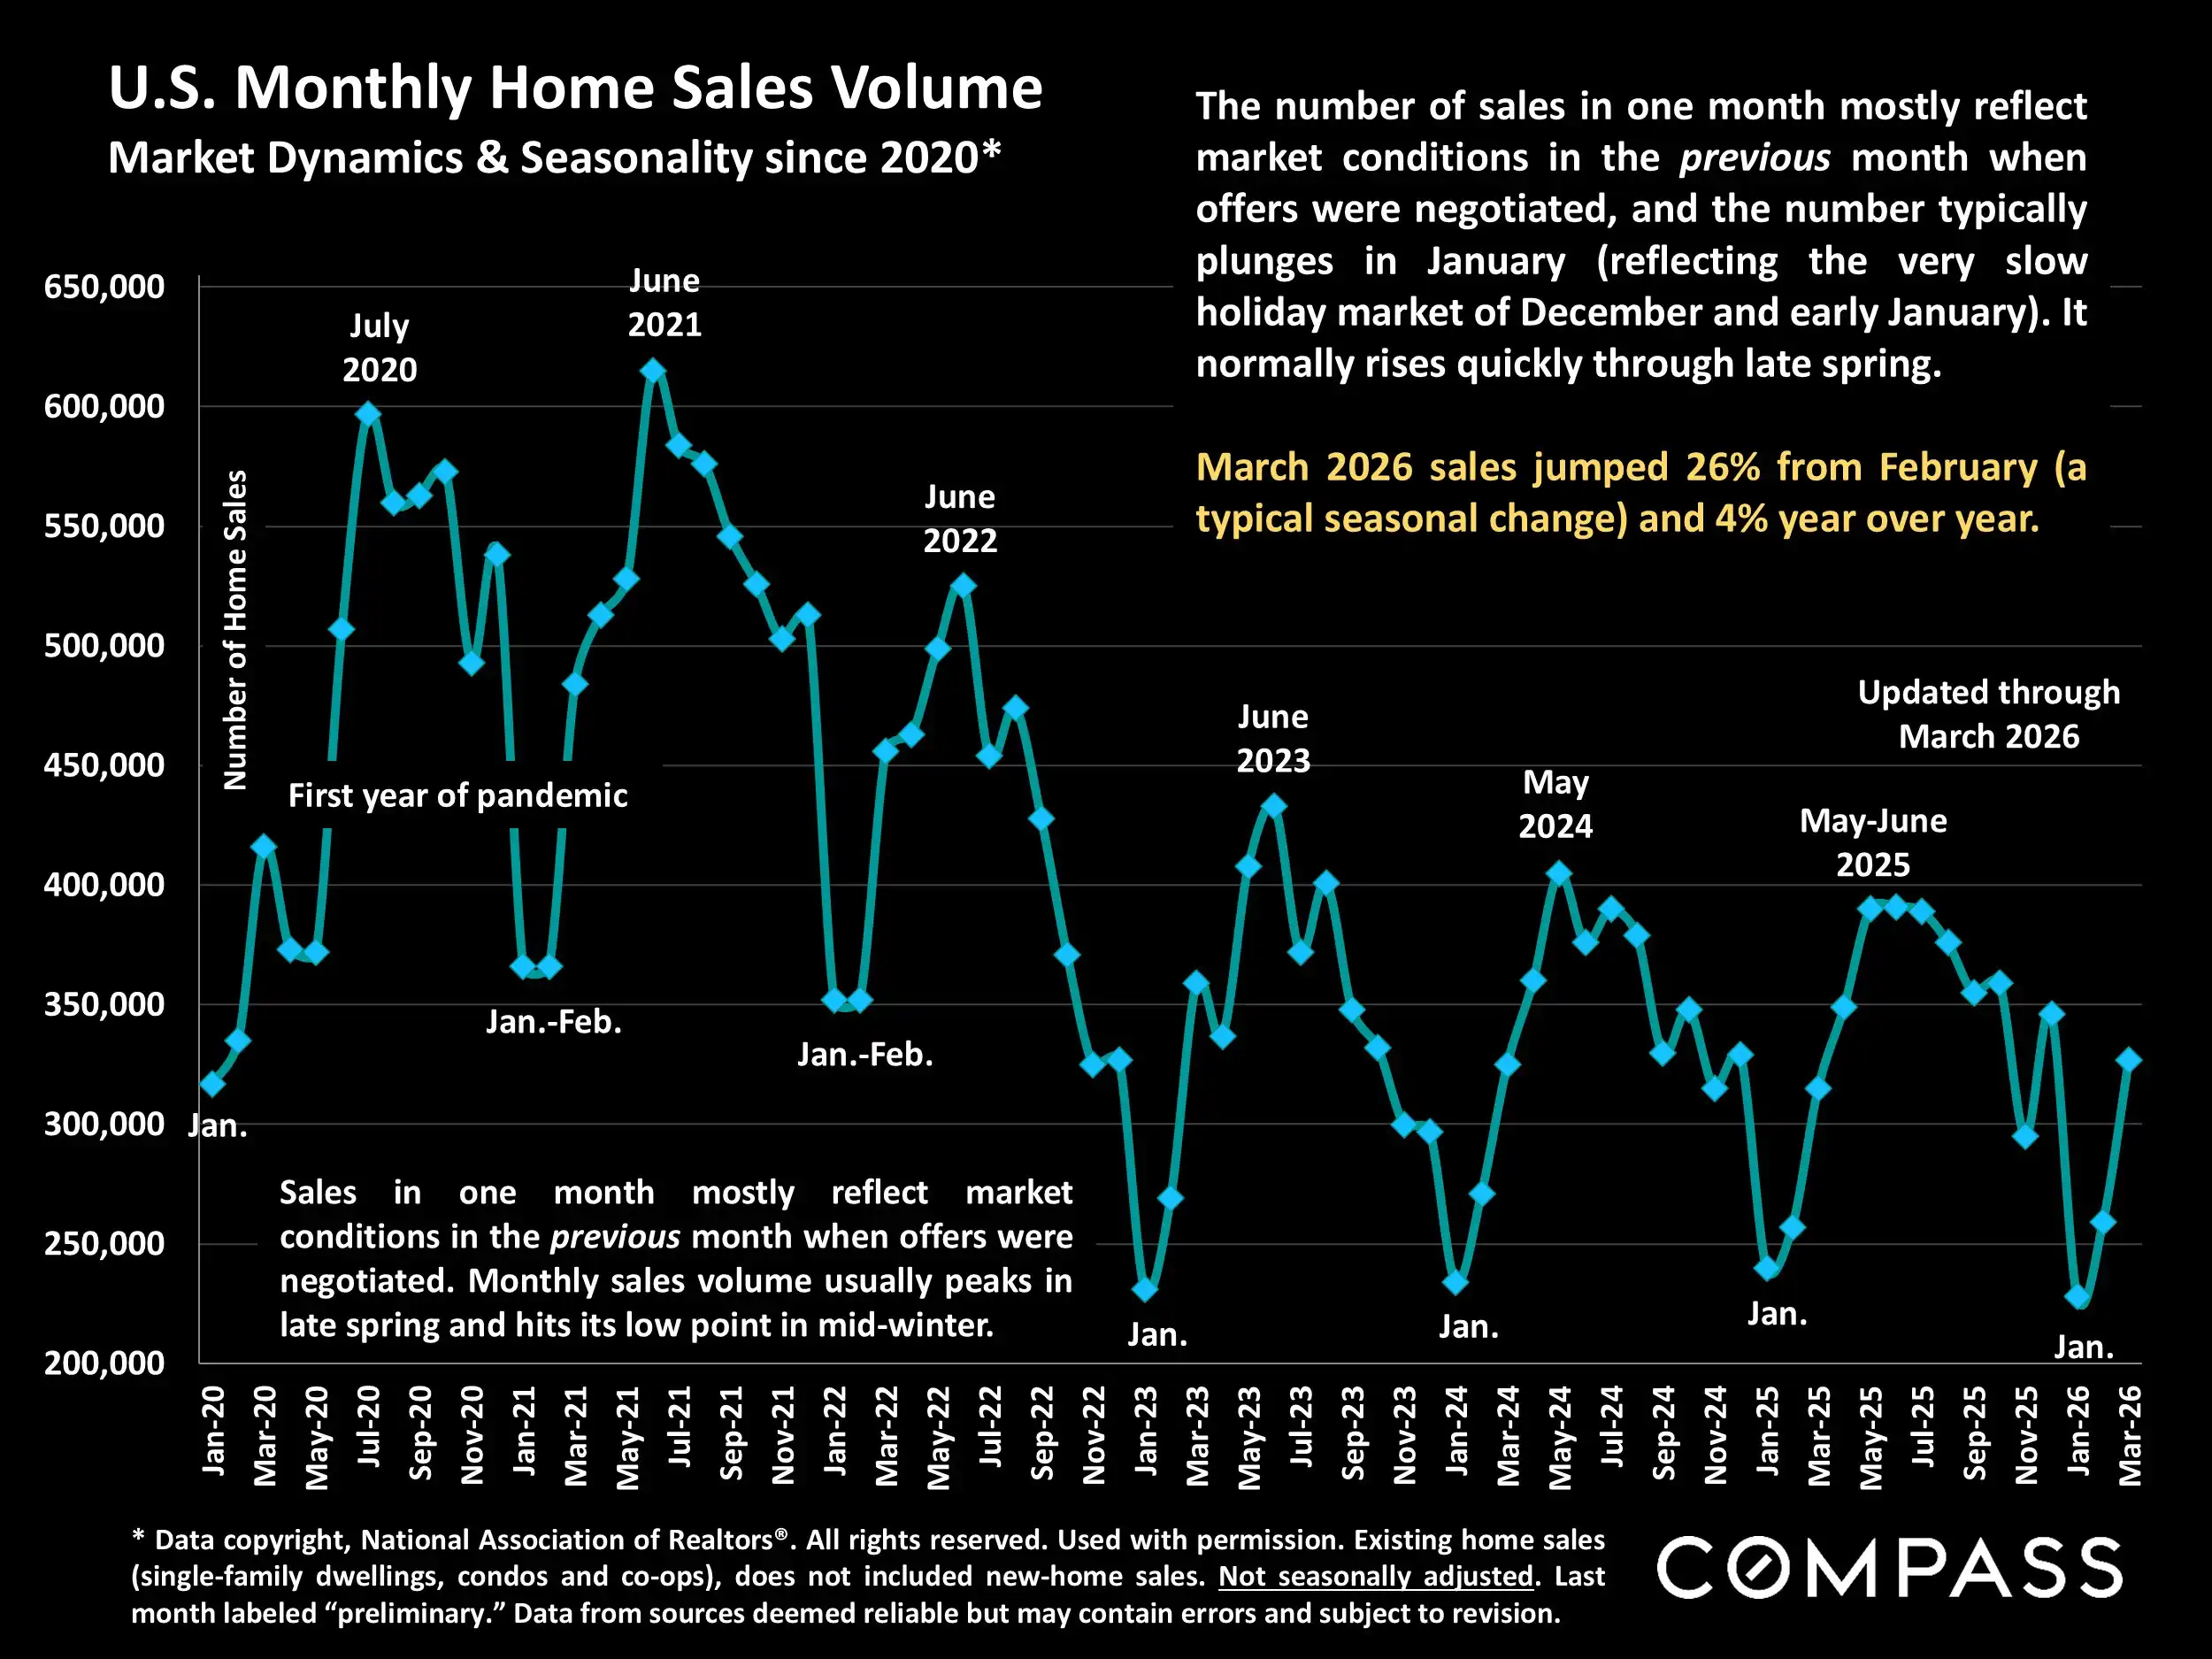
Sales Activity: February sales were flat year over year but up significantly from January.
Buyer Demand: Demand is present, but buyers remain selective and highly value-conscious.
Market Pace: Homes are taking longer to move, with days on market rising from last year.
Market Dynamics: Pricing strategy, preparation, and perceived value continue to influence buyer response heavily.
2026 Outlook: The spring market is building, though economic uncertainty may continue to keep activity measured.
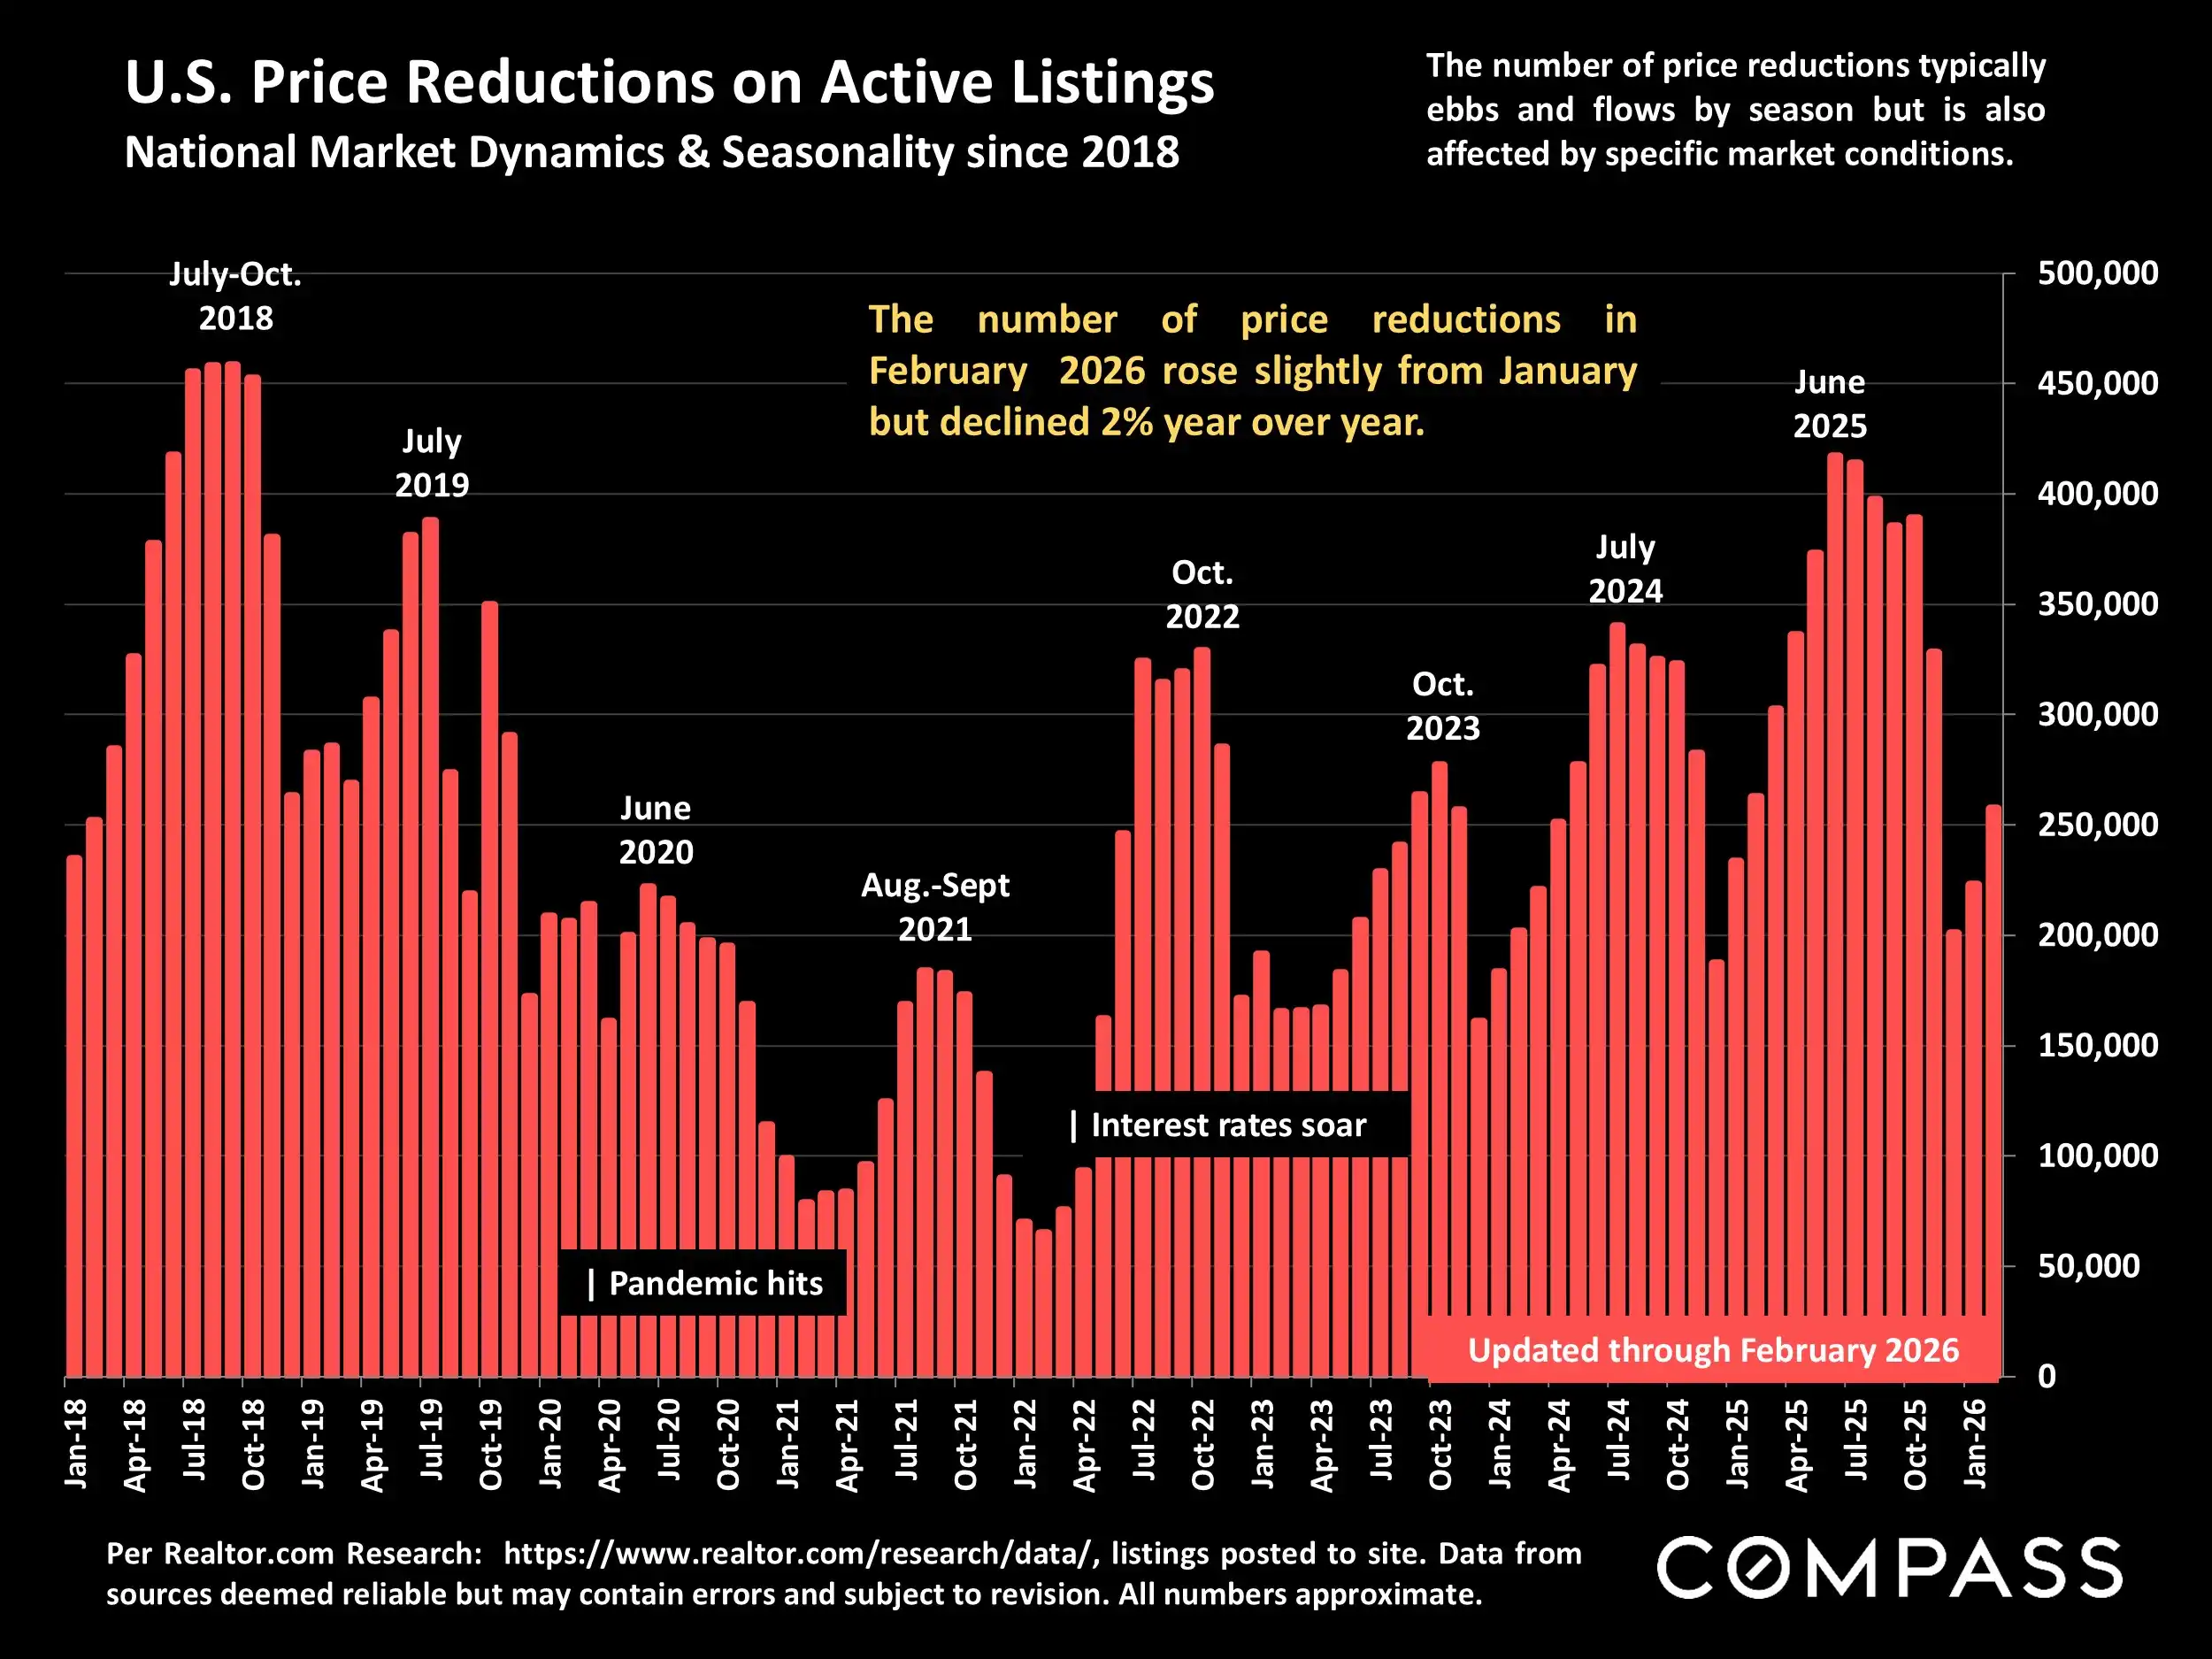
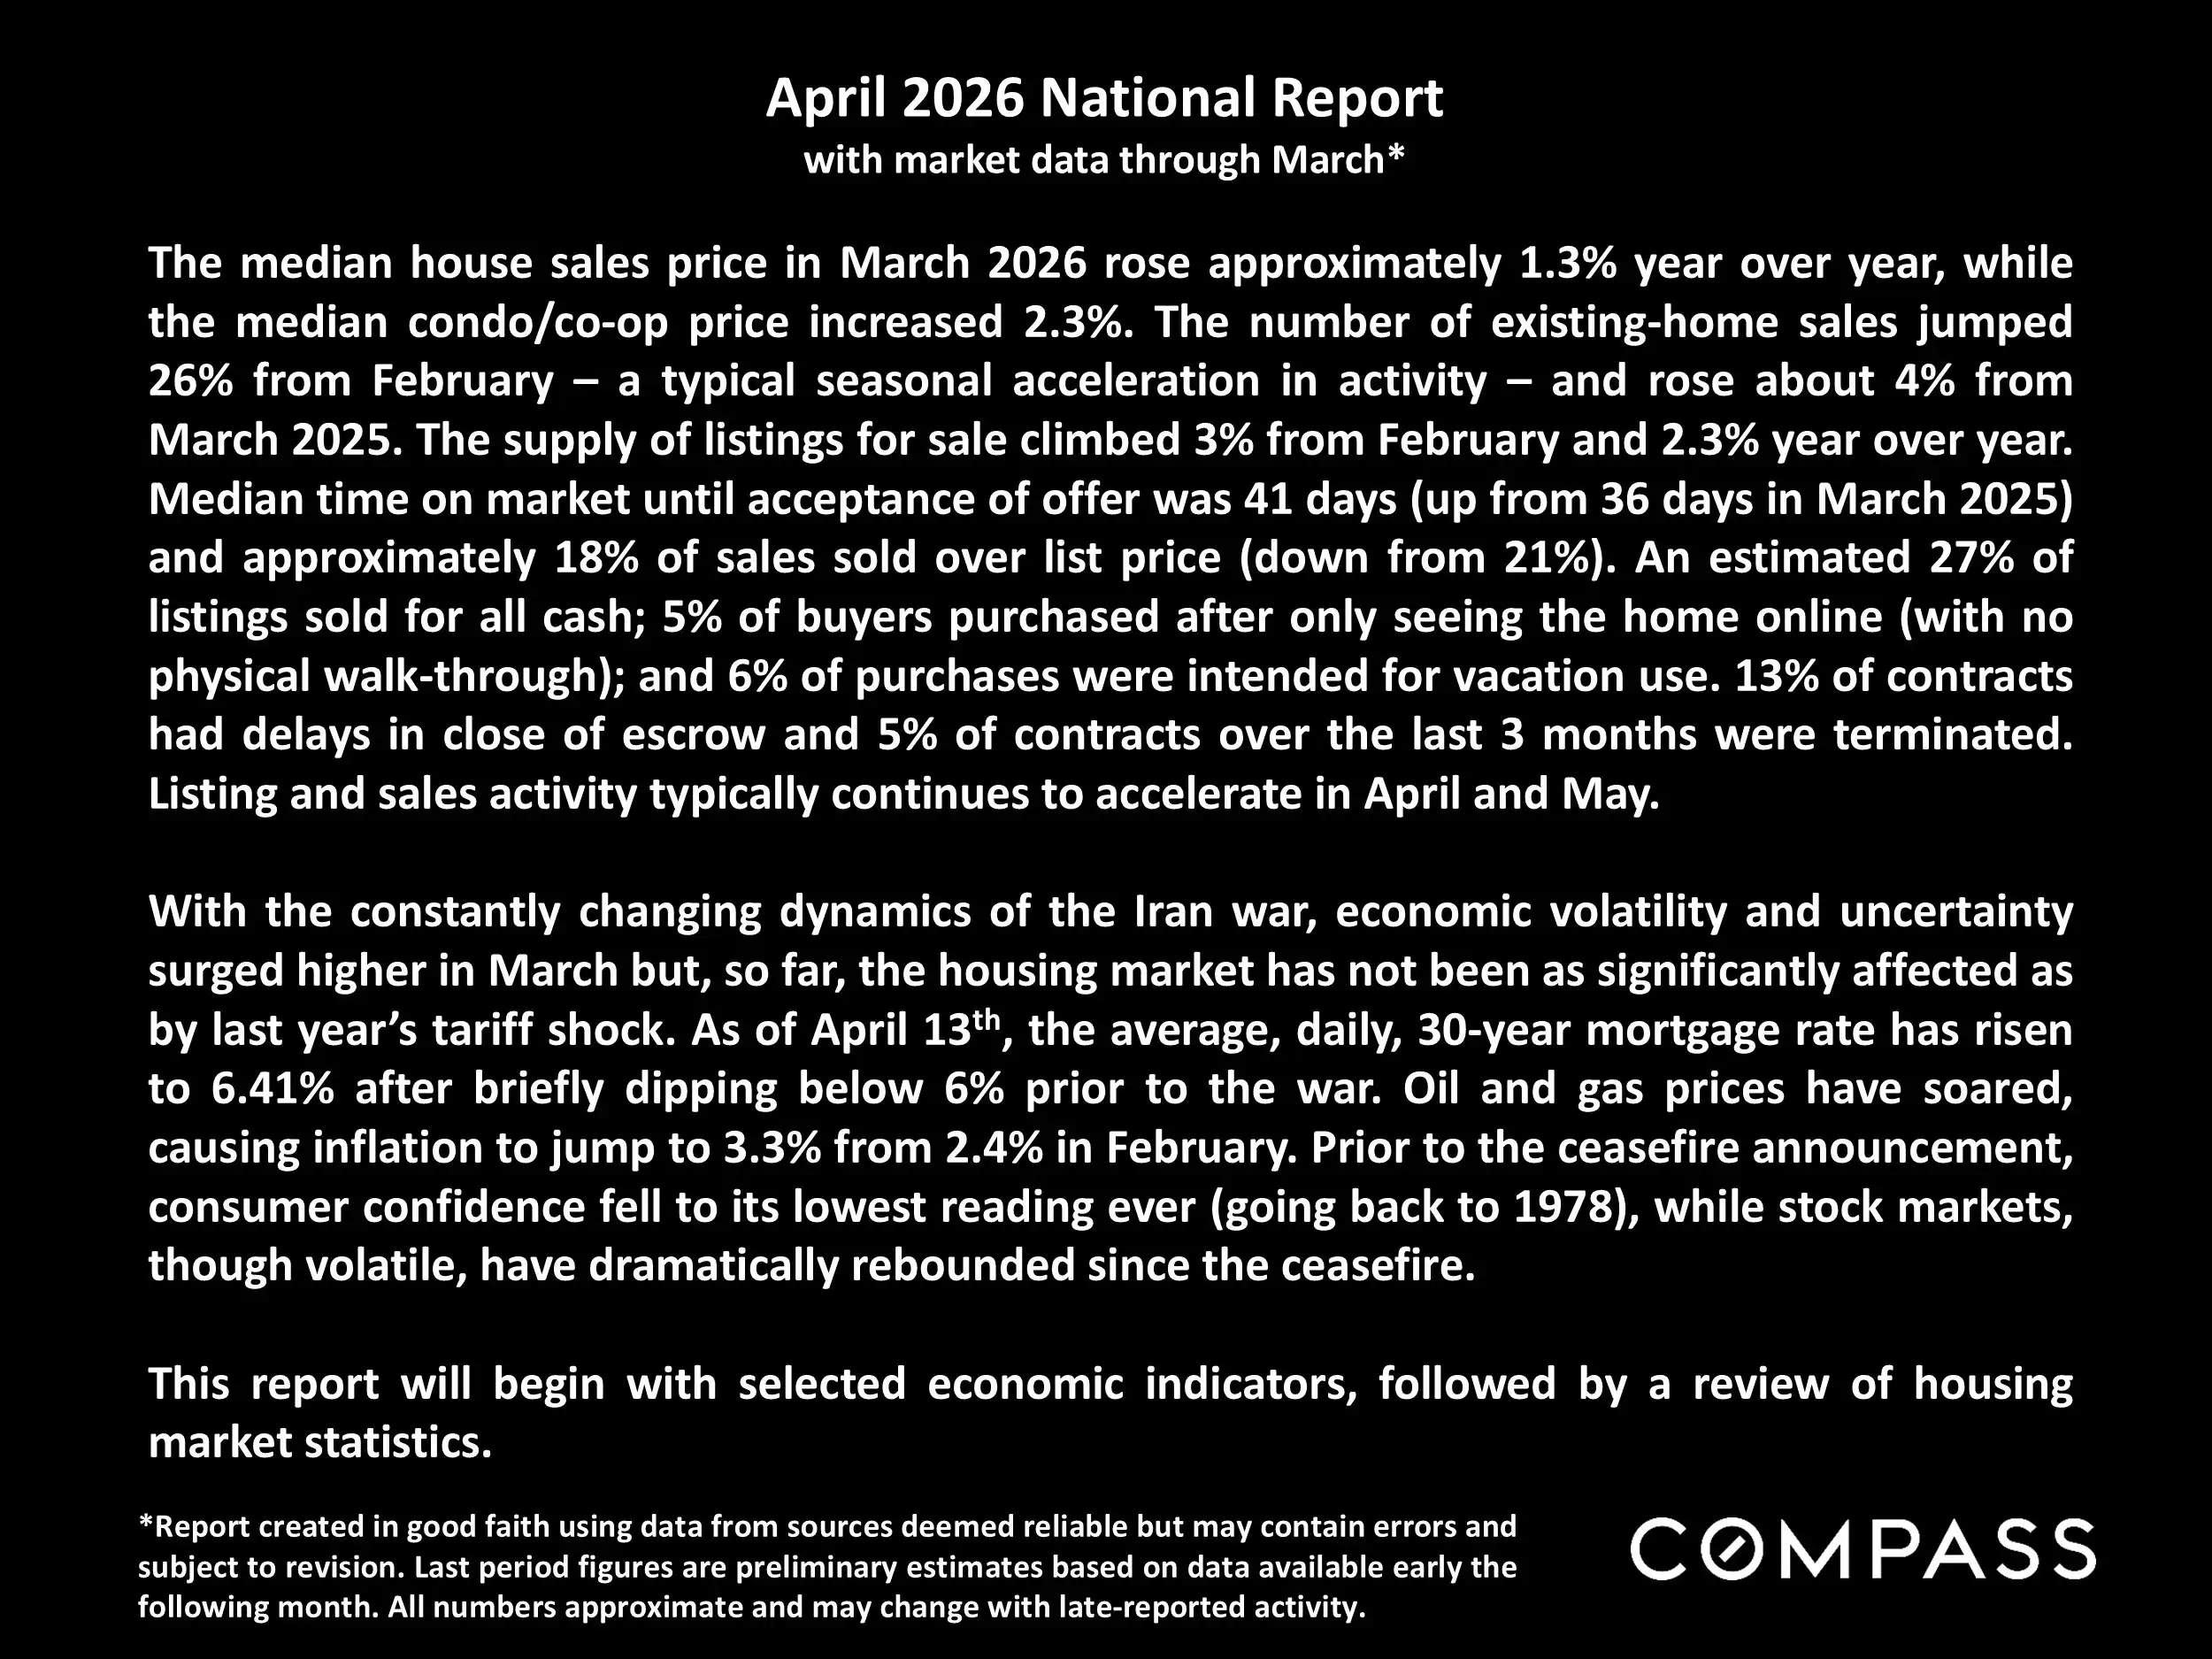
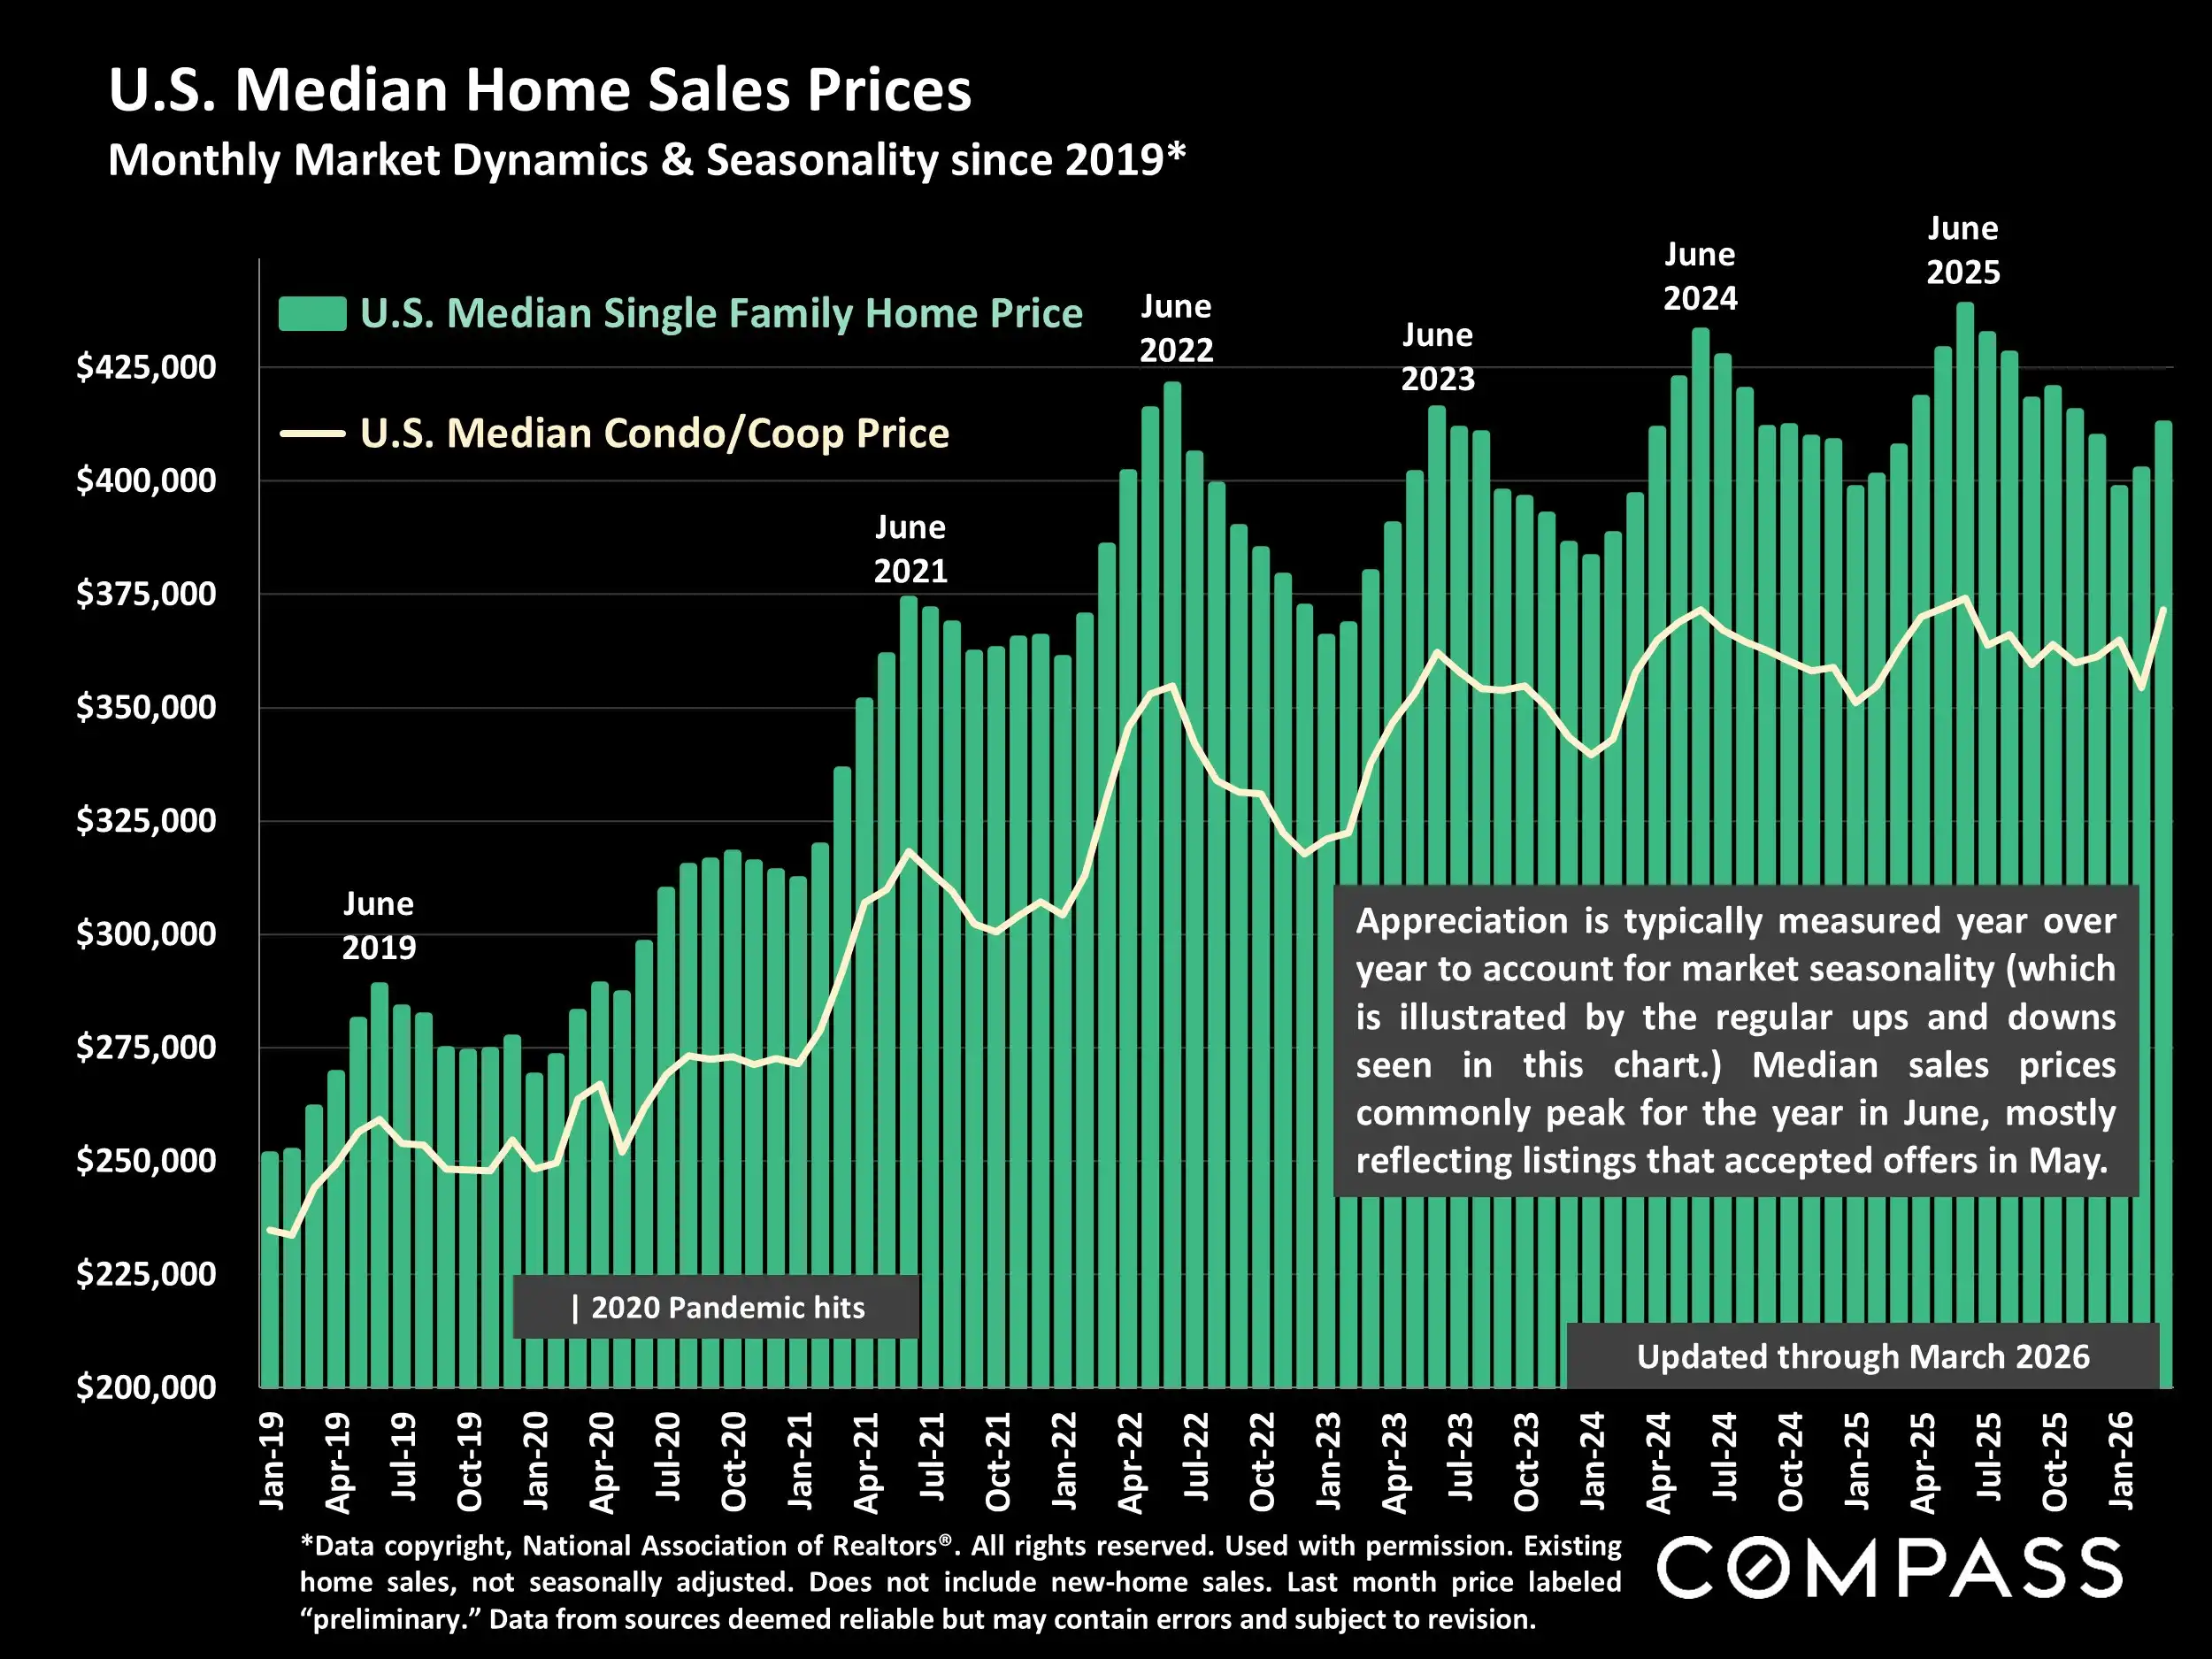
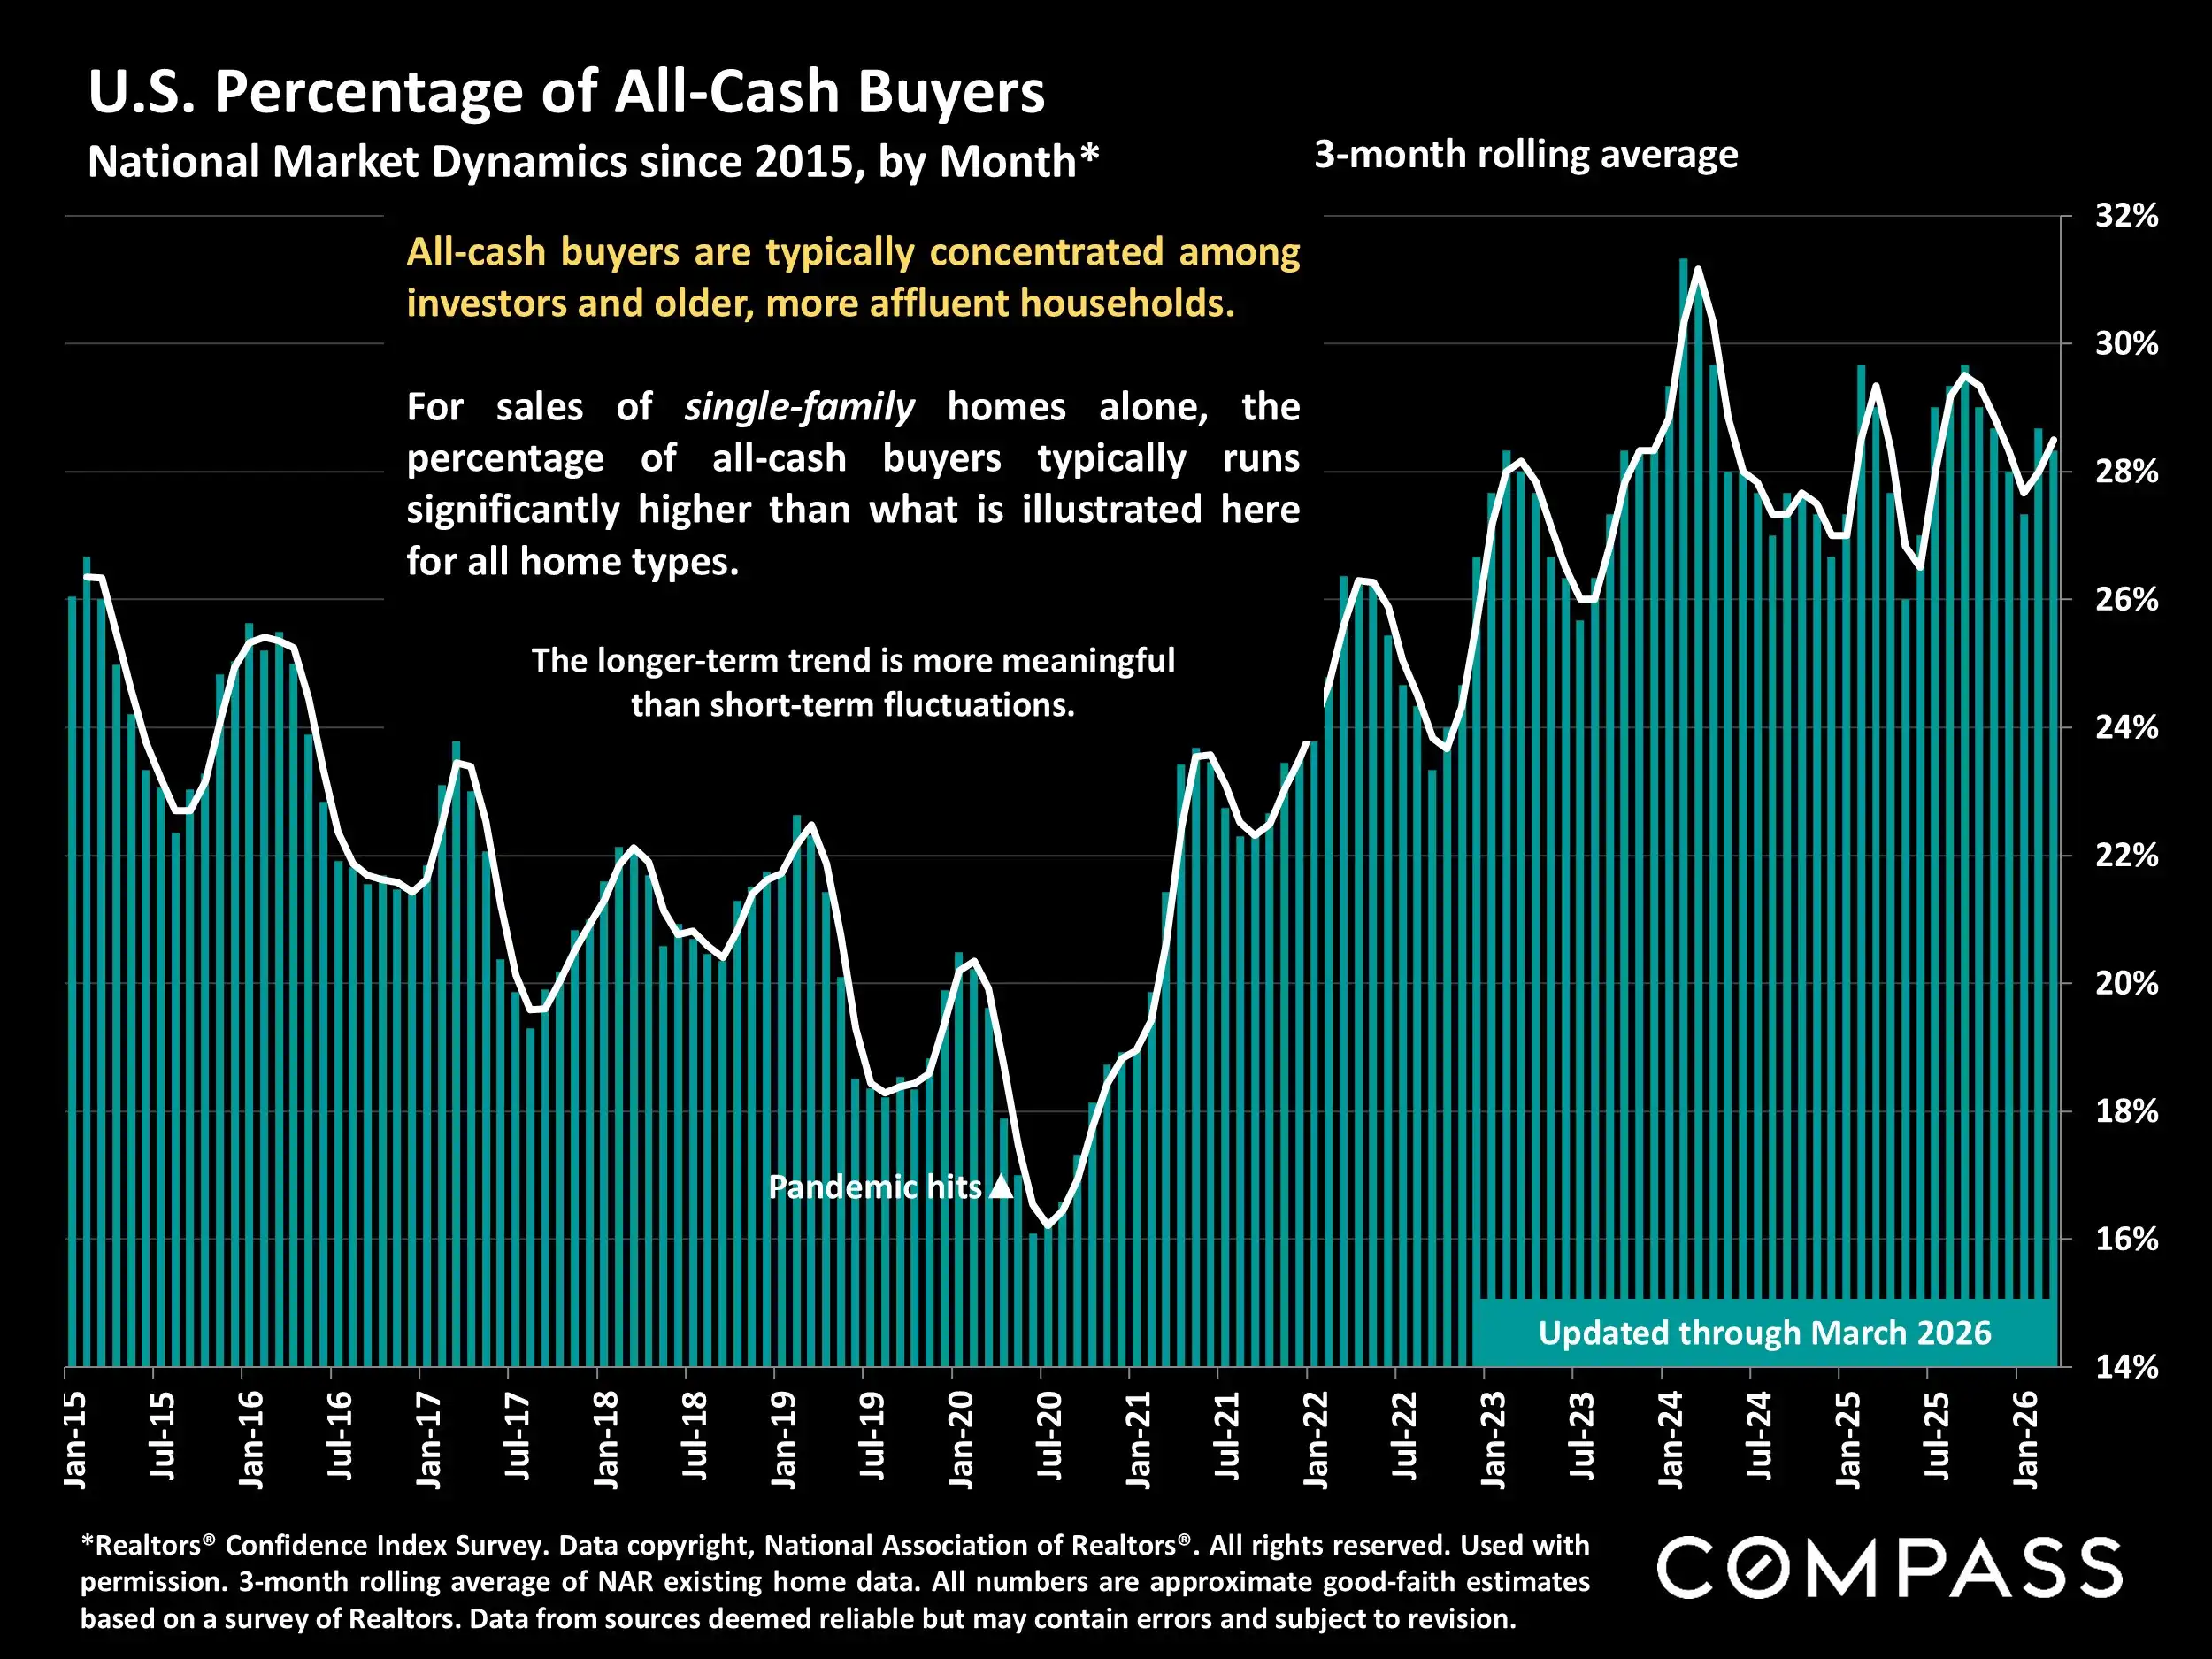
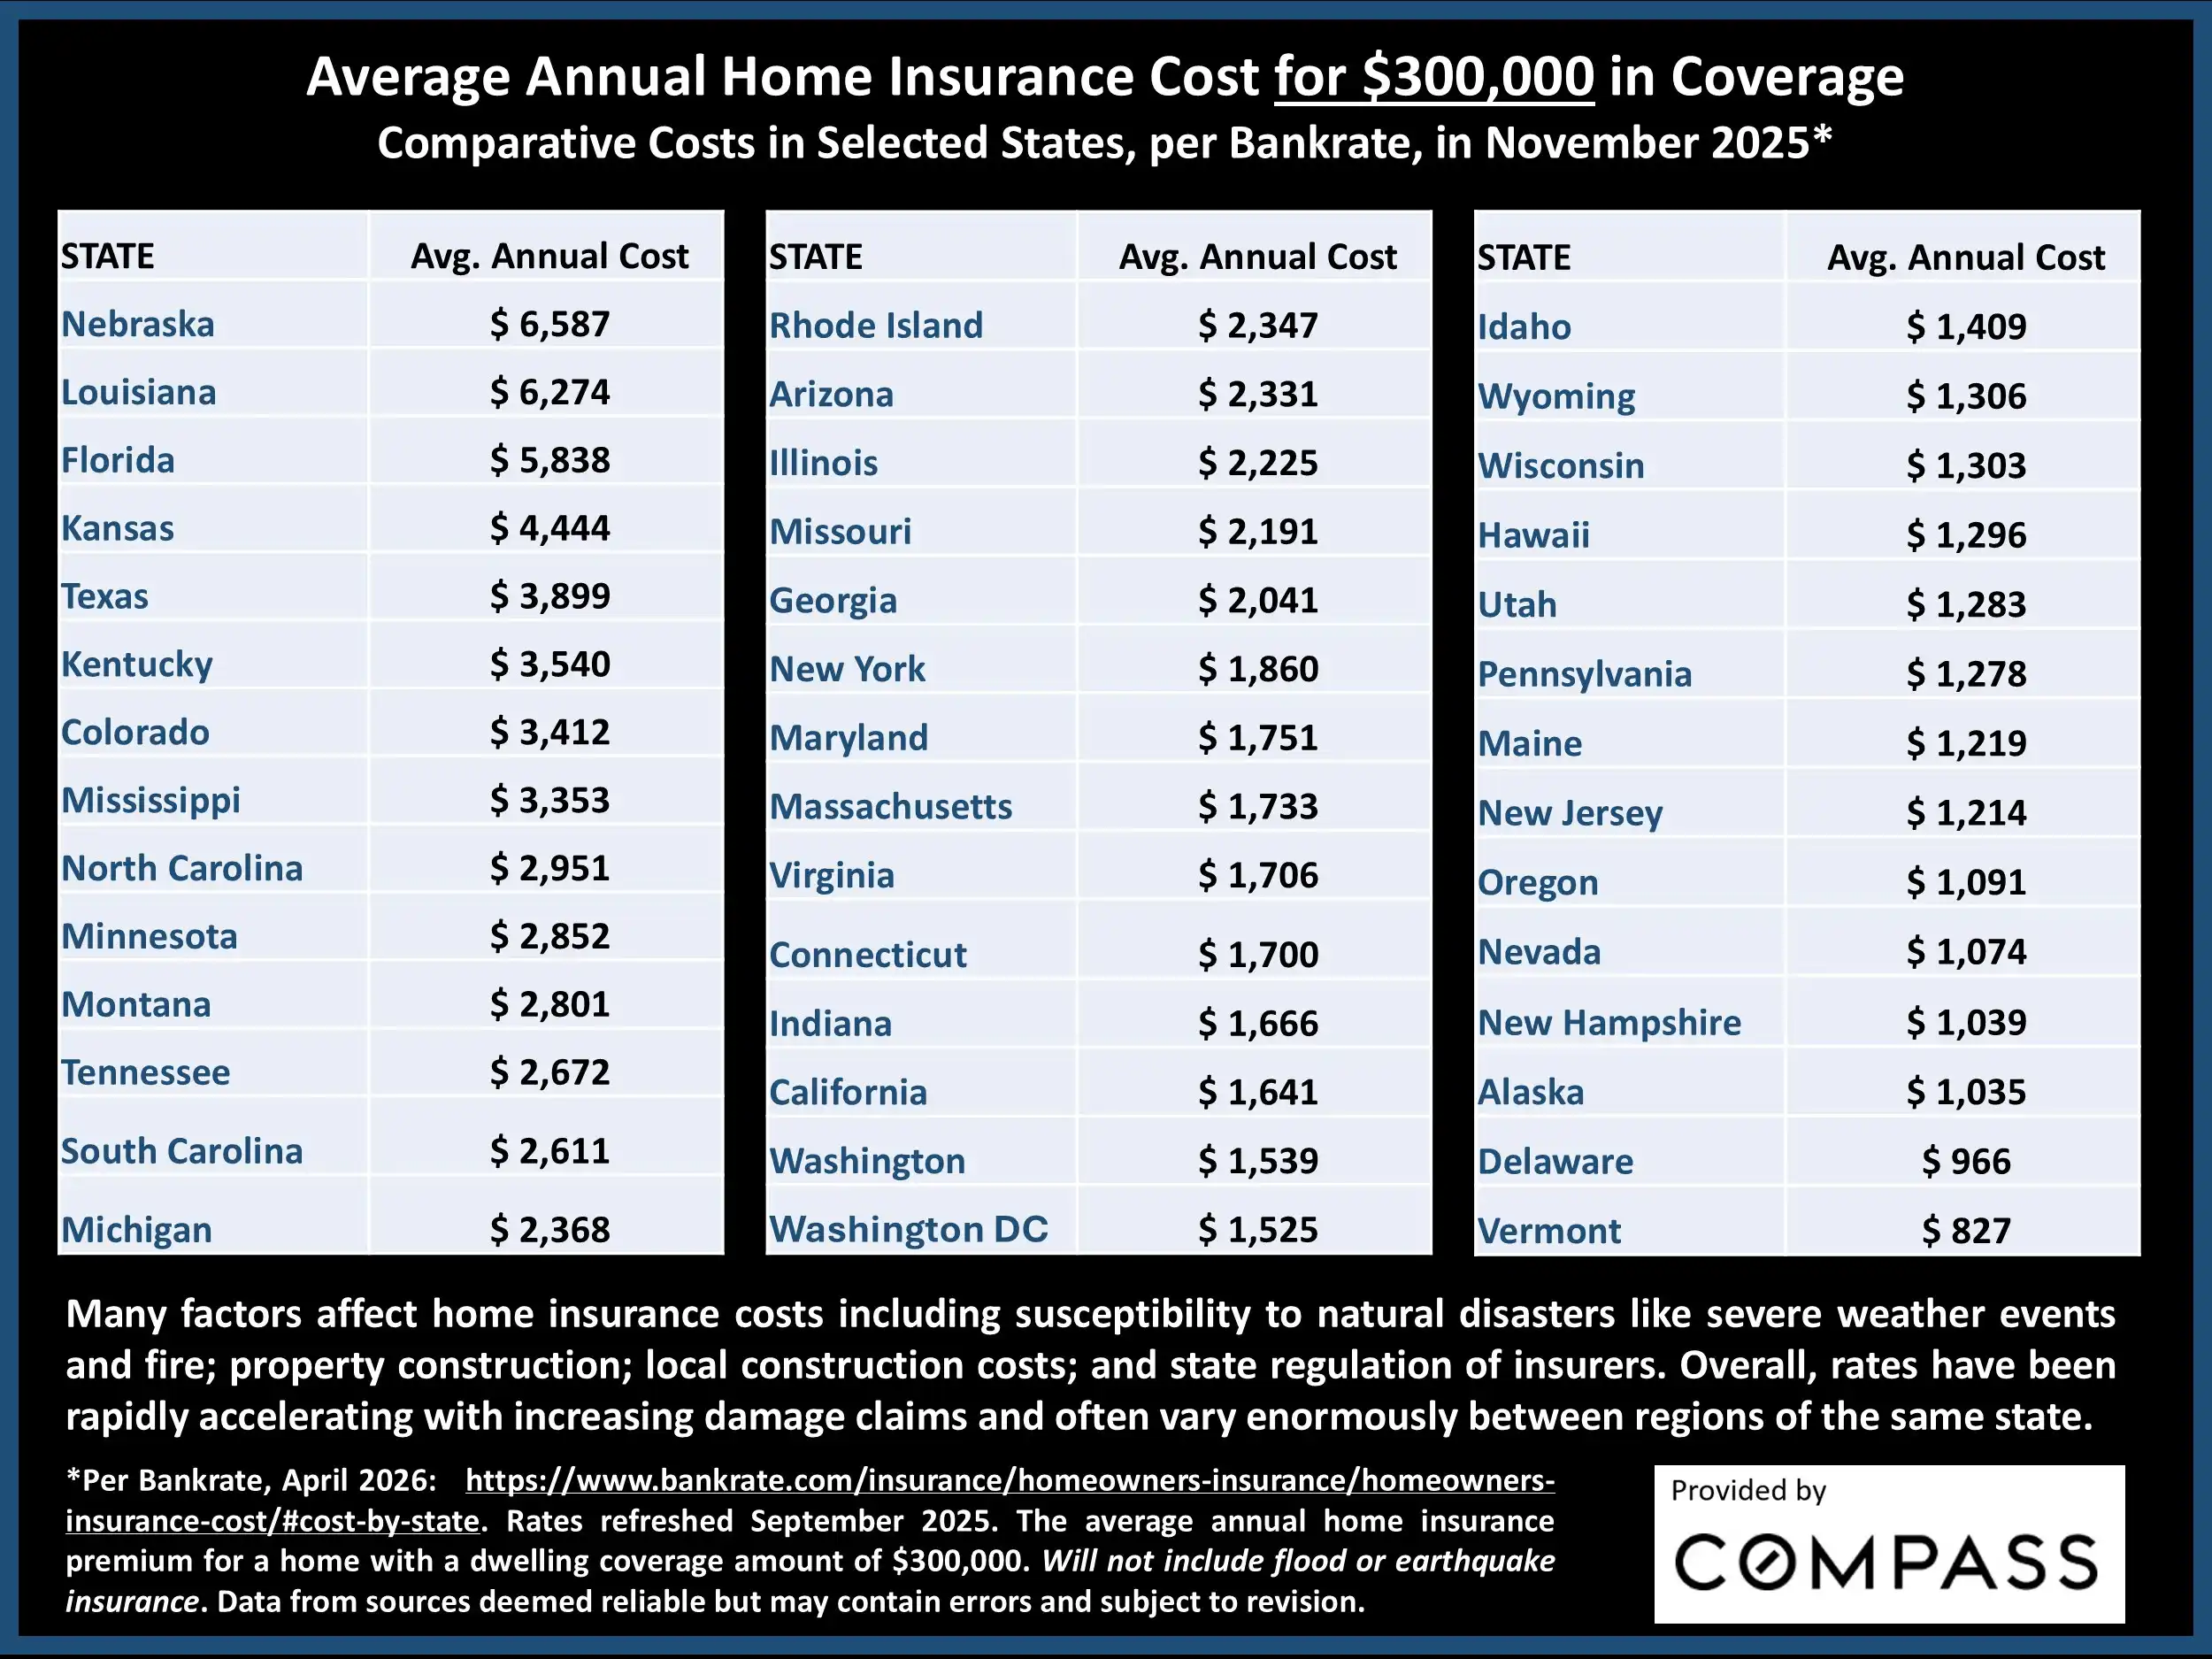
The April 2026 report shows a national housing market that remains active despite higher mortgage rates, inflation pressure, insurance costs, and ongoing affordability concerns. March data reflected modest year-over-year price growth, rising inventory, a seasonal increase in sales activity, and continued strength from cash buyers.
Market at a Glance
Home Prices: Median house prices rose approximately 1.3% year over year.
Condo/Co-op Prices: Median condo and co-op prices increased approximately 2.3% year over year.
Inventory: Active listings increased 3% from February.
Sales Activity: Existing-home sales rose 26% from February to March.
Market Time: Median time on market was 41 days.
Cash Buyers: Approximately 27% of March sales were all cash.
Key Takeaway
Buyers are seeing more options than they had during the tightest years of the market, but monthly ownership costs still matter. Mortgage rates, insurance premiums, HOA fees, and property conditions should all be considered carefully.
For sellers, rising inventory makes accurate pricing, strong preparation, and clear positioning especially important. Homes that are priced appropriately and presented well are more likely to stand out as buyers compare more choices.
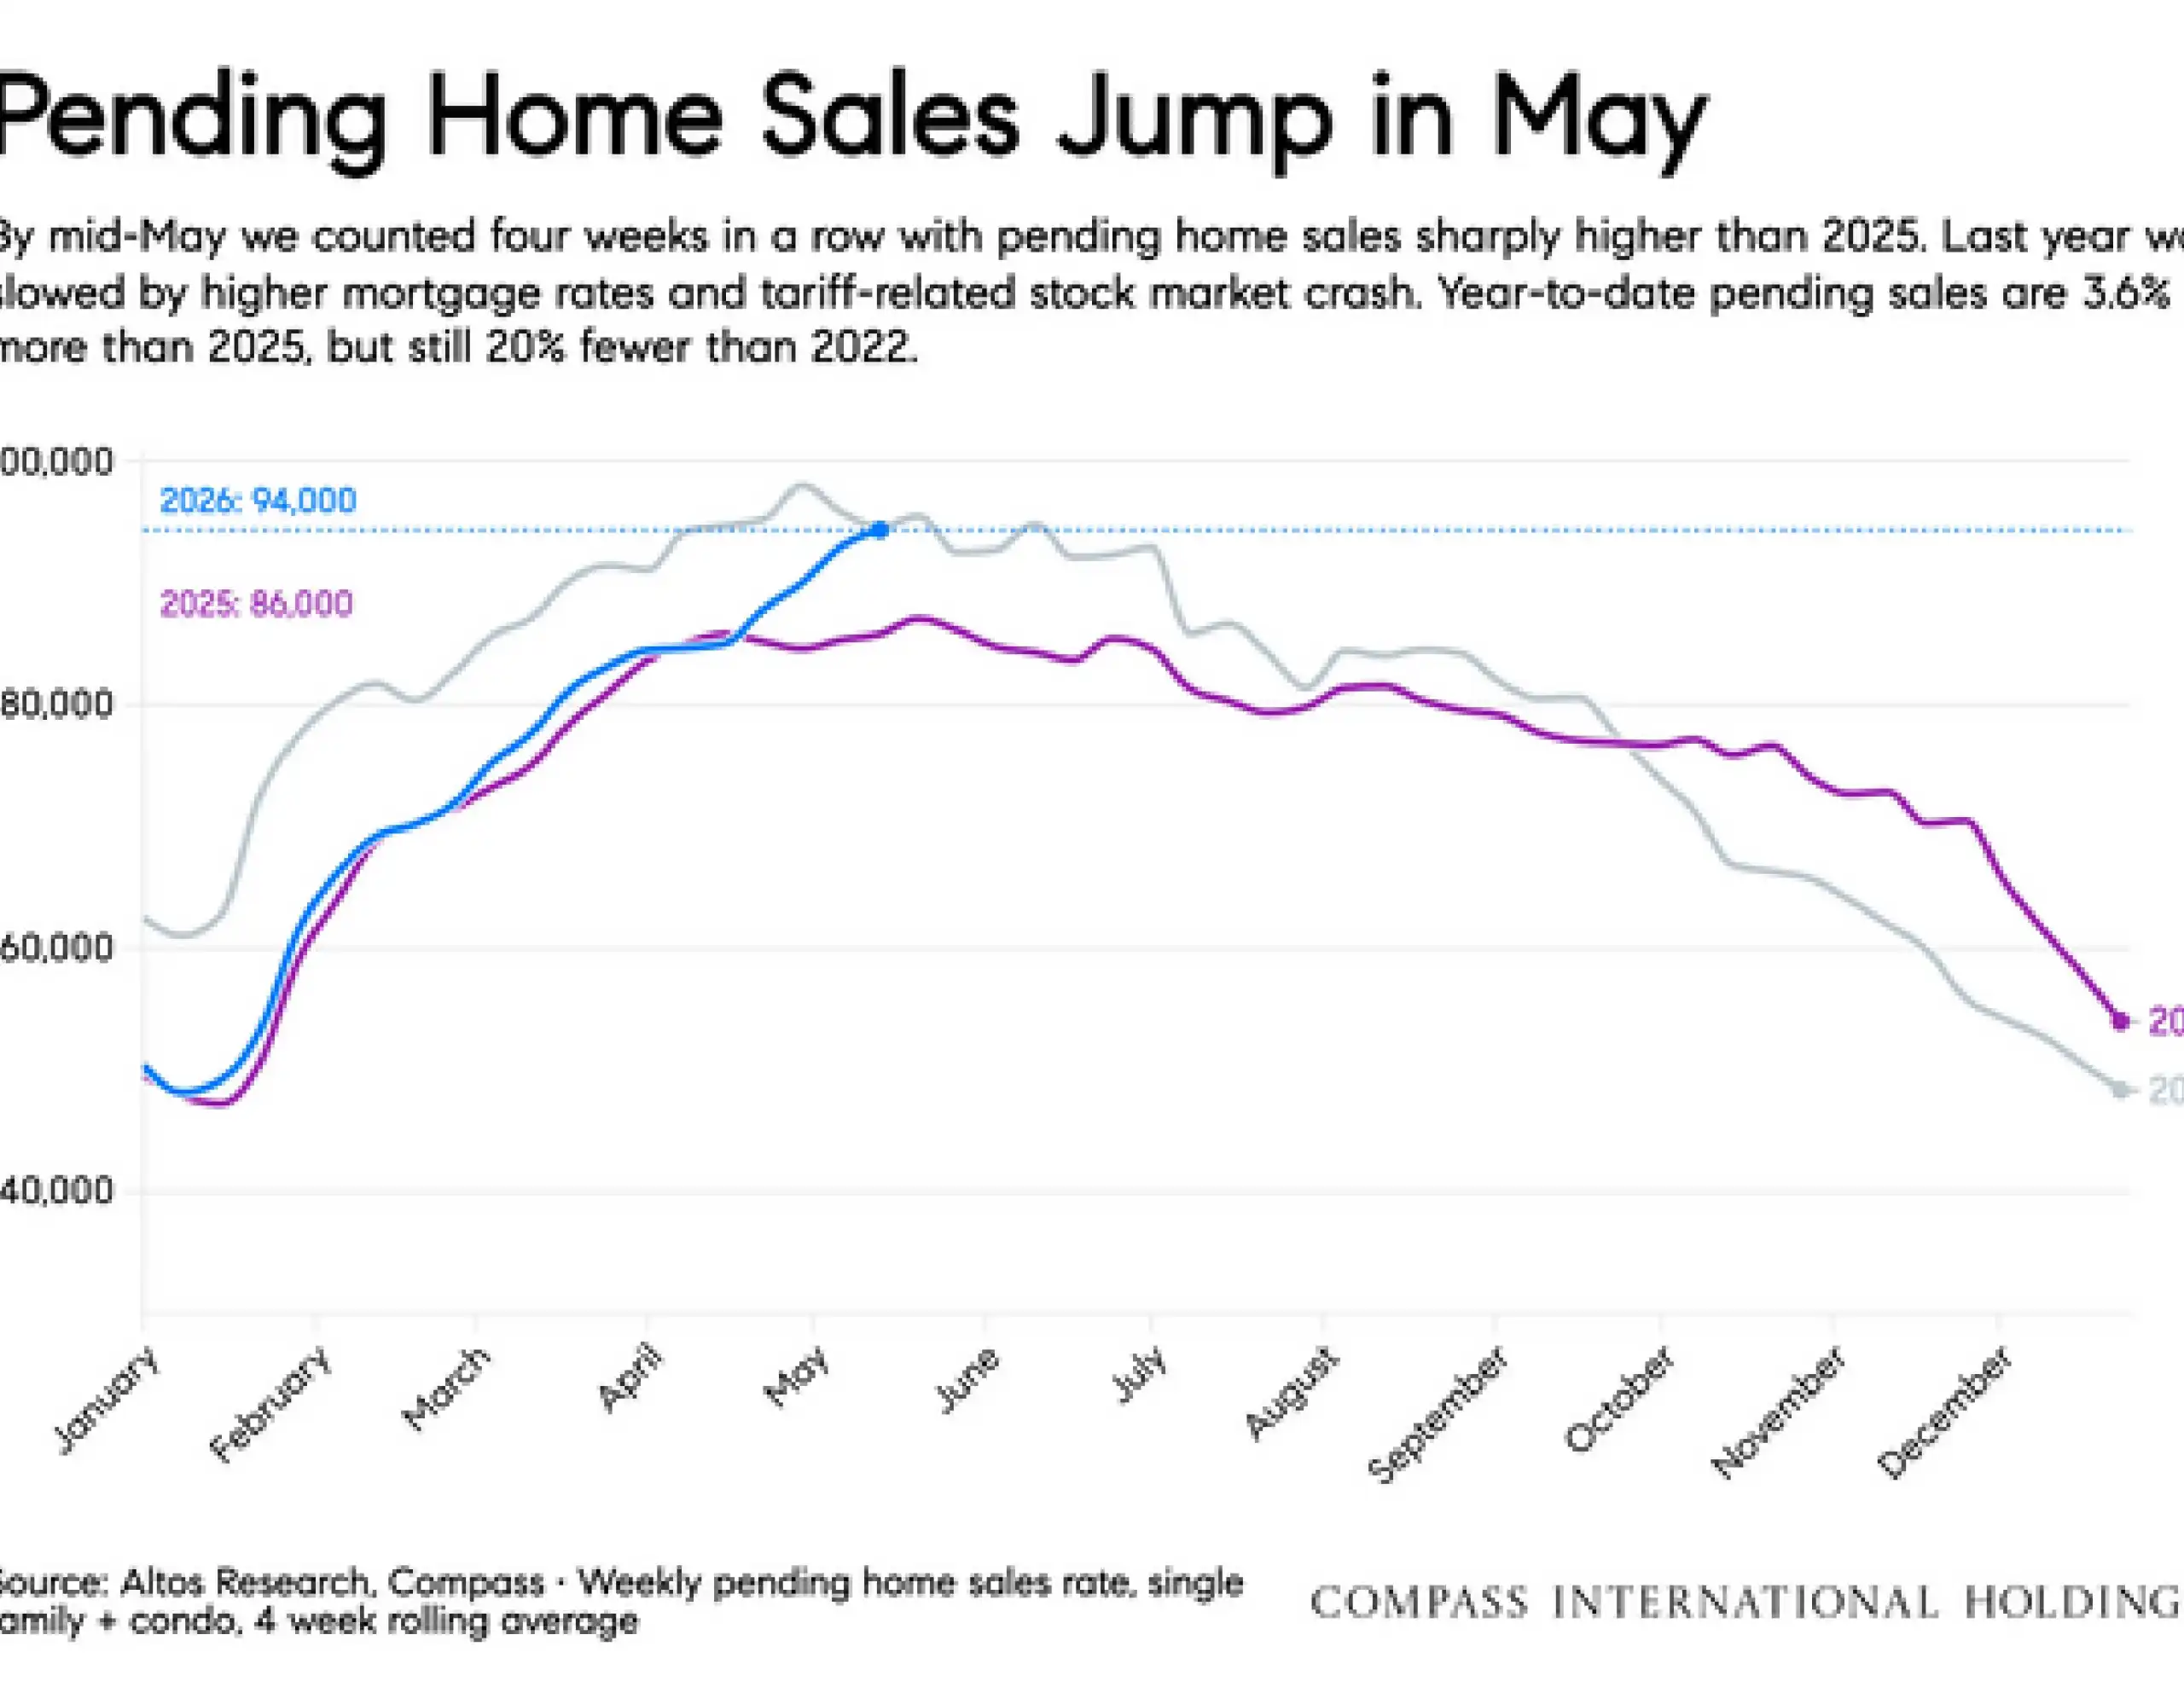
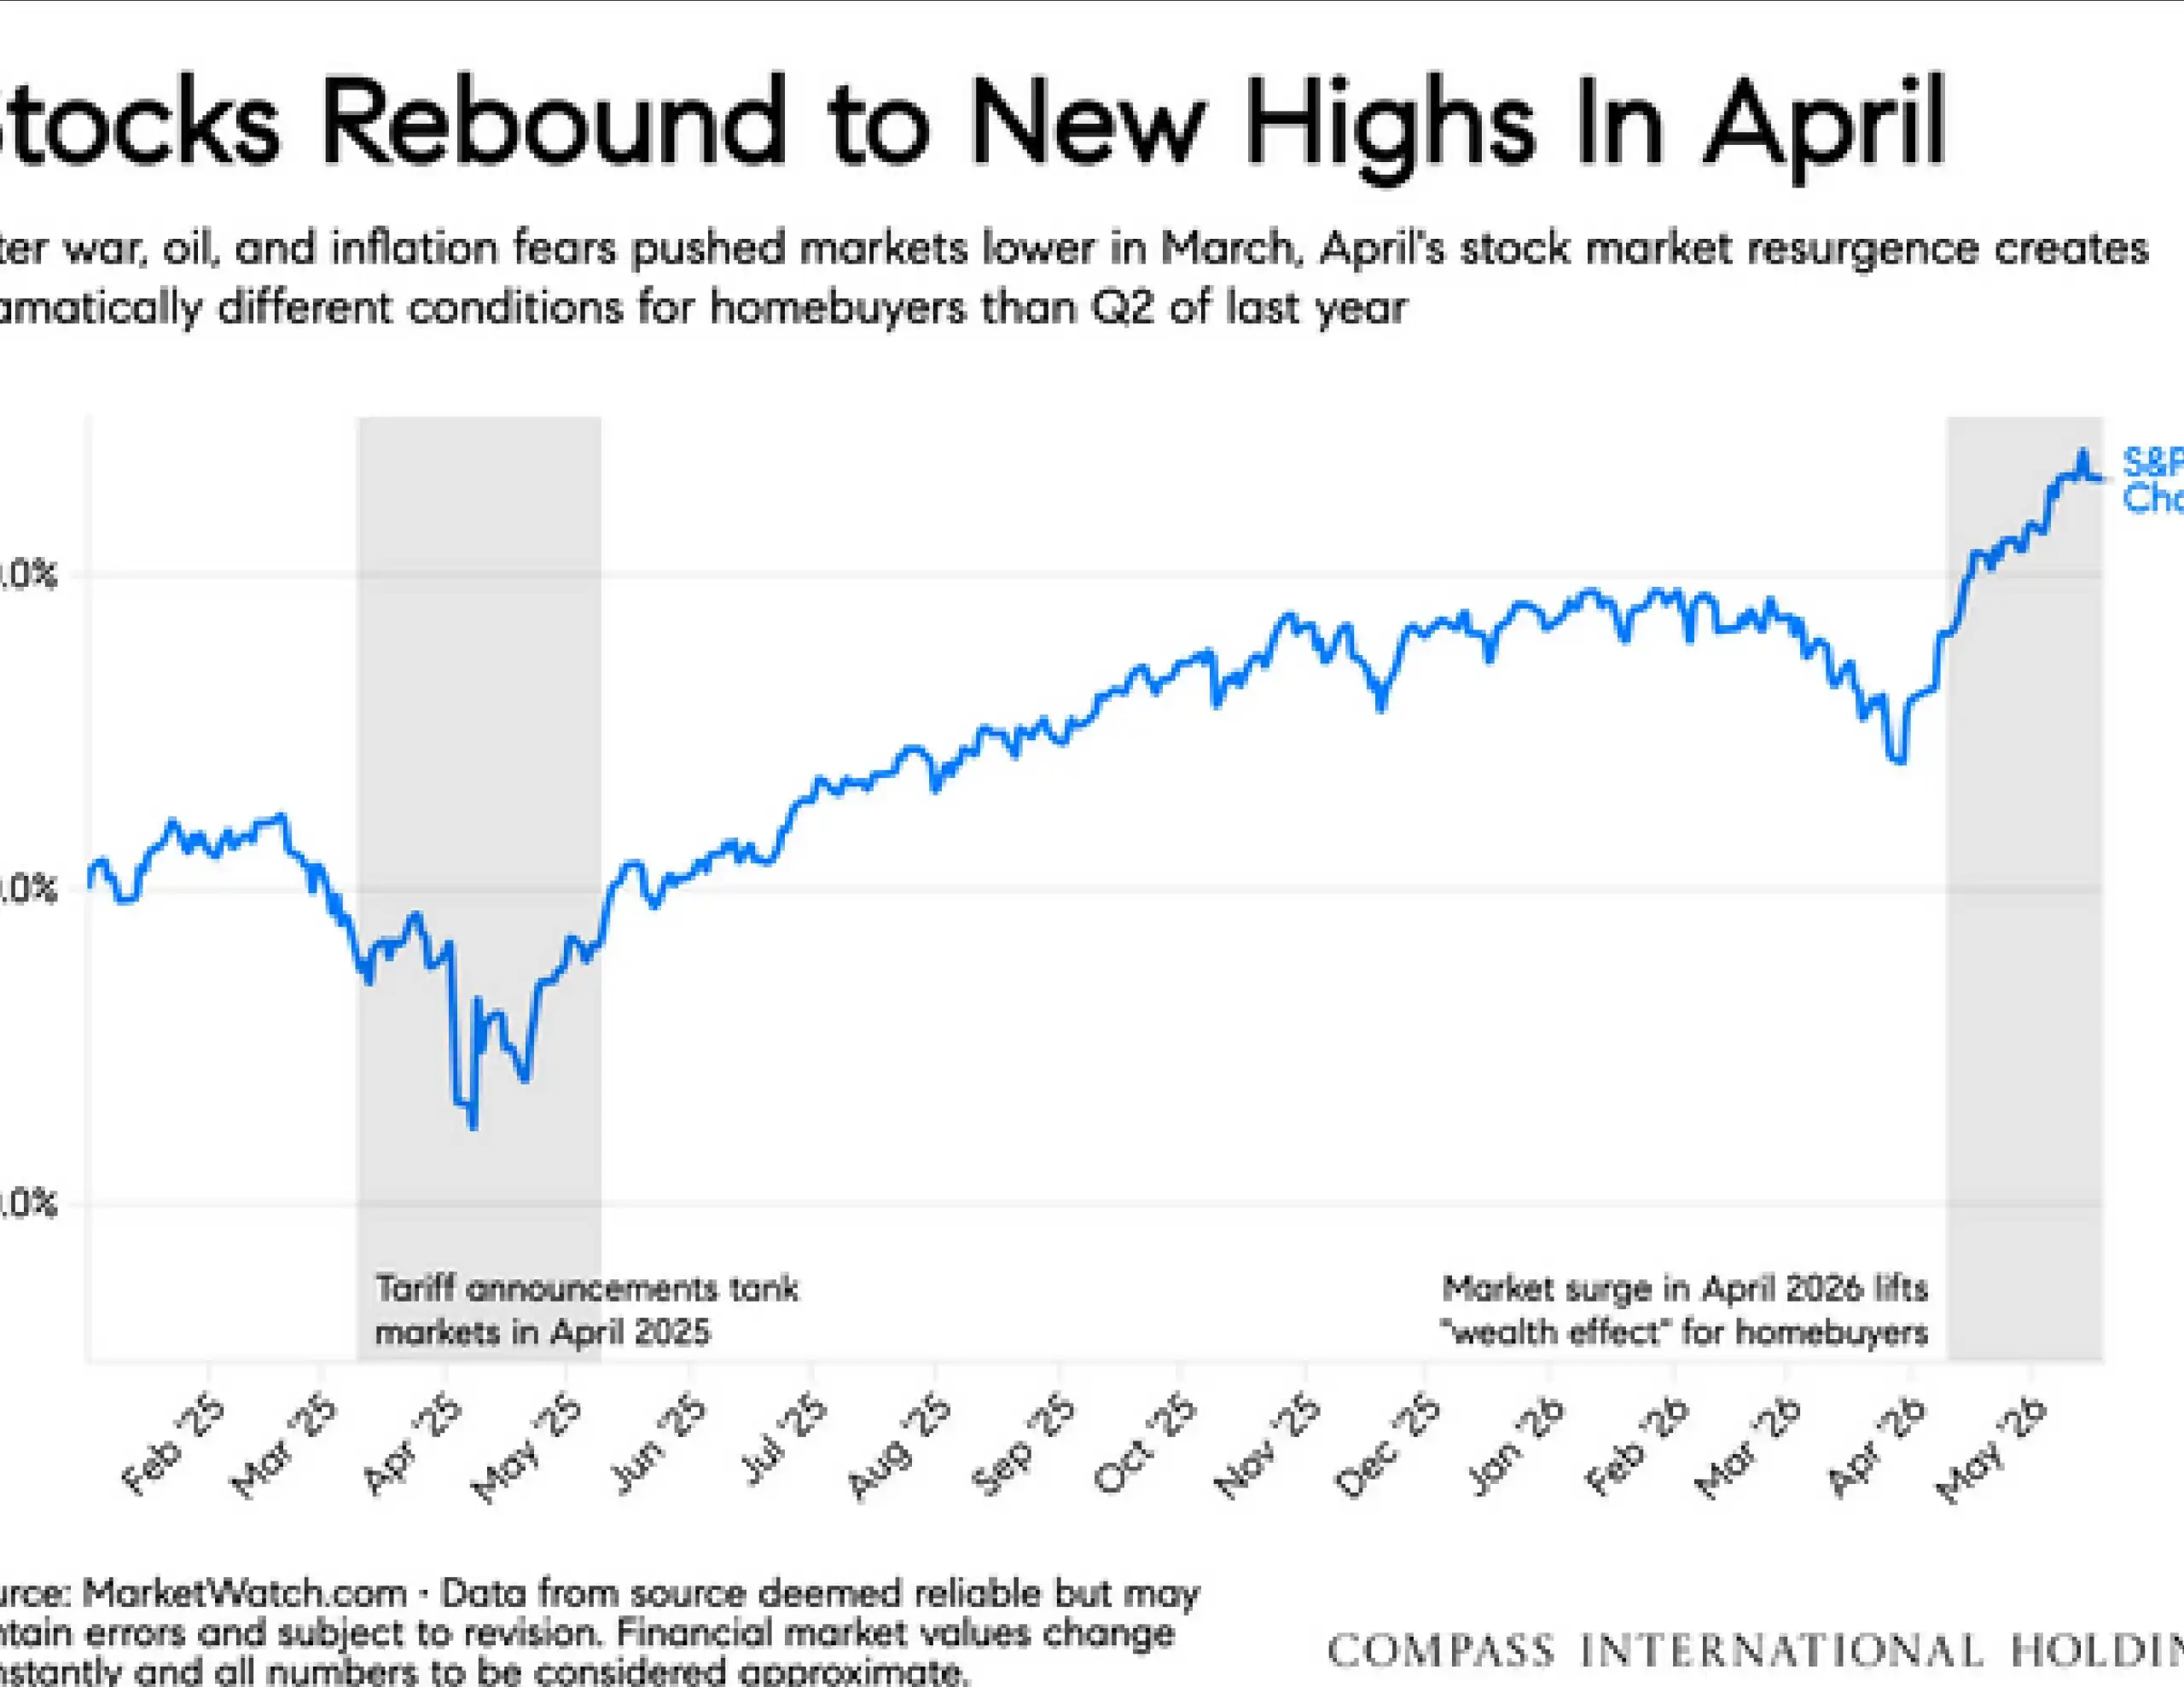
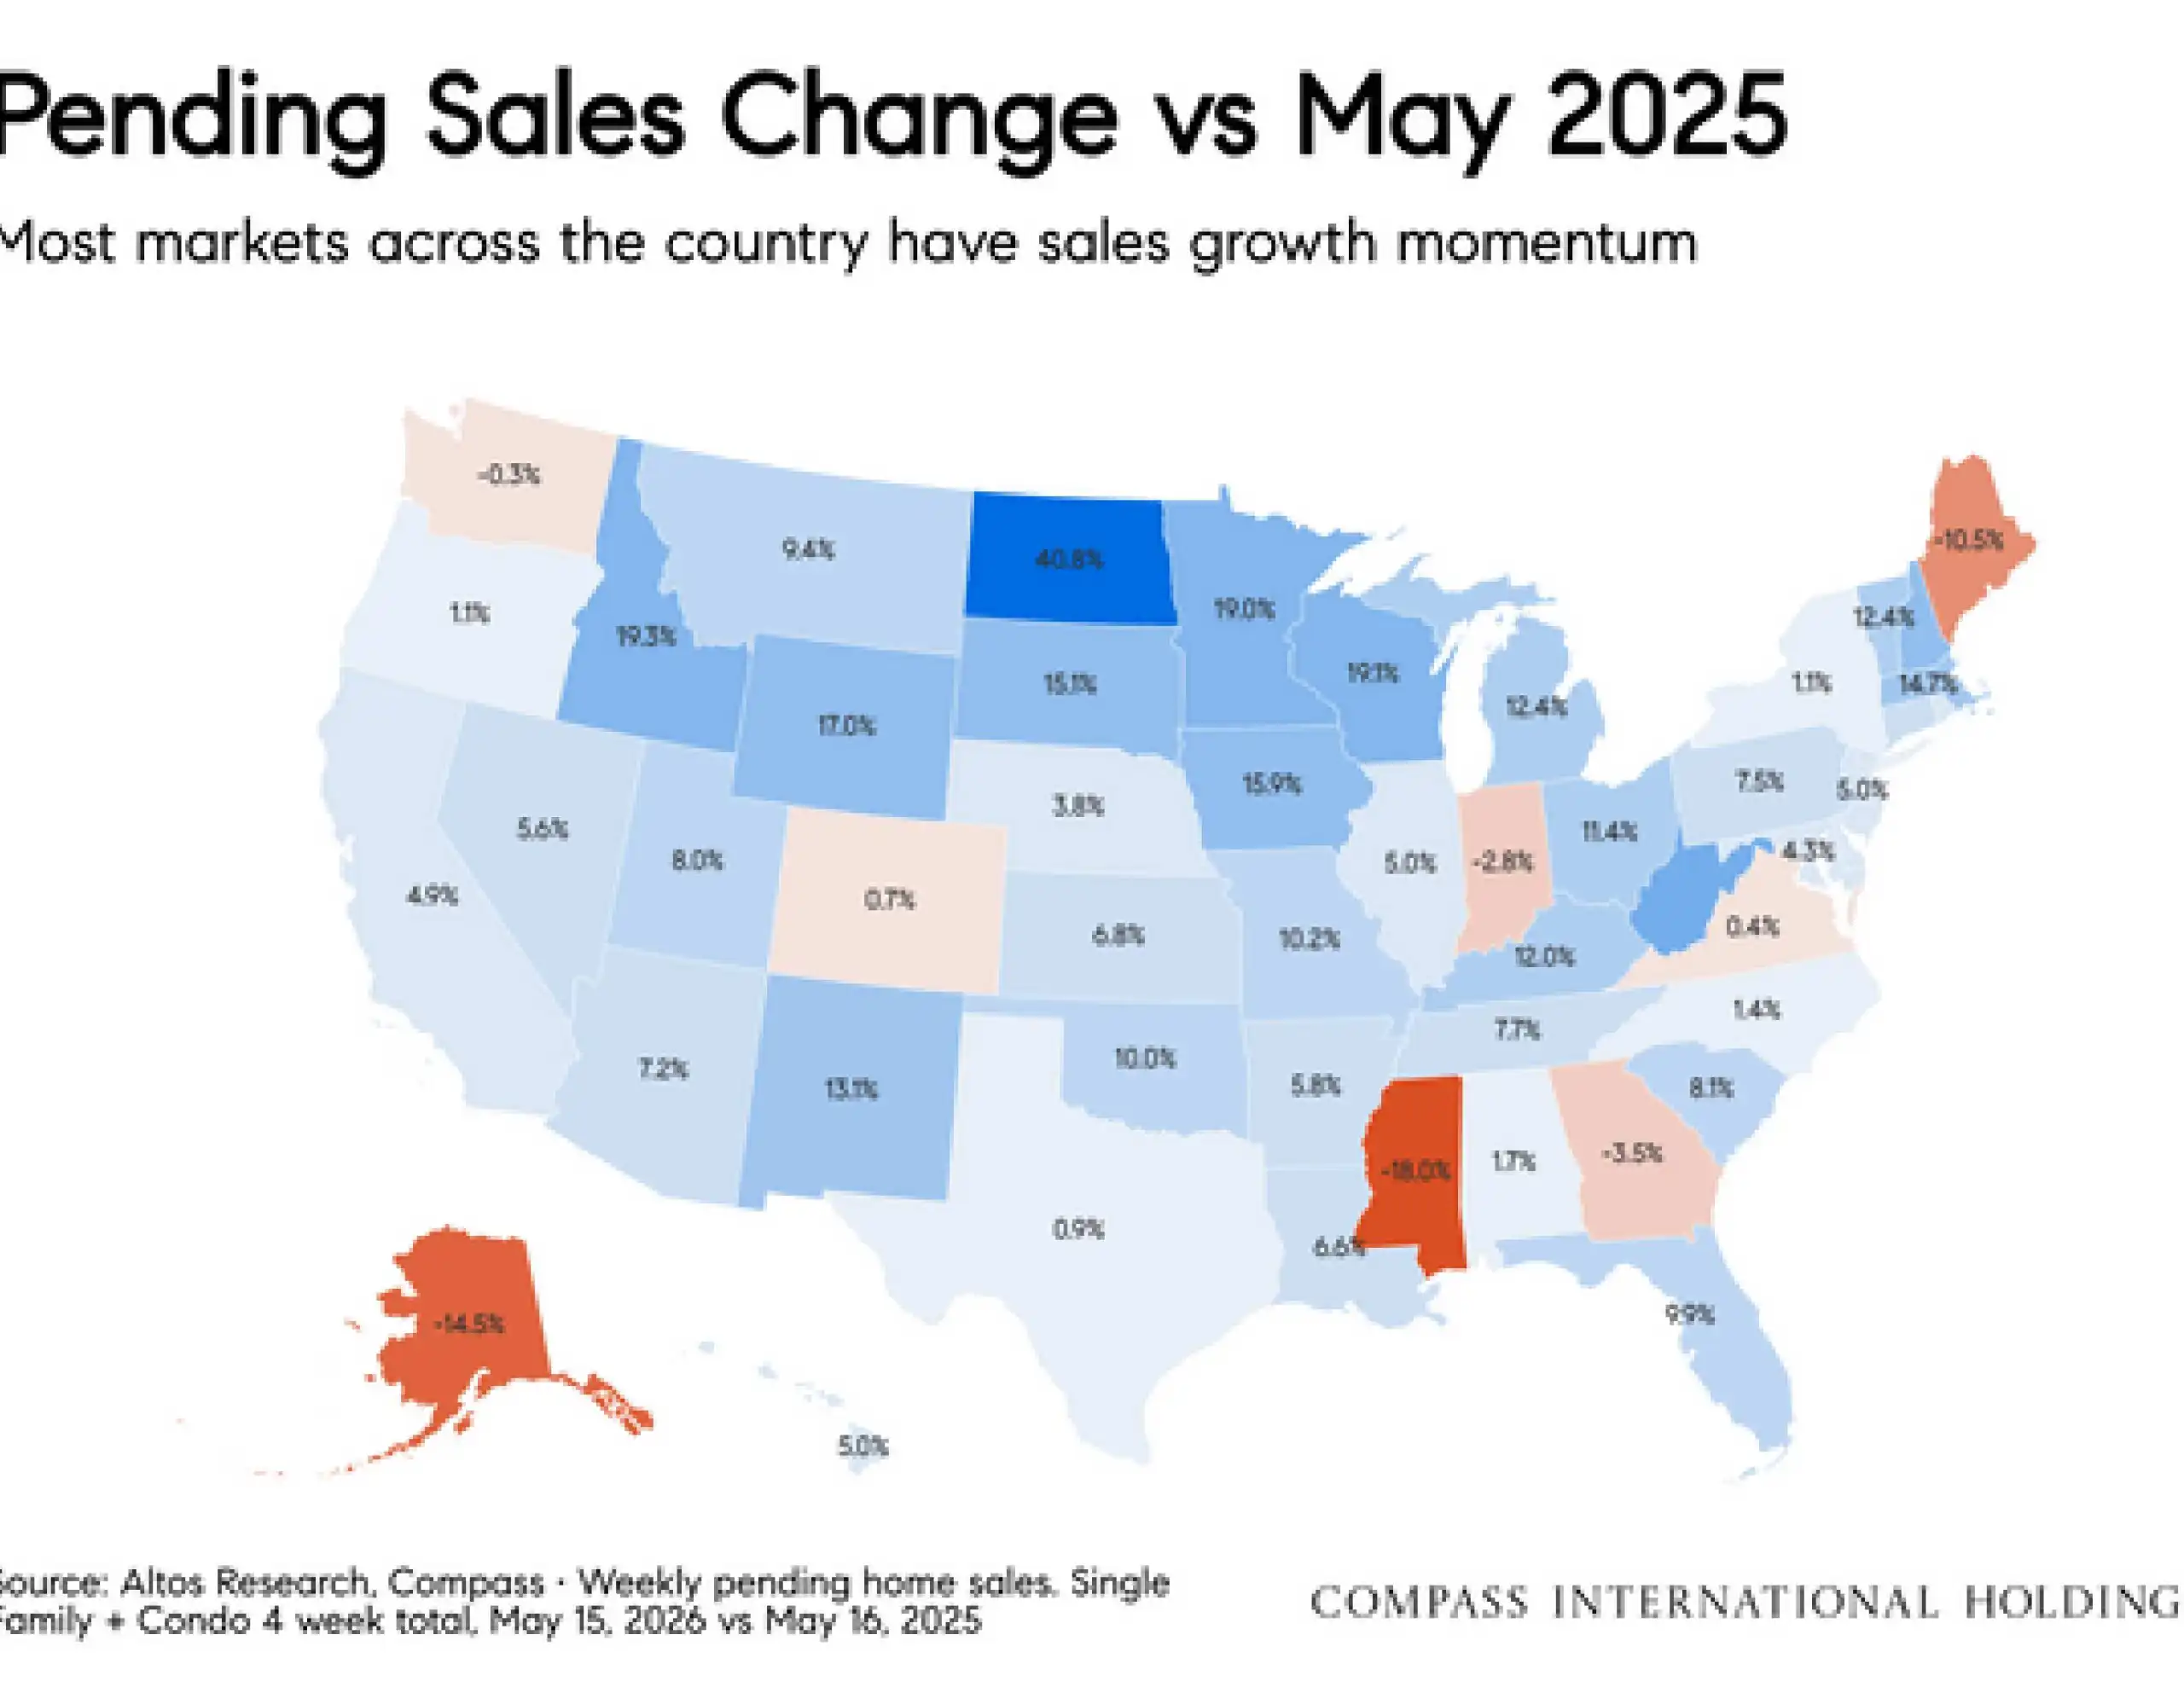
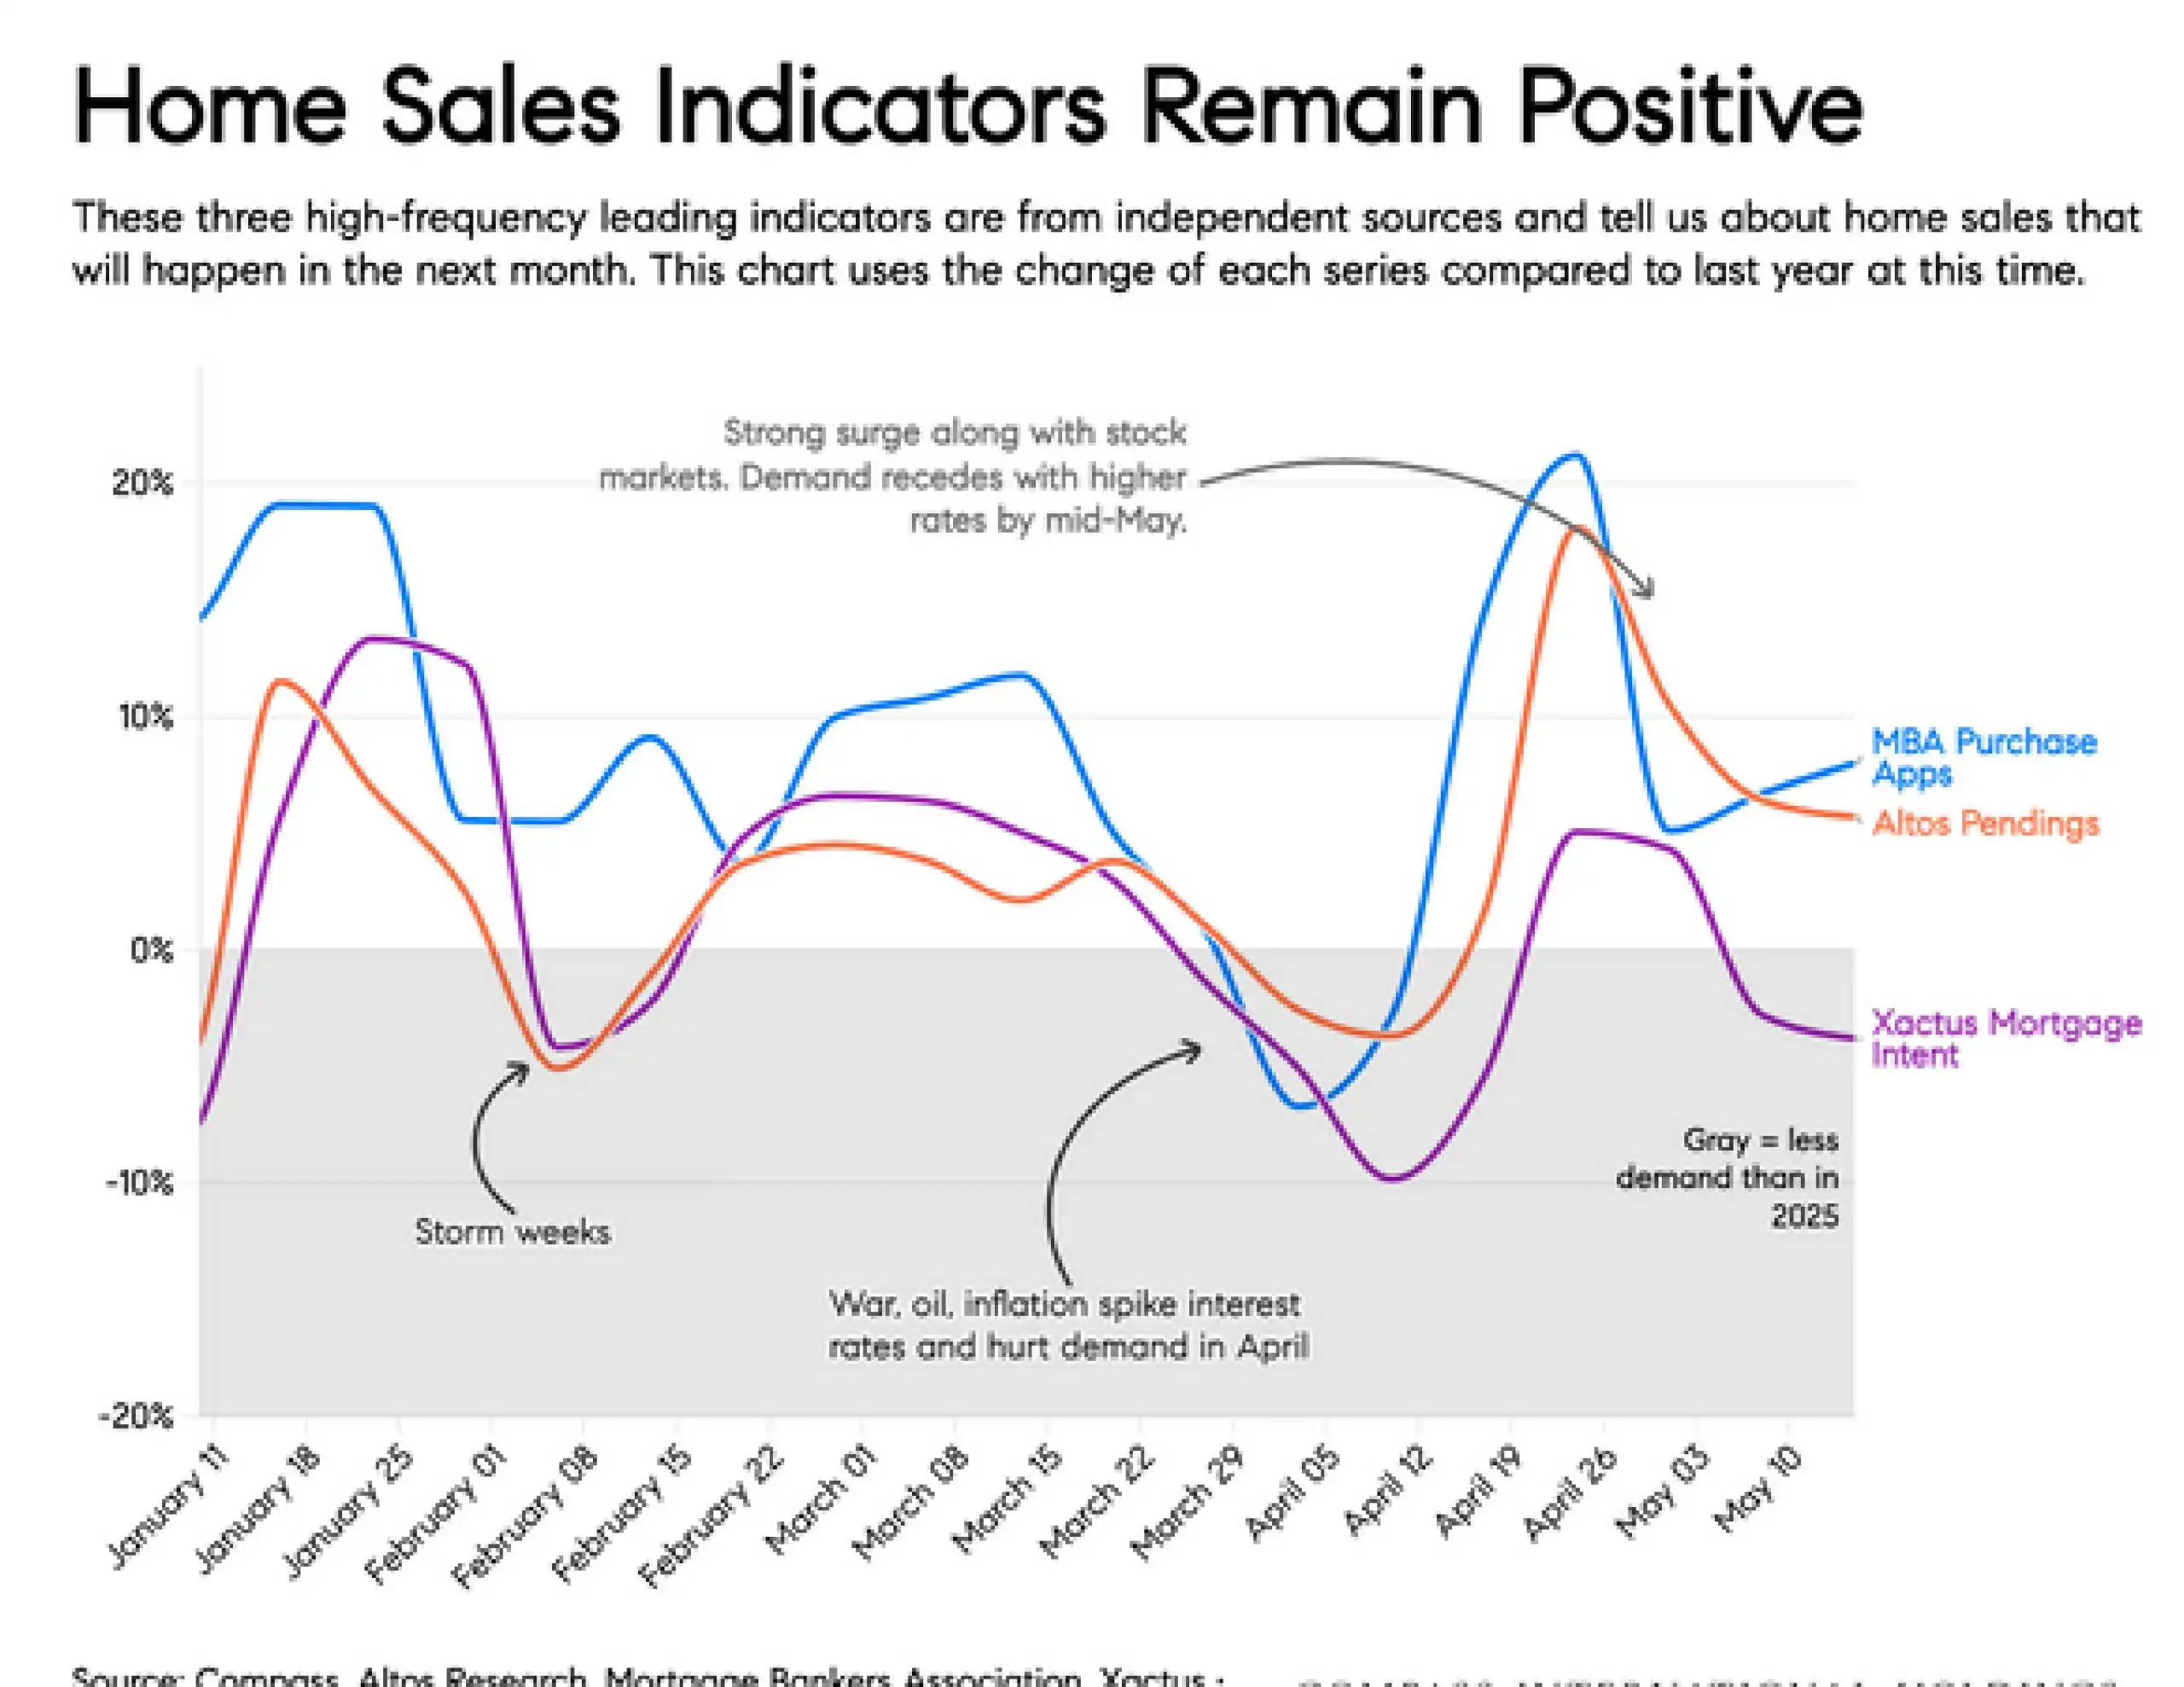
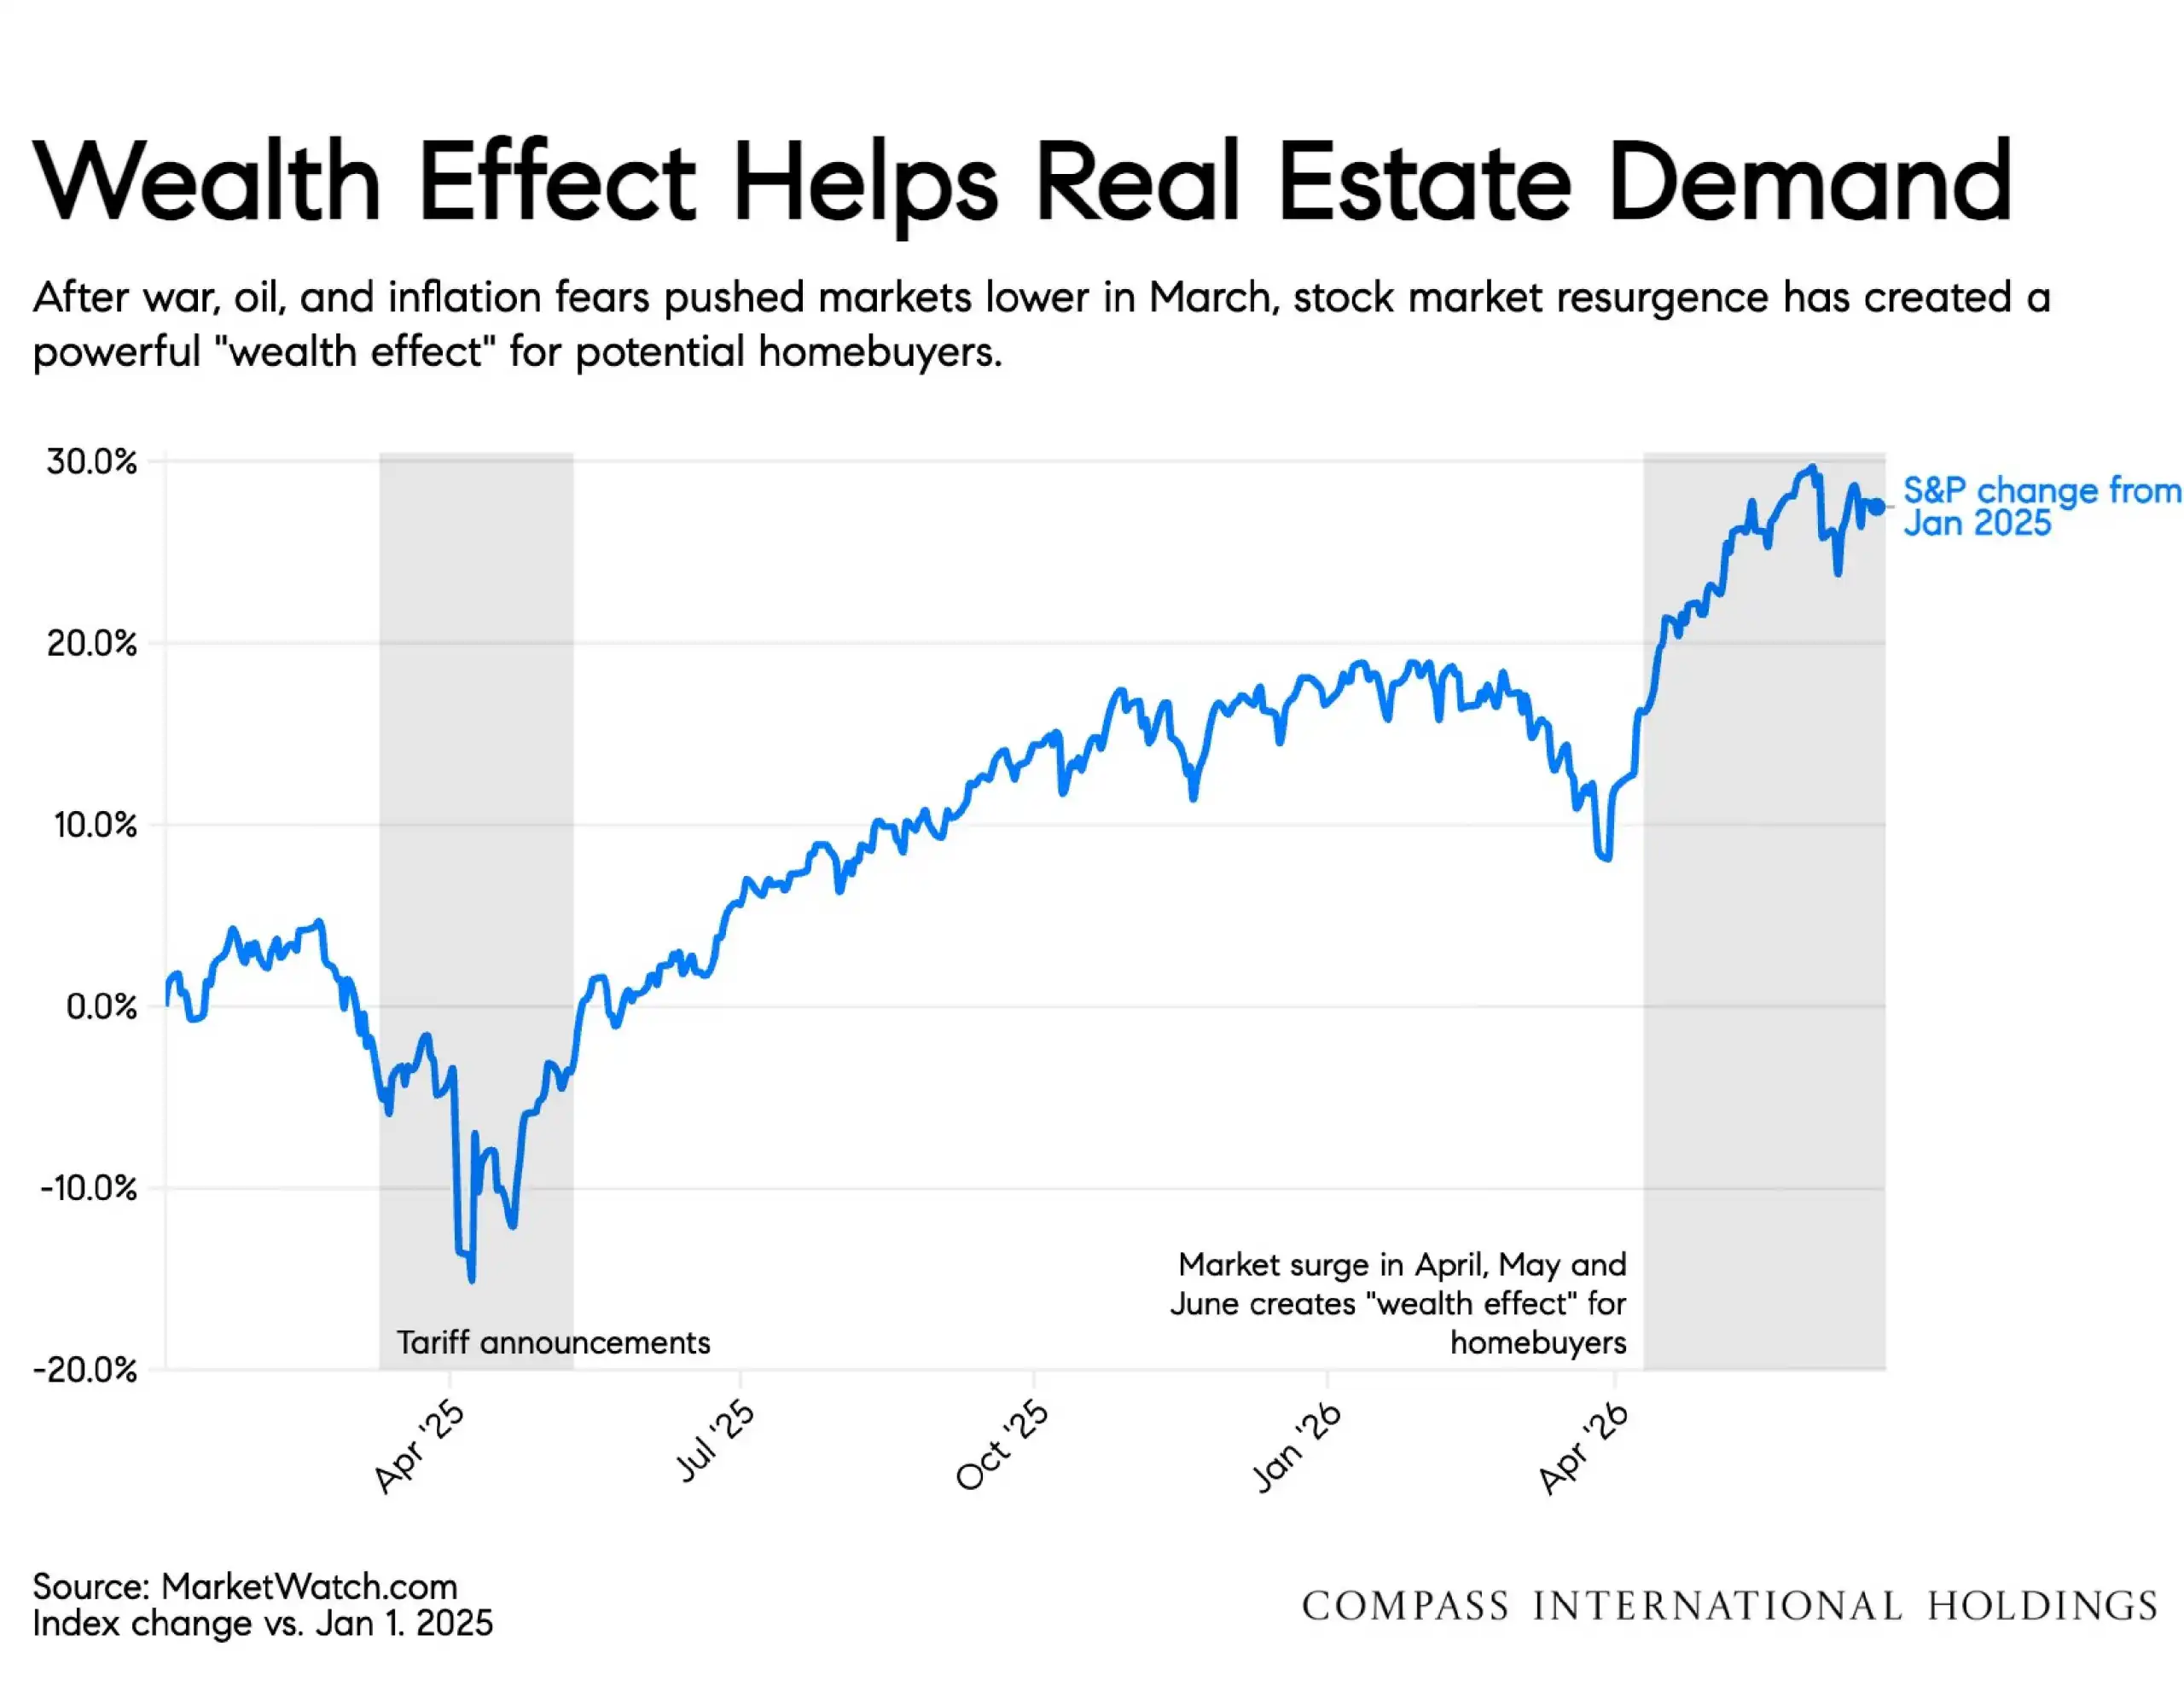
The May 2026 national housing market showed a welcome improvement in activity as the spring market moved closer to peak homebuying season. Pending home sales increased in May, equity markets rebounded, and the labor market showed early signs of improvement. At the same time, inflation, mortgage rates, and affordability continue to shape buyer behavior across the country.
For buyers and sellers, the key takeaway is that the market is improving, but it is still not simple. Demand is present, but buyers remain selective. Inventory has stopped rising as quickly in many areas, but local supply levels vary widely. Some markets continue to experience tight inventory and price pressure, while others are still feeling the effects of higher supply and affordability challenges.
At The Simmonds Team, we follow national housing trends because they help explain the broader forces influencing buyer confidence, mortgage demand, relocation decisions, and pricing strategy. But national data is only one part of the story. Real estate remains highly local, and conditions can change significantly by city, neighborhood, property type, price point, and inventory level.
In Northern Palm Beach County, Jupiter, Palm Beach Gardens, Juno Beach, Tequesta, North Palm Beach, Singer Island, and Jupiter Island do not always move in lockstep with the national market. Waterfront homes, condominiums, golf communities, luxury properties, and traditional residential neighborhoods each have their own supply-and-demand patterns.
Market at a Glance
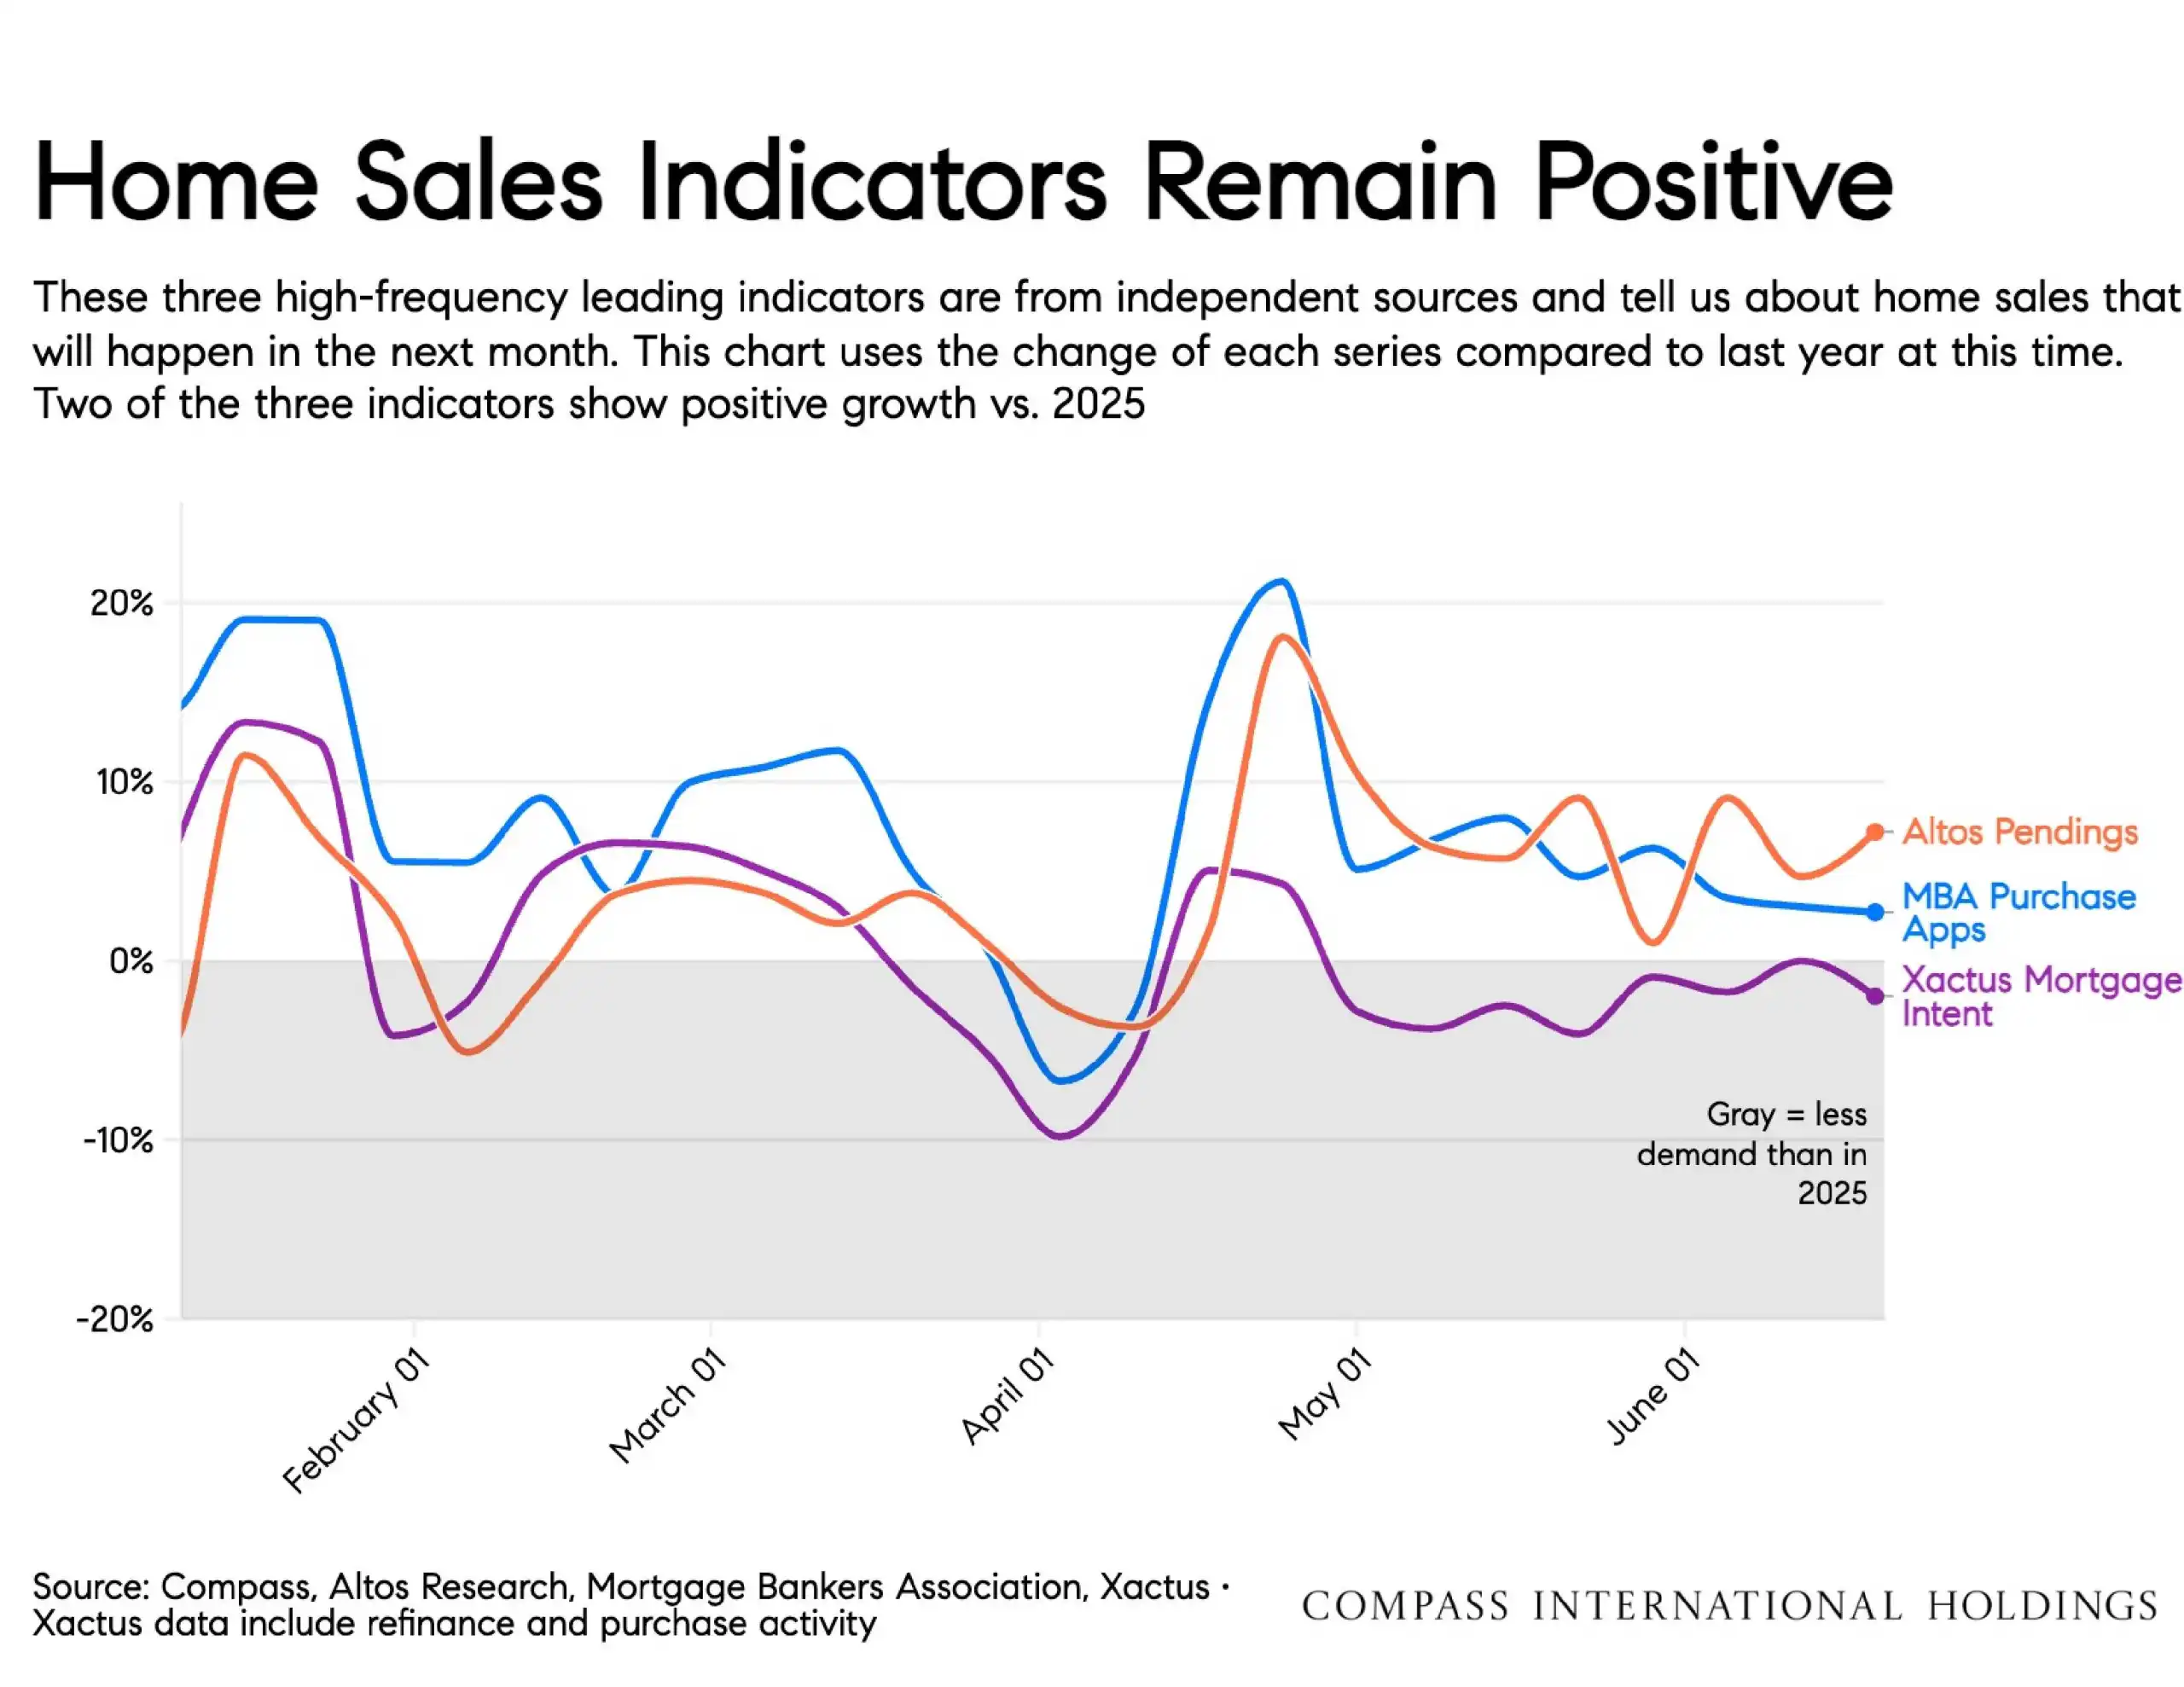
Buyer Activity: Pending home sales improved in May, showing stronger buyer engagement compared with earlier in the year.
Mortgage Rates: Rates moved higher in mid-May as inflation concerns increased, keeping affordability at the center of buyer decision-making.
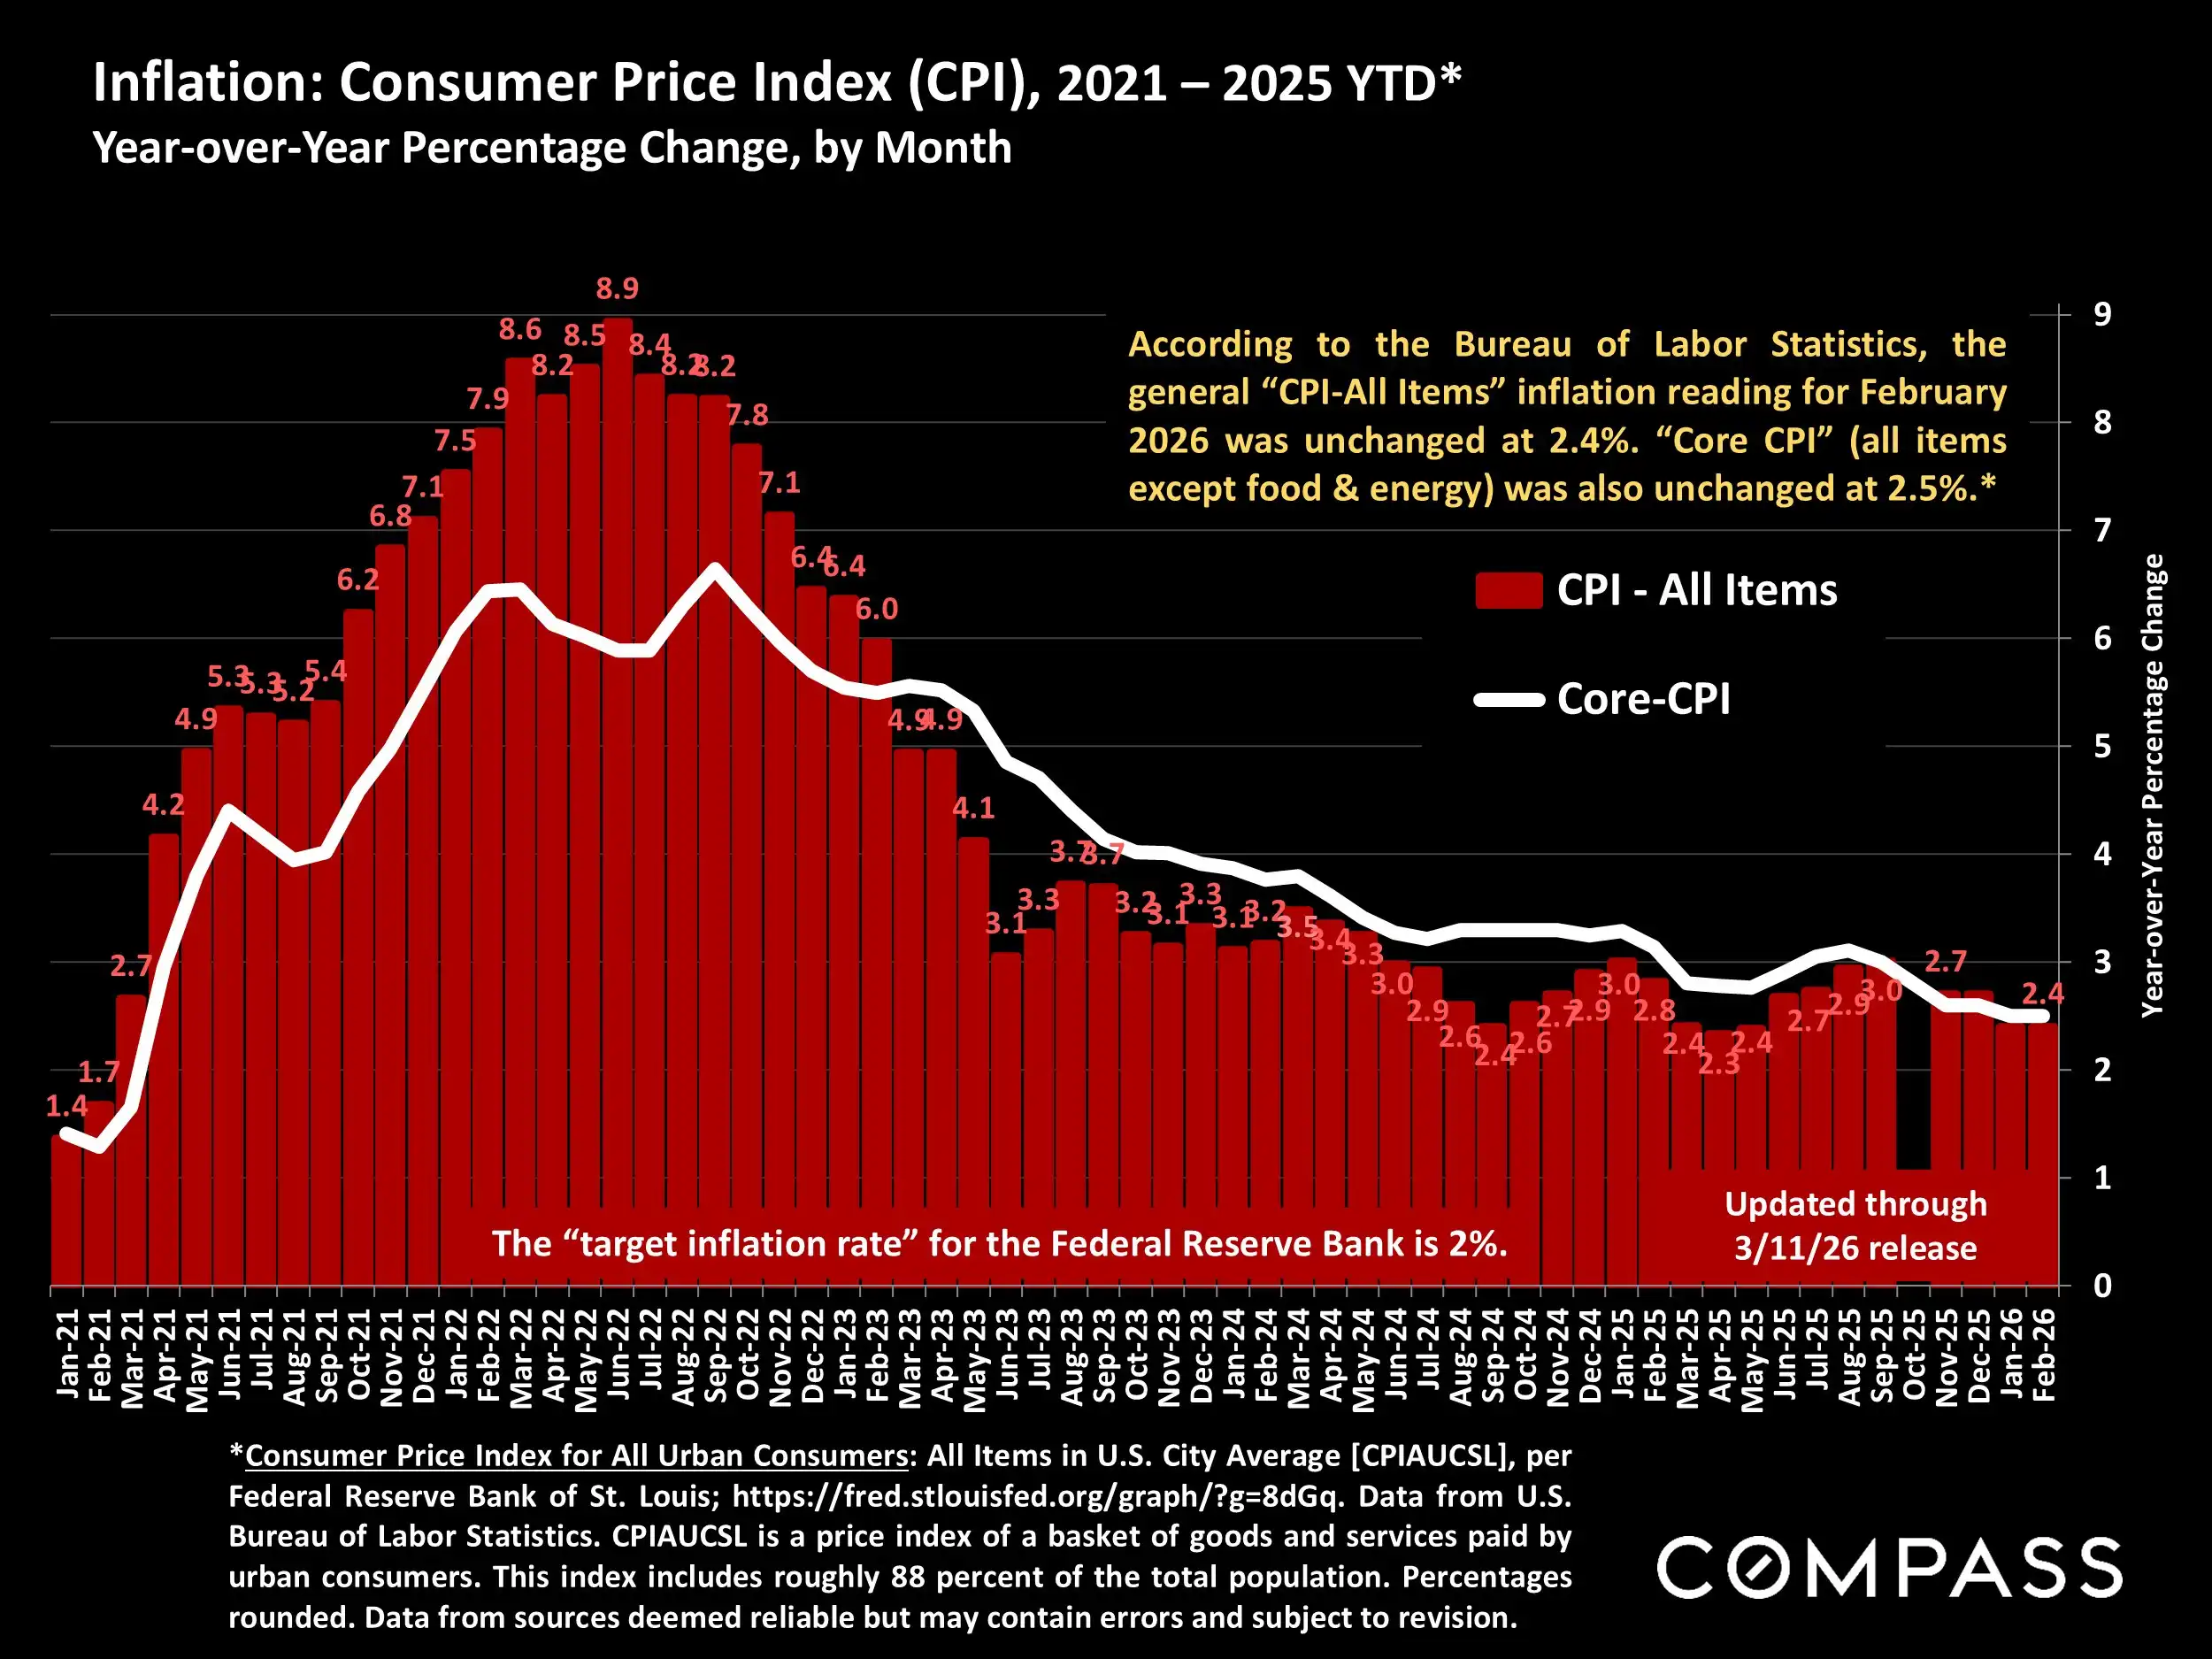
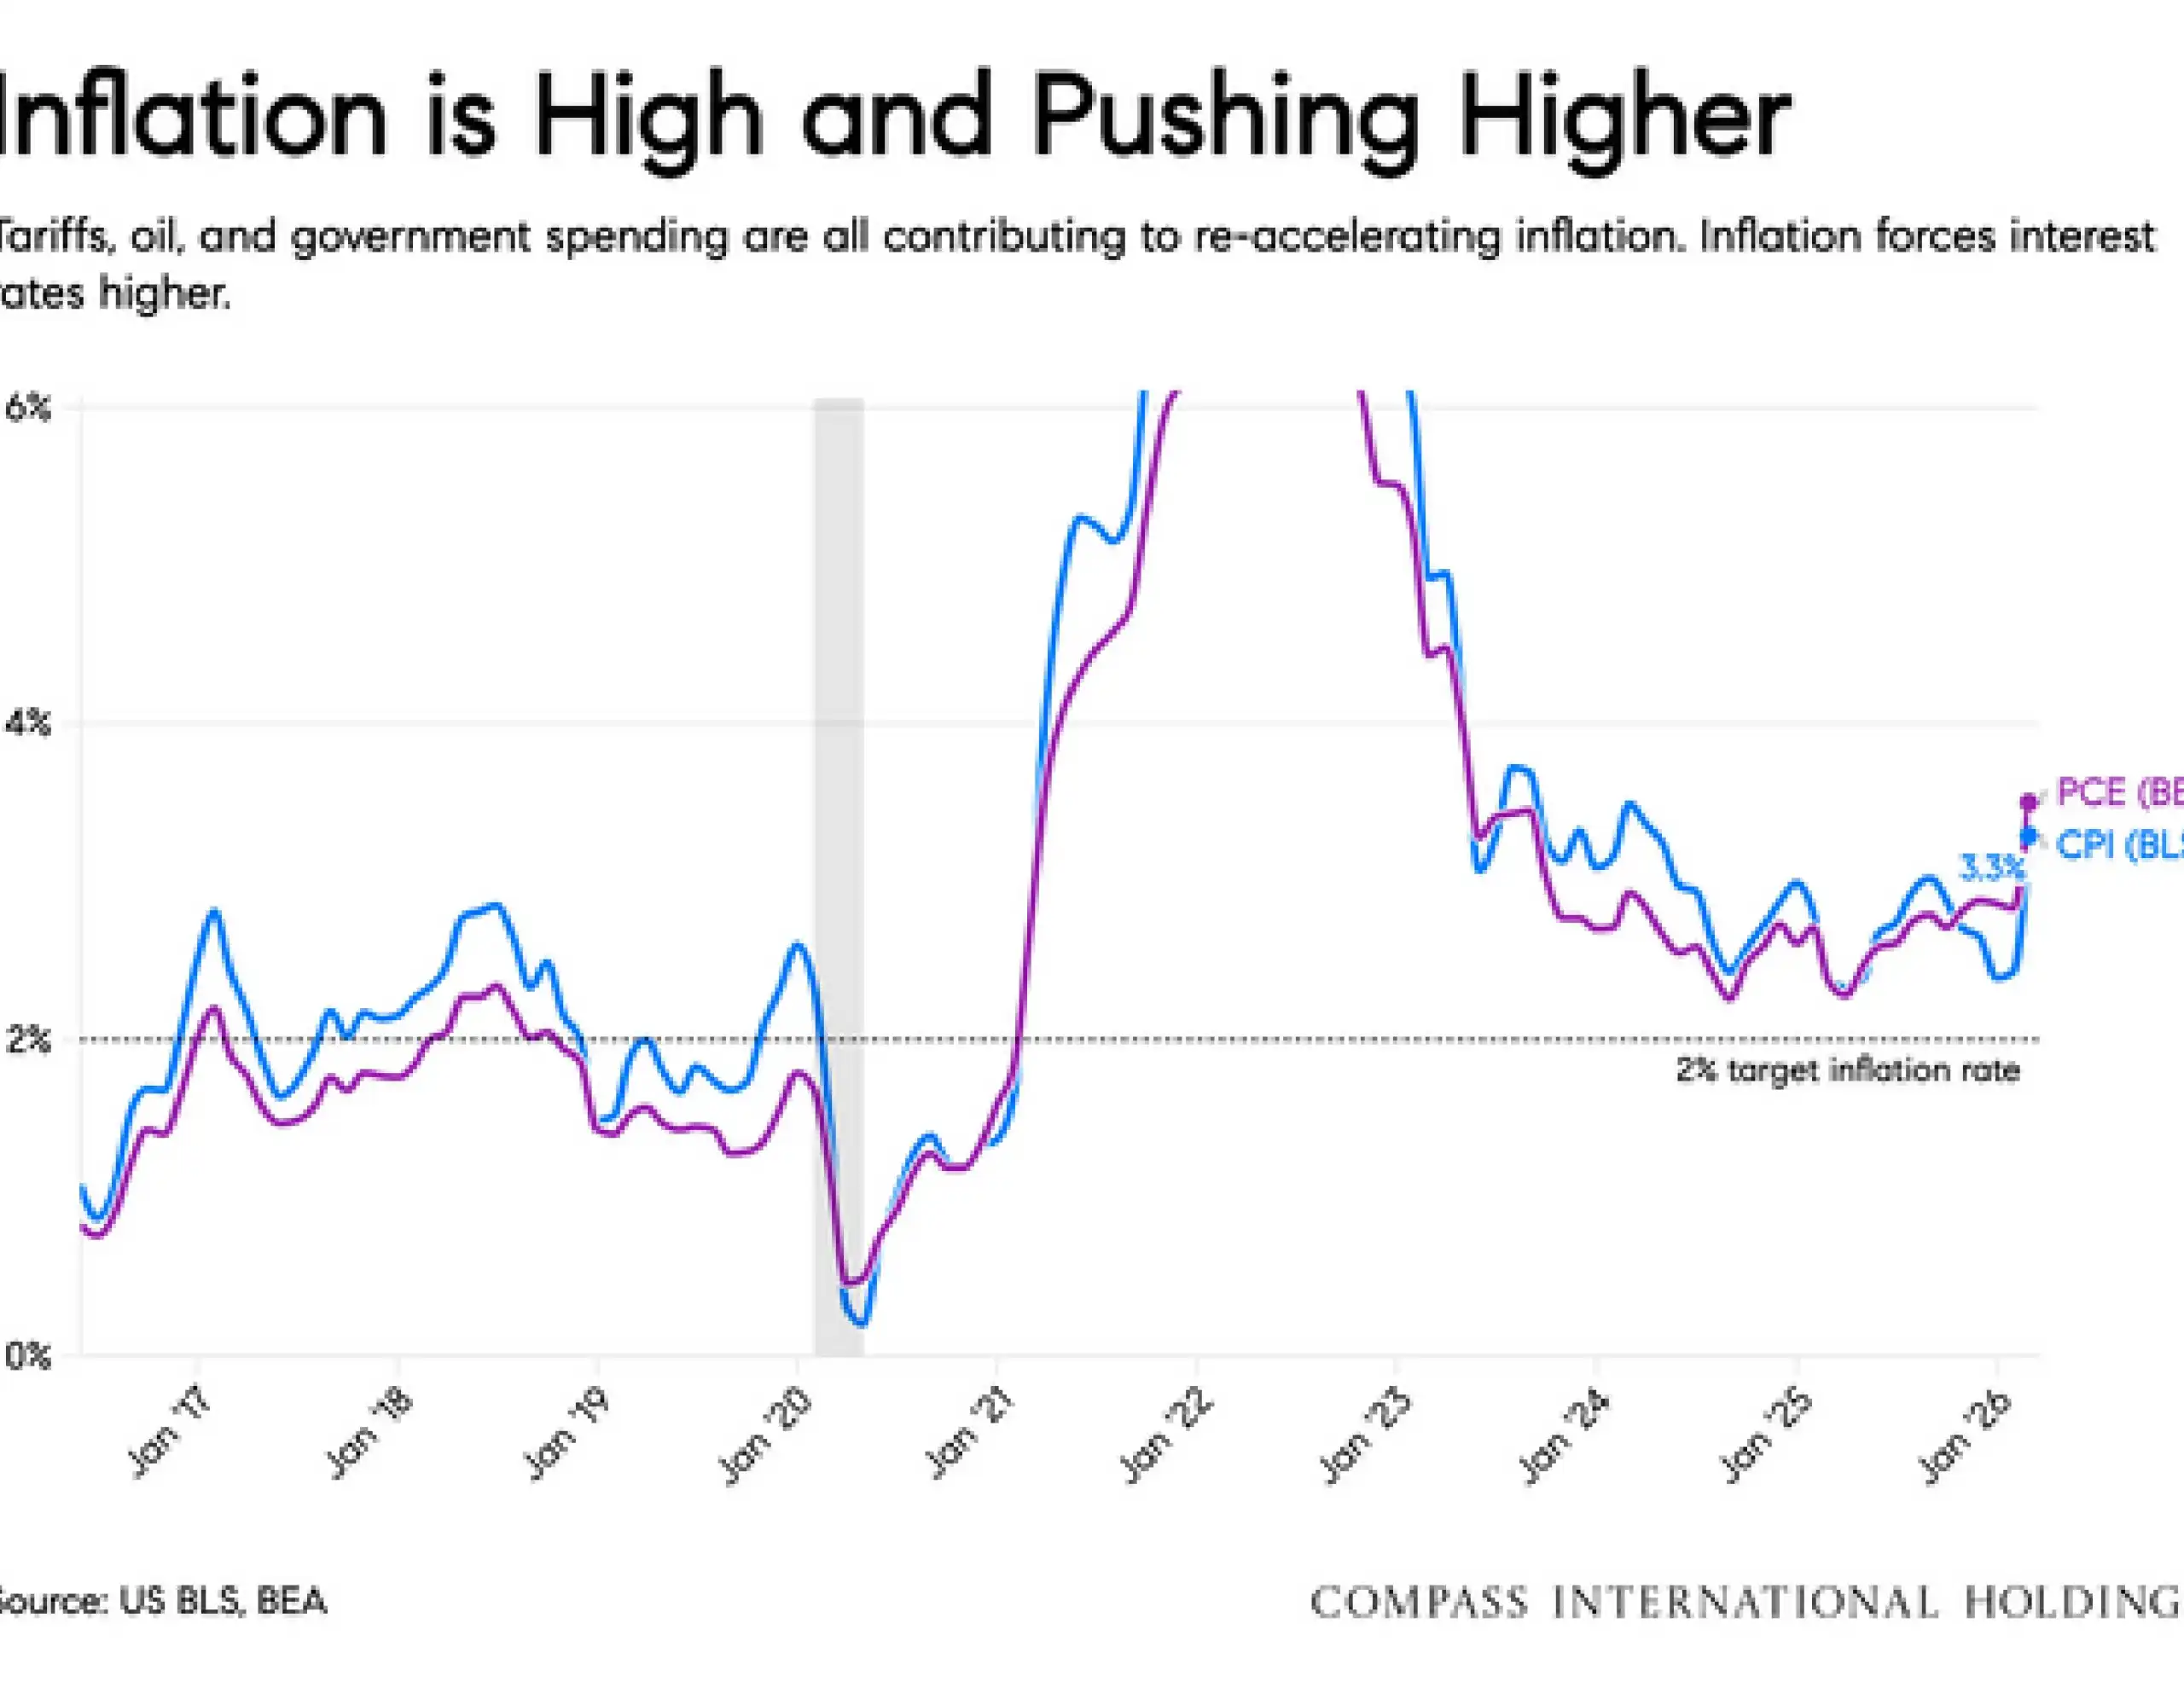
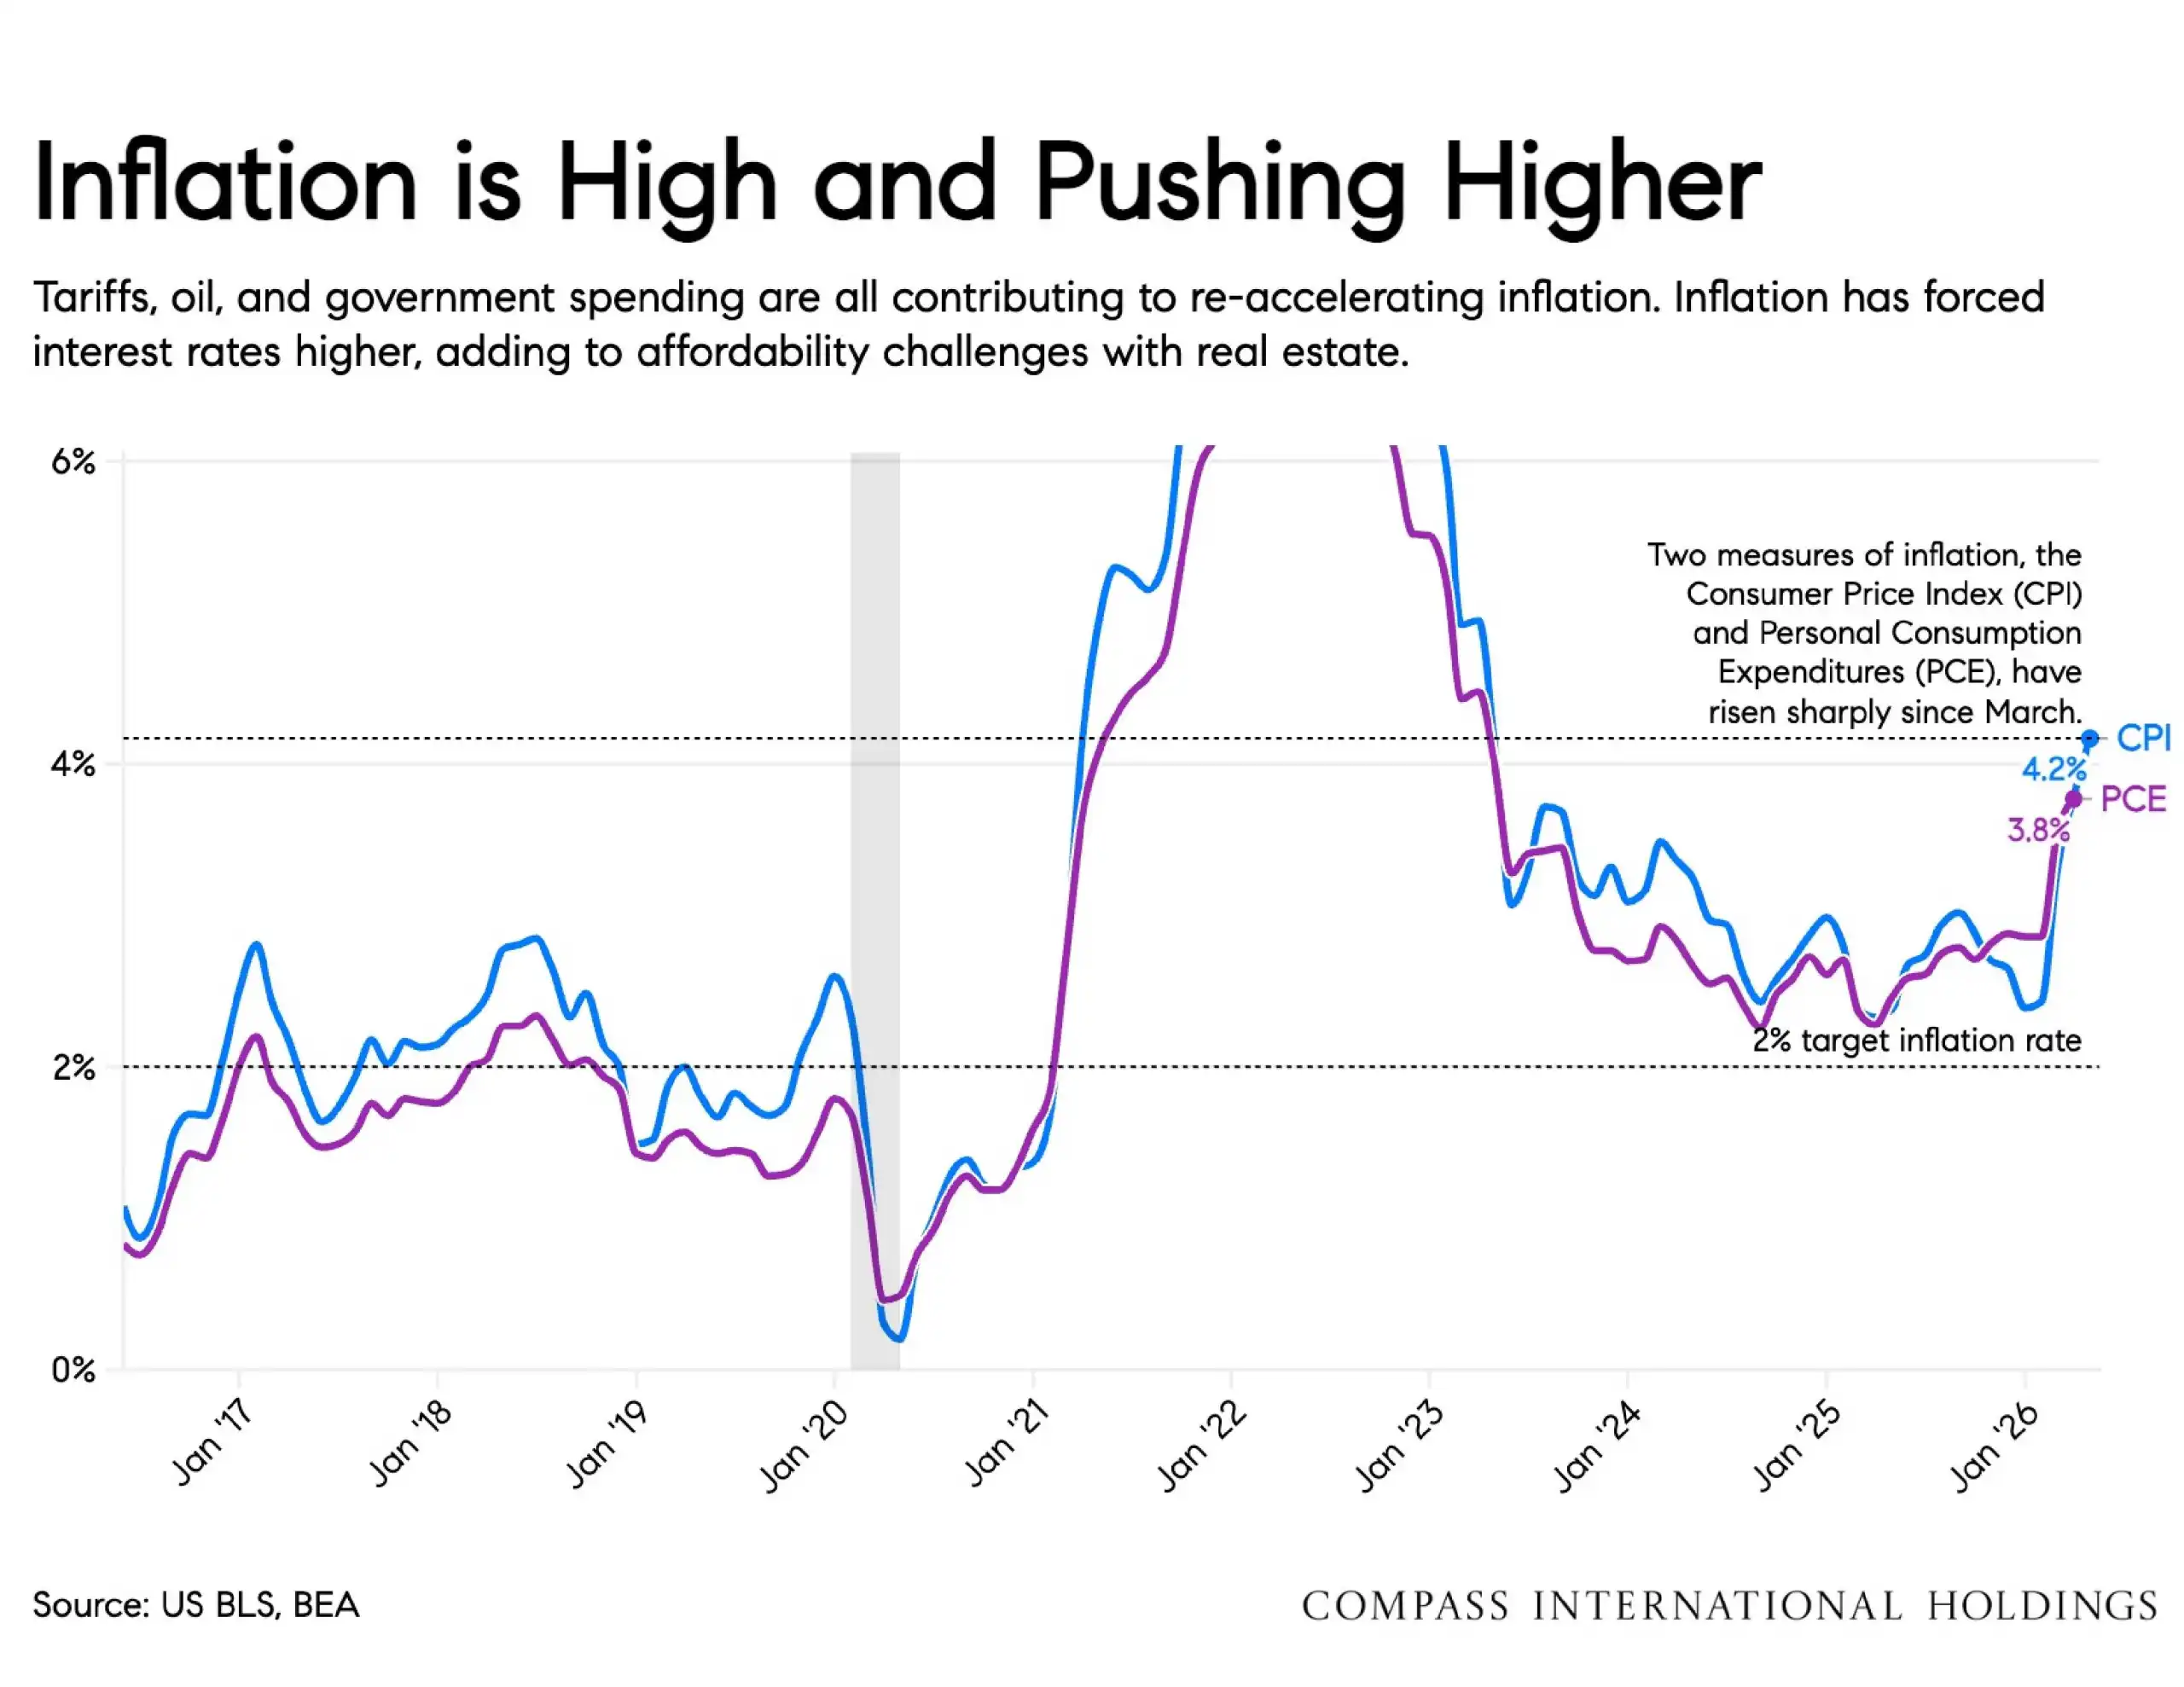
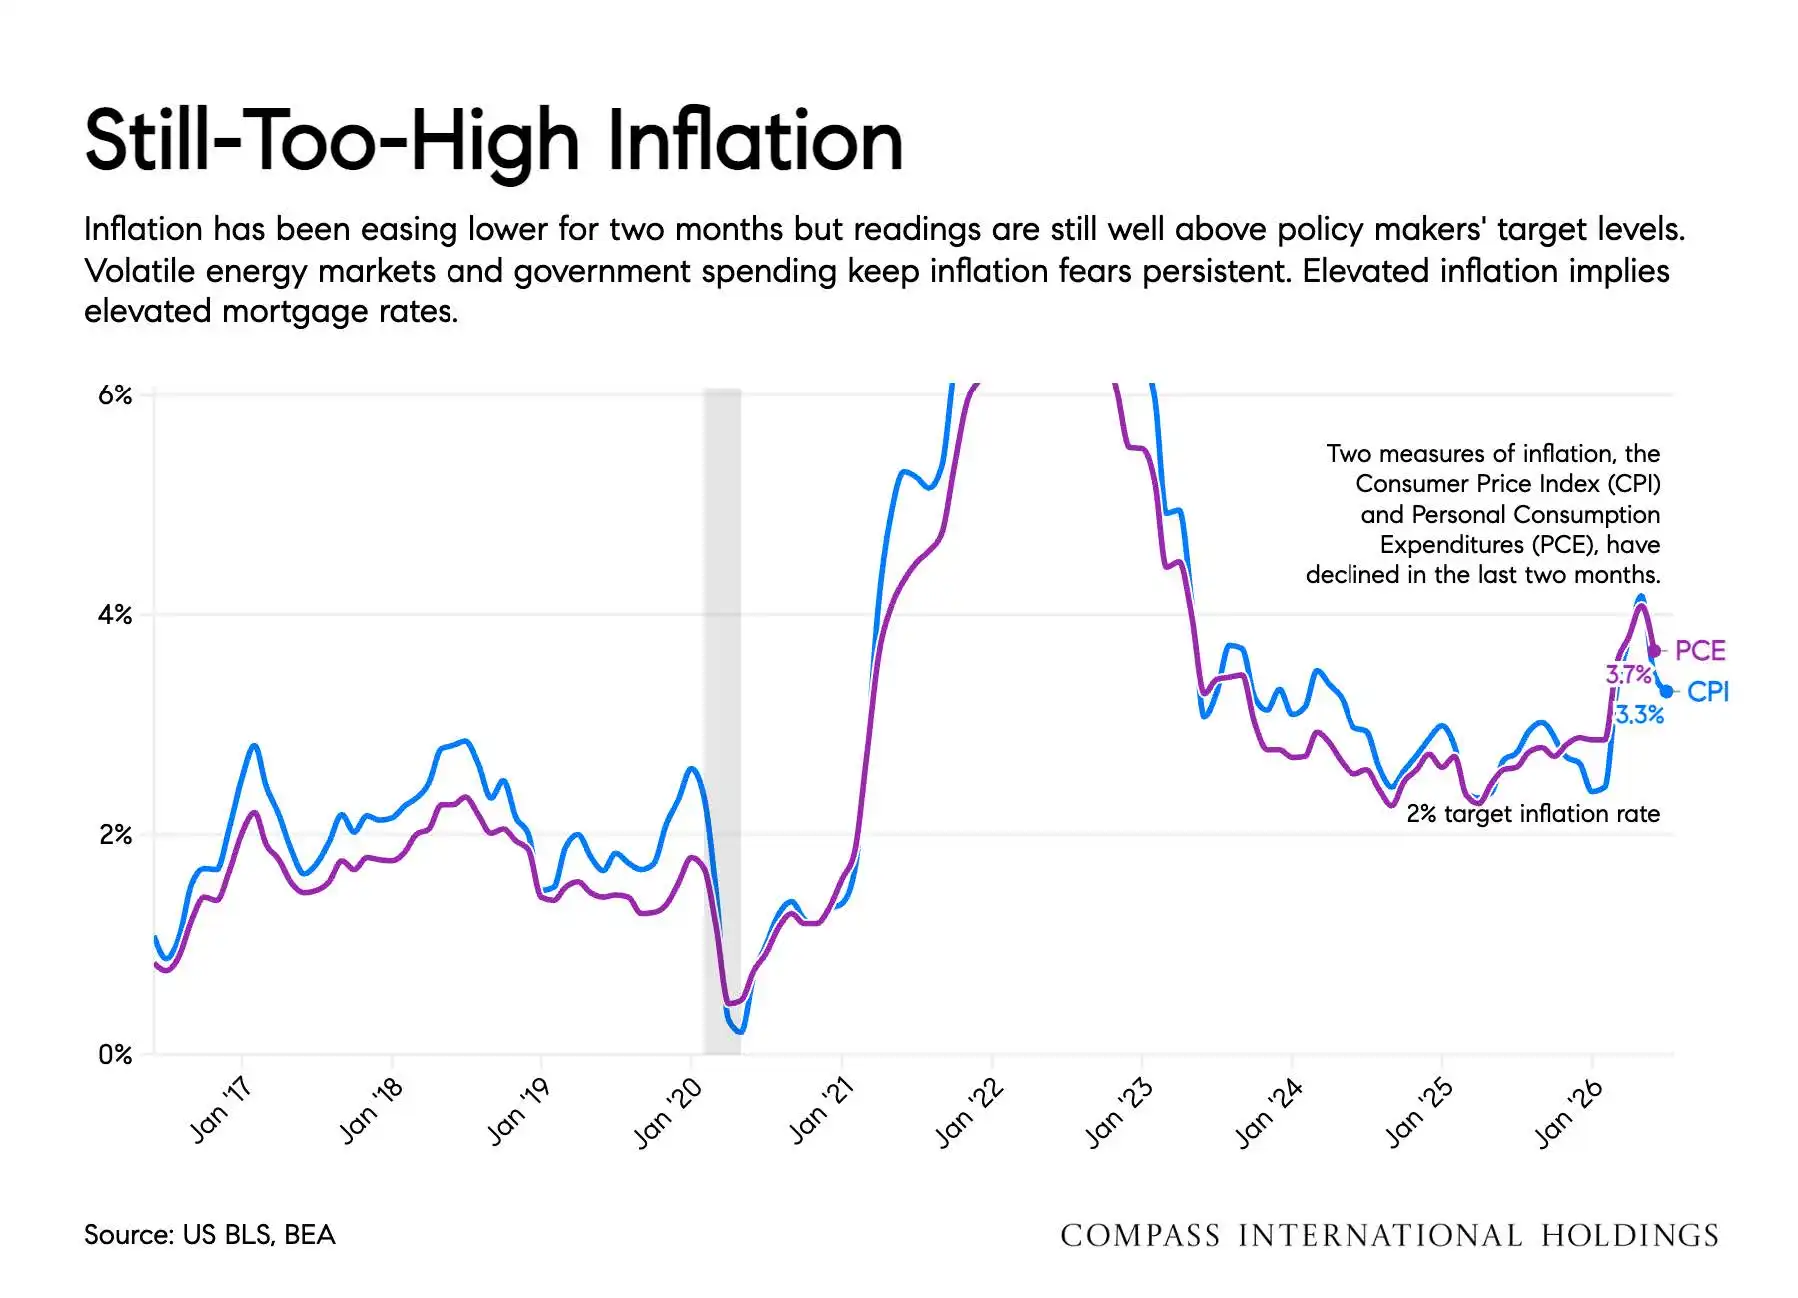
Inflation: Tariffs, energy costs, and government spending contributed to renewed inflation pressure, which may limit near-term interest rate relief.
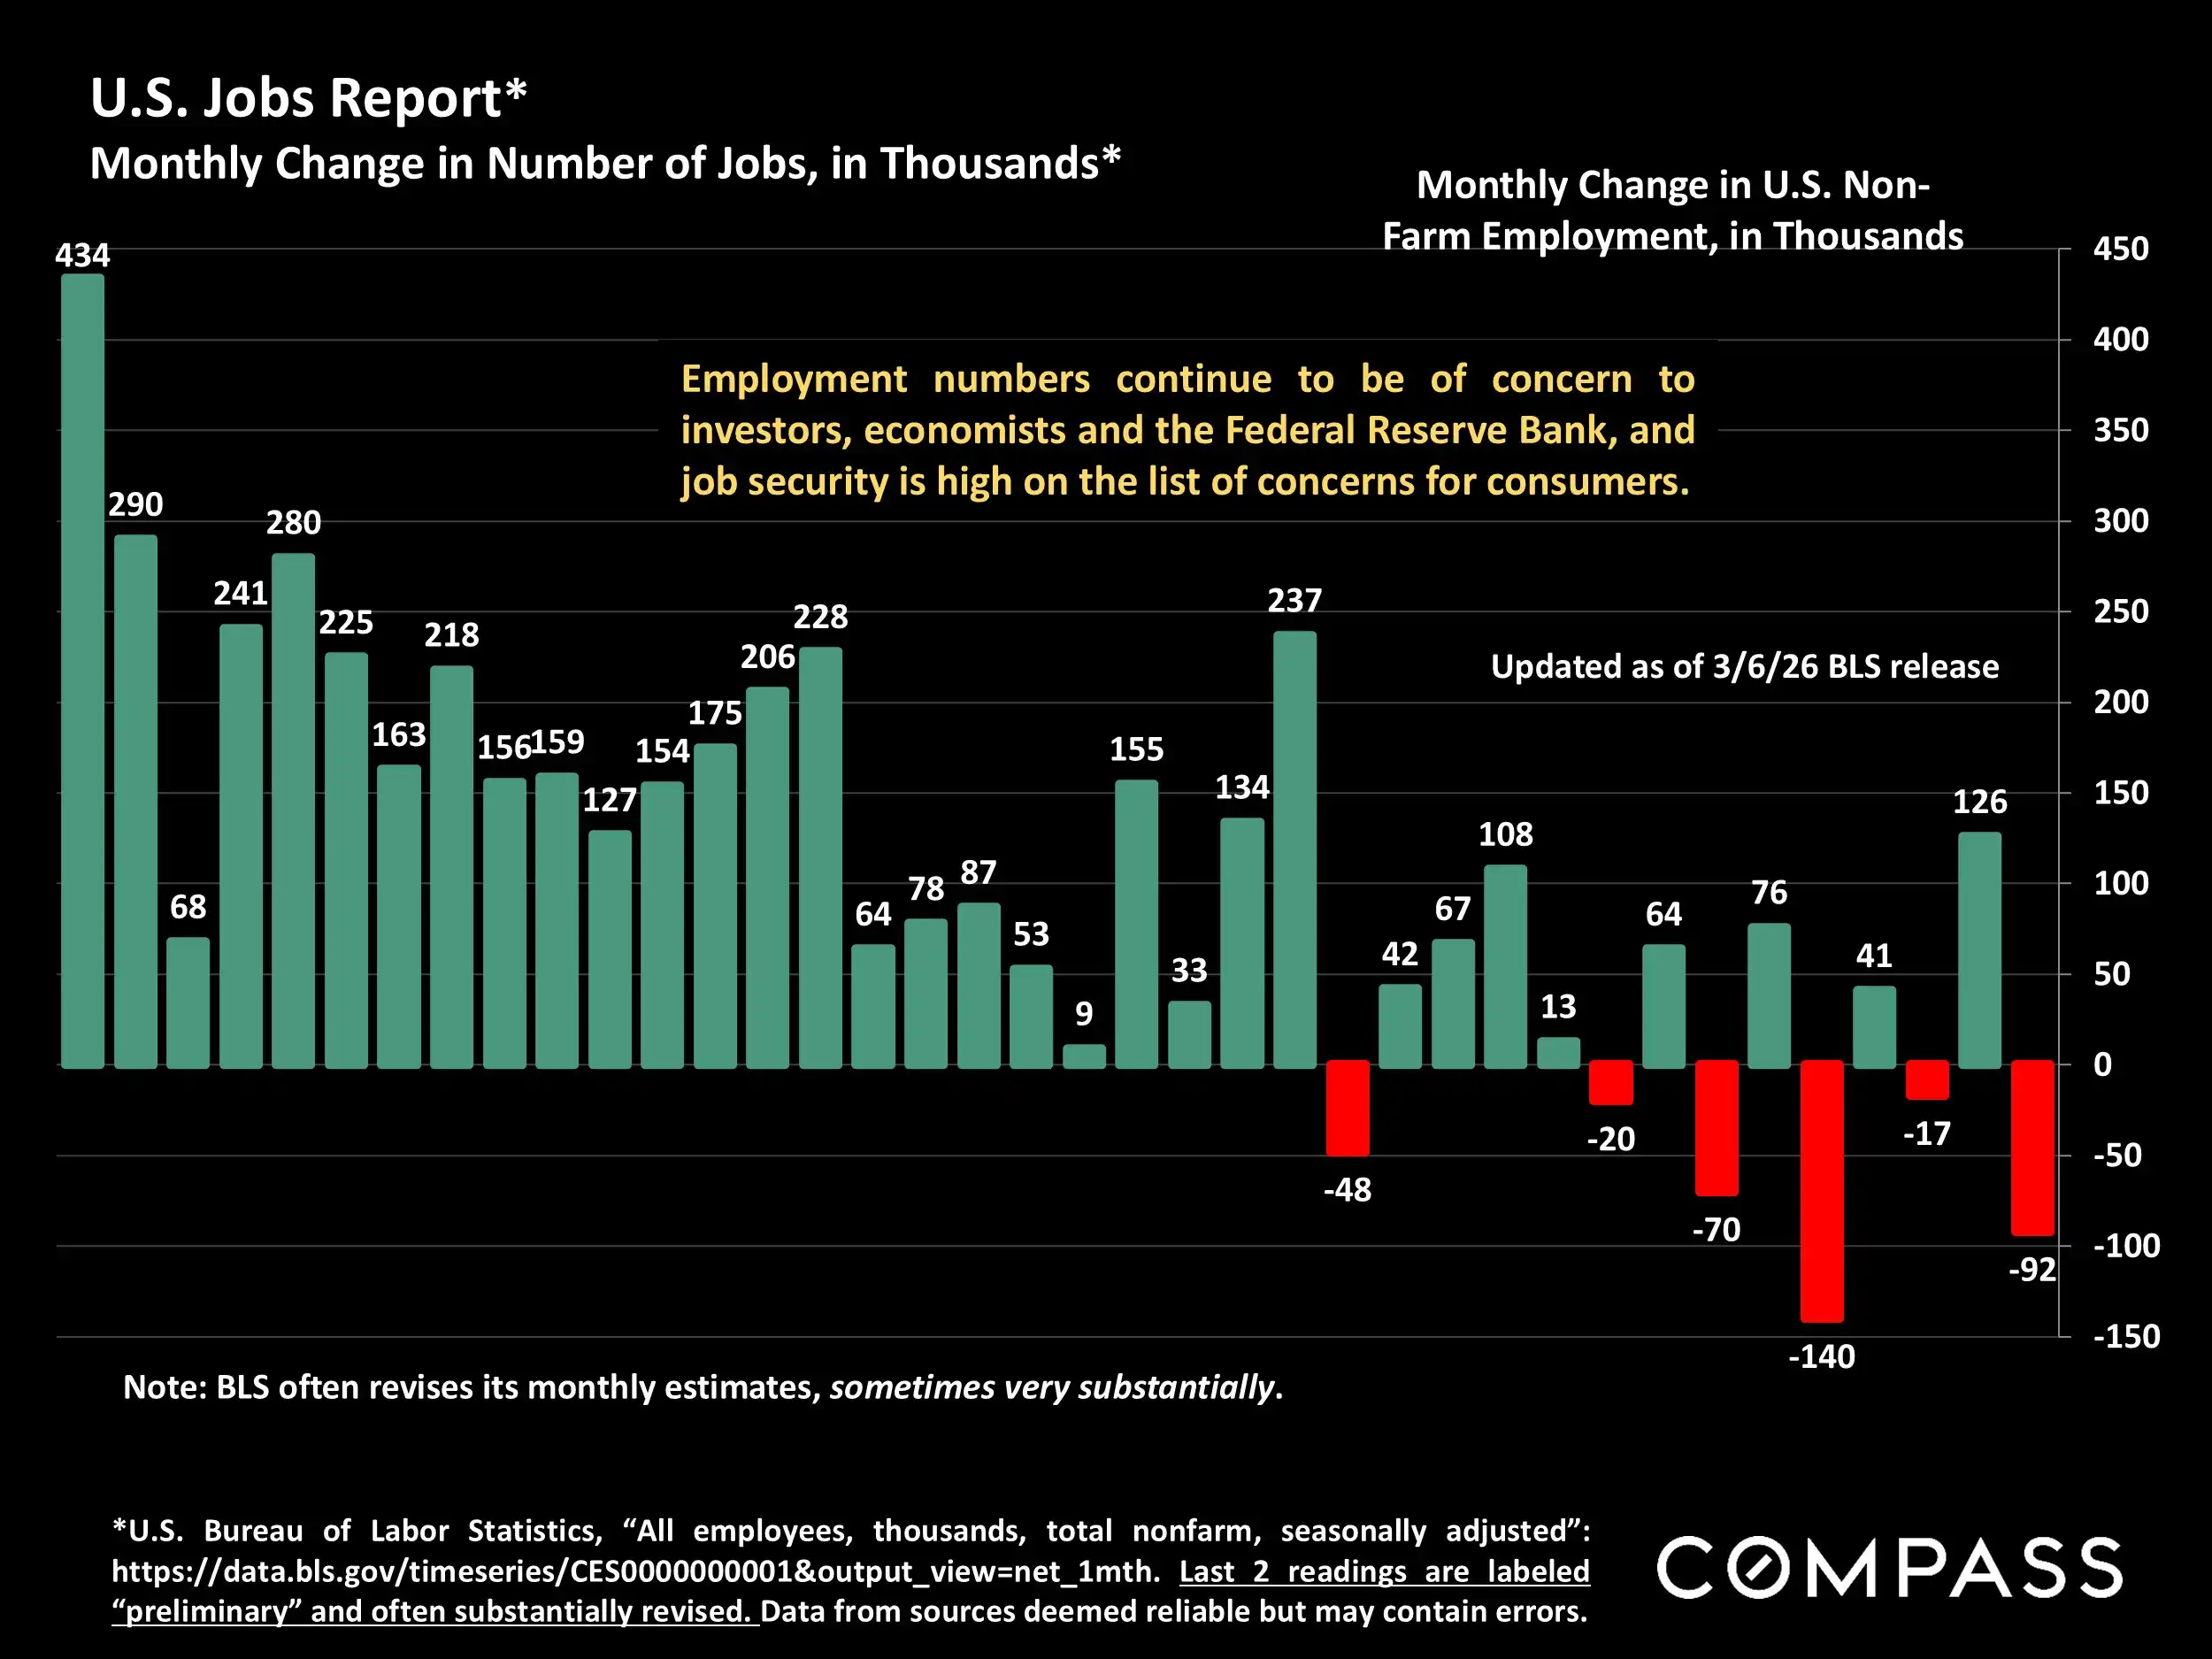
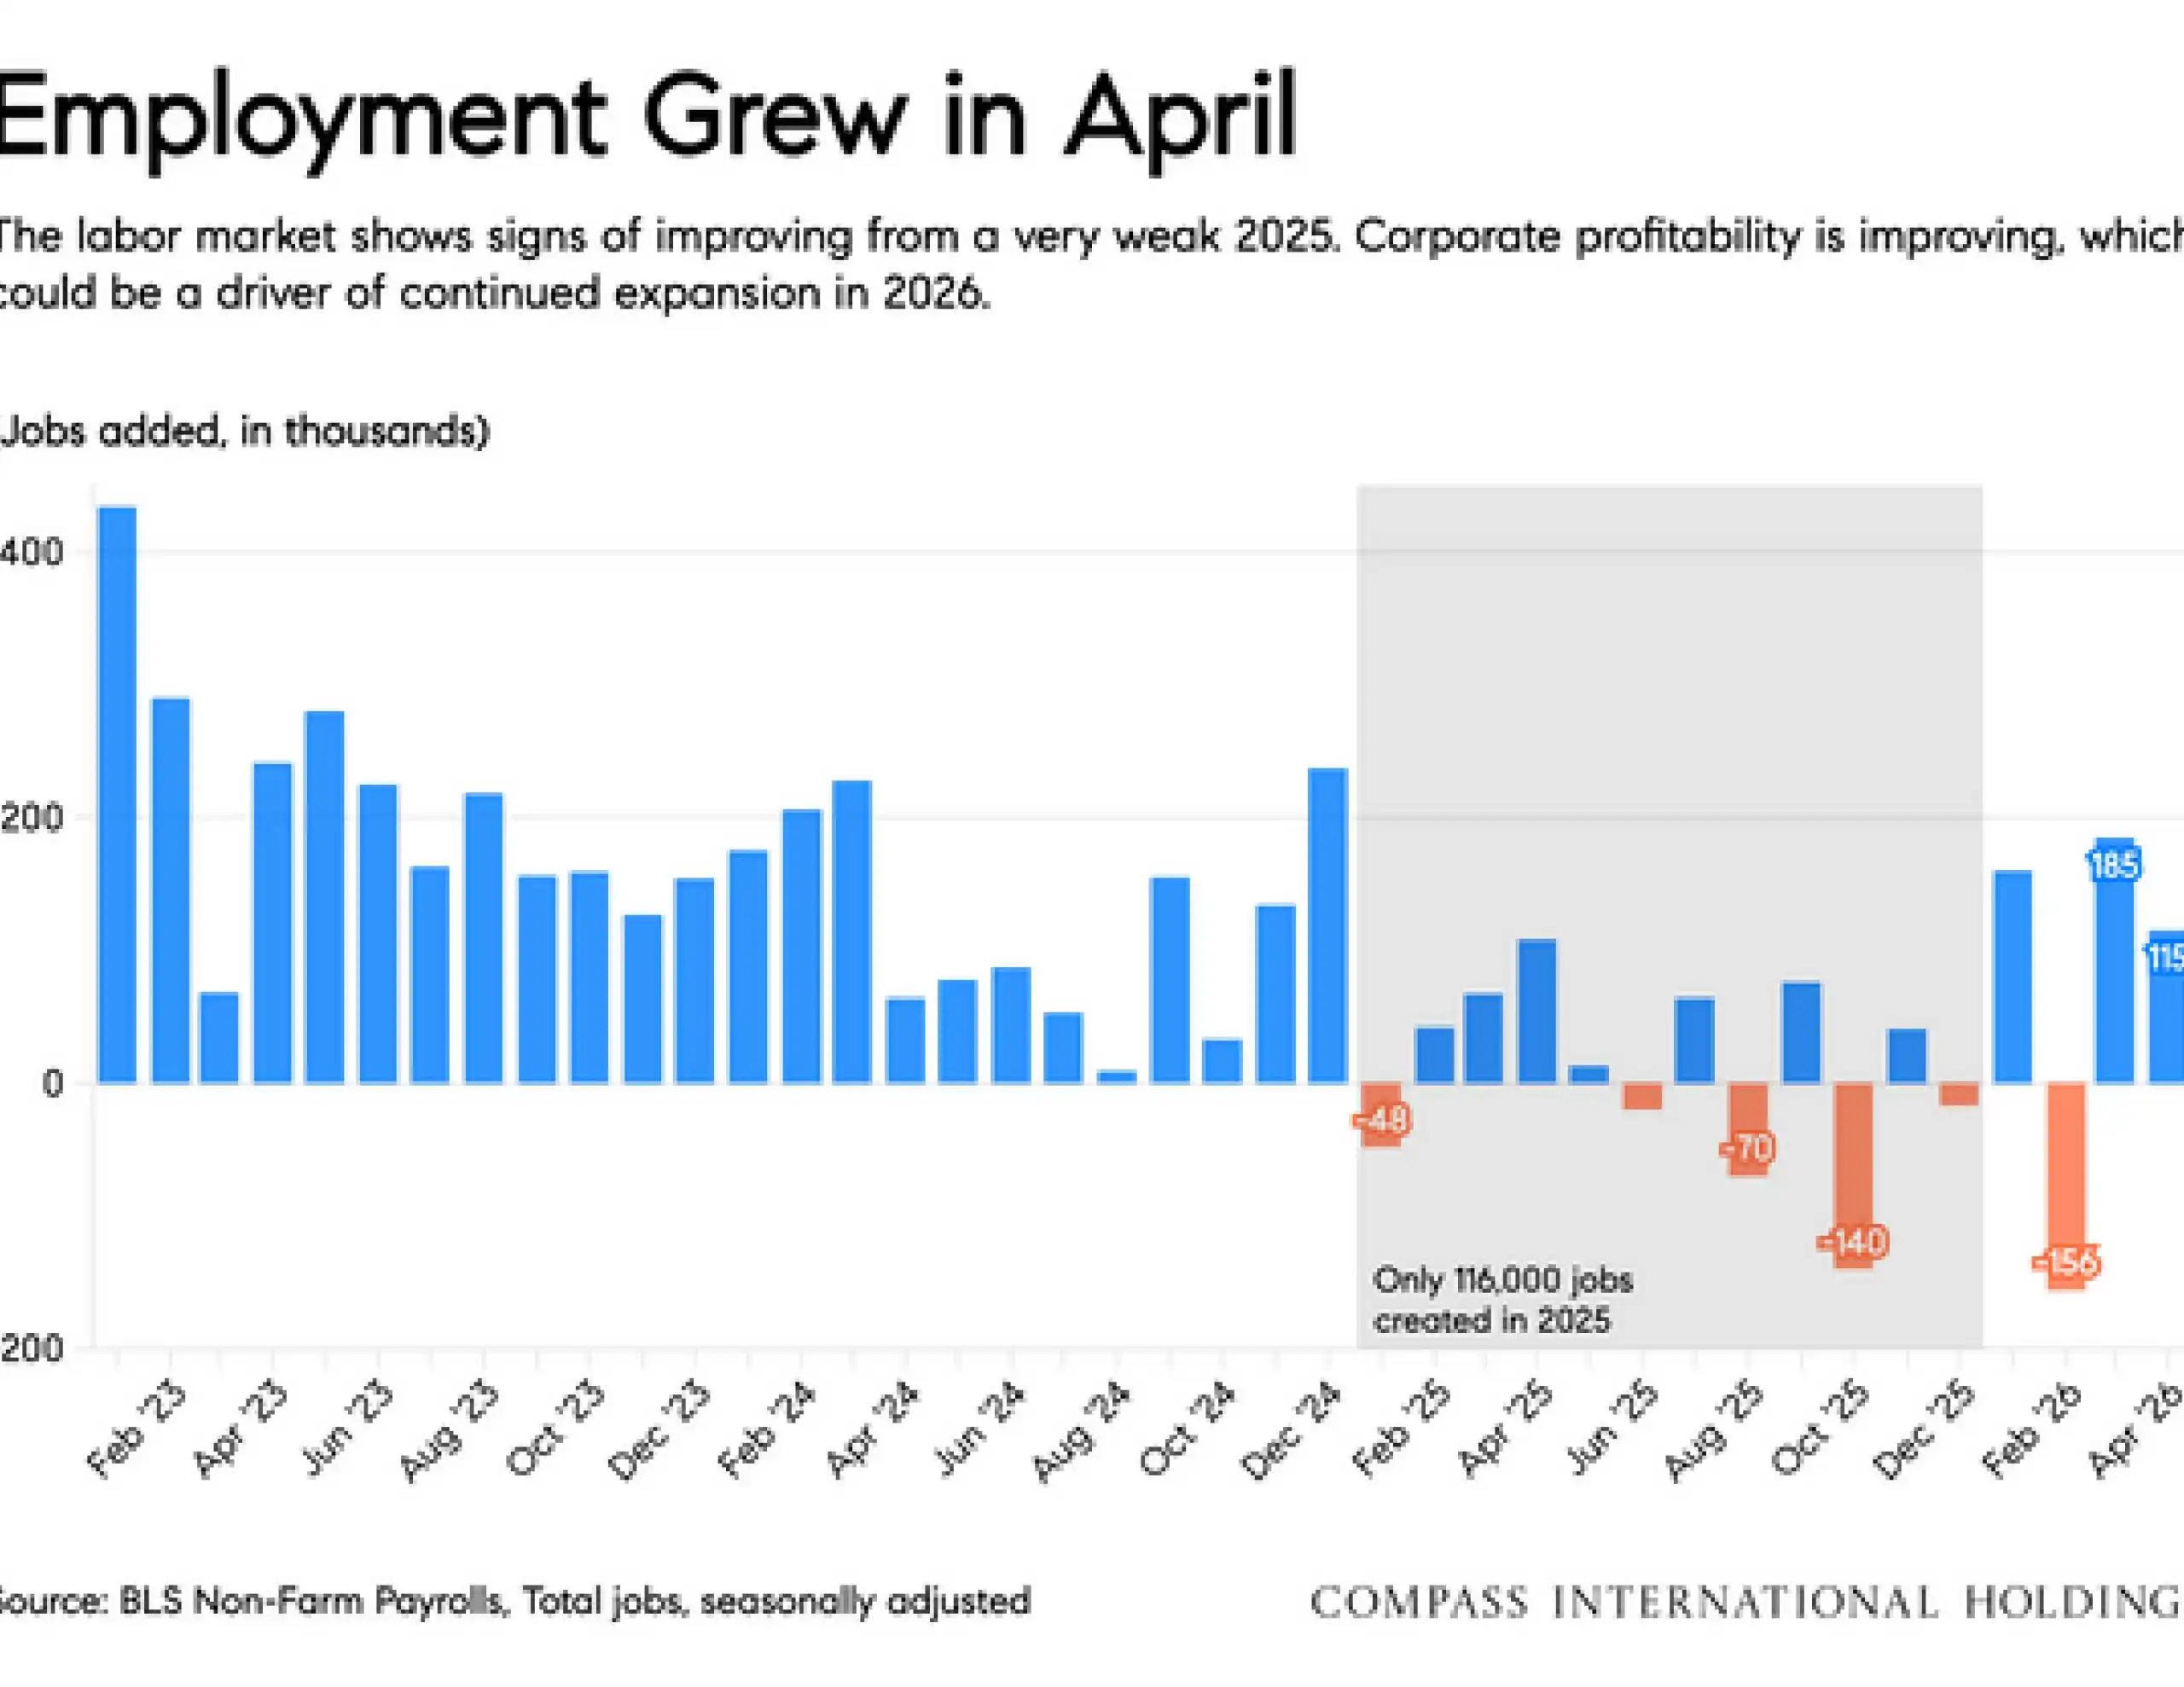
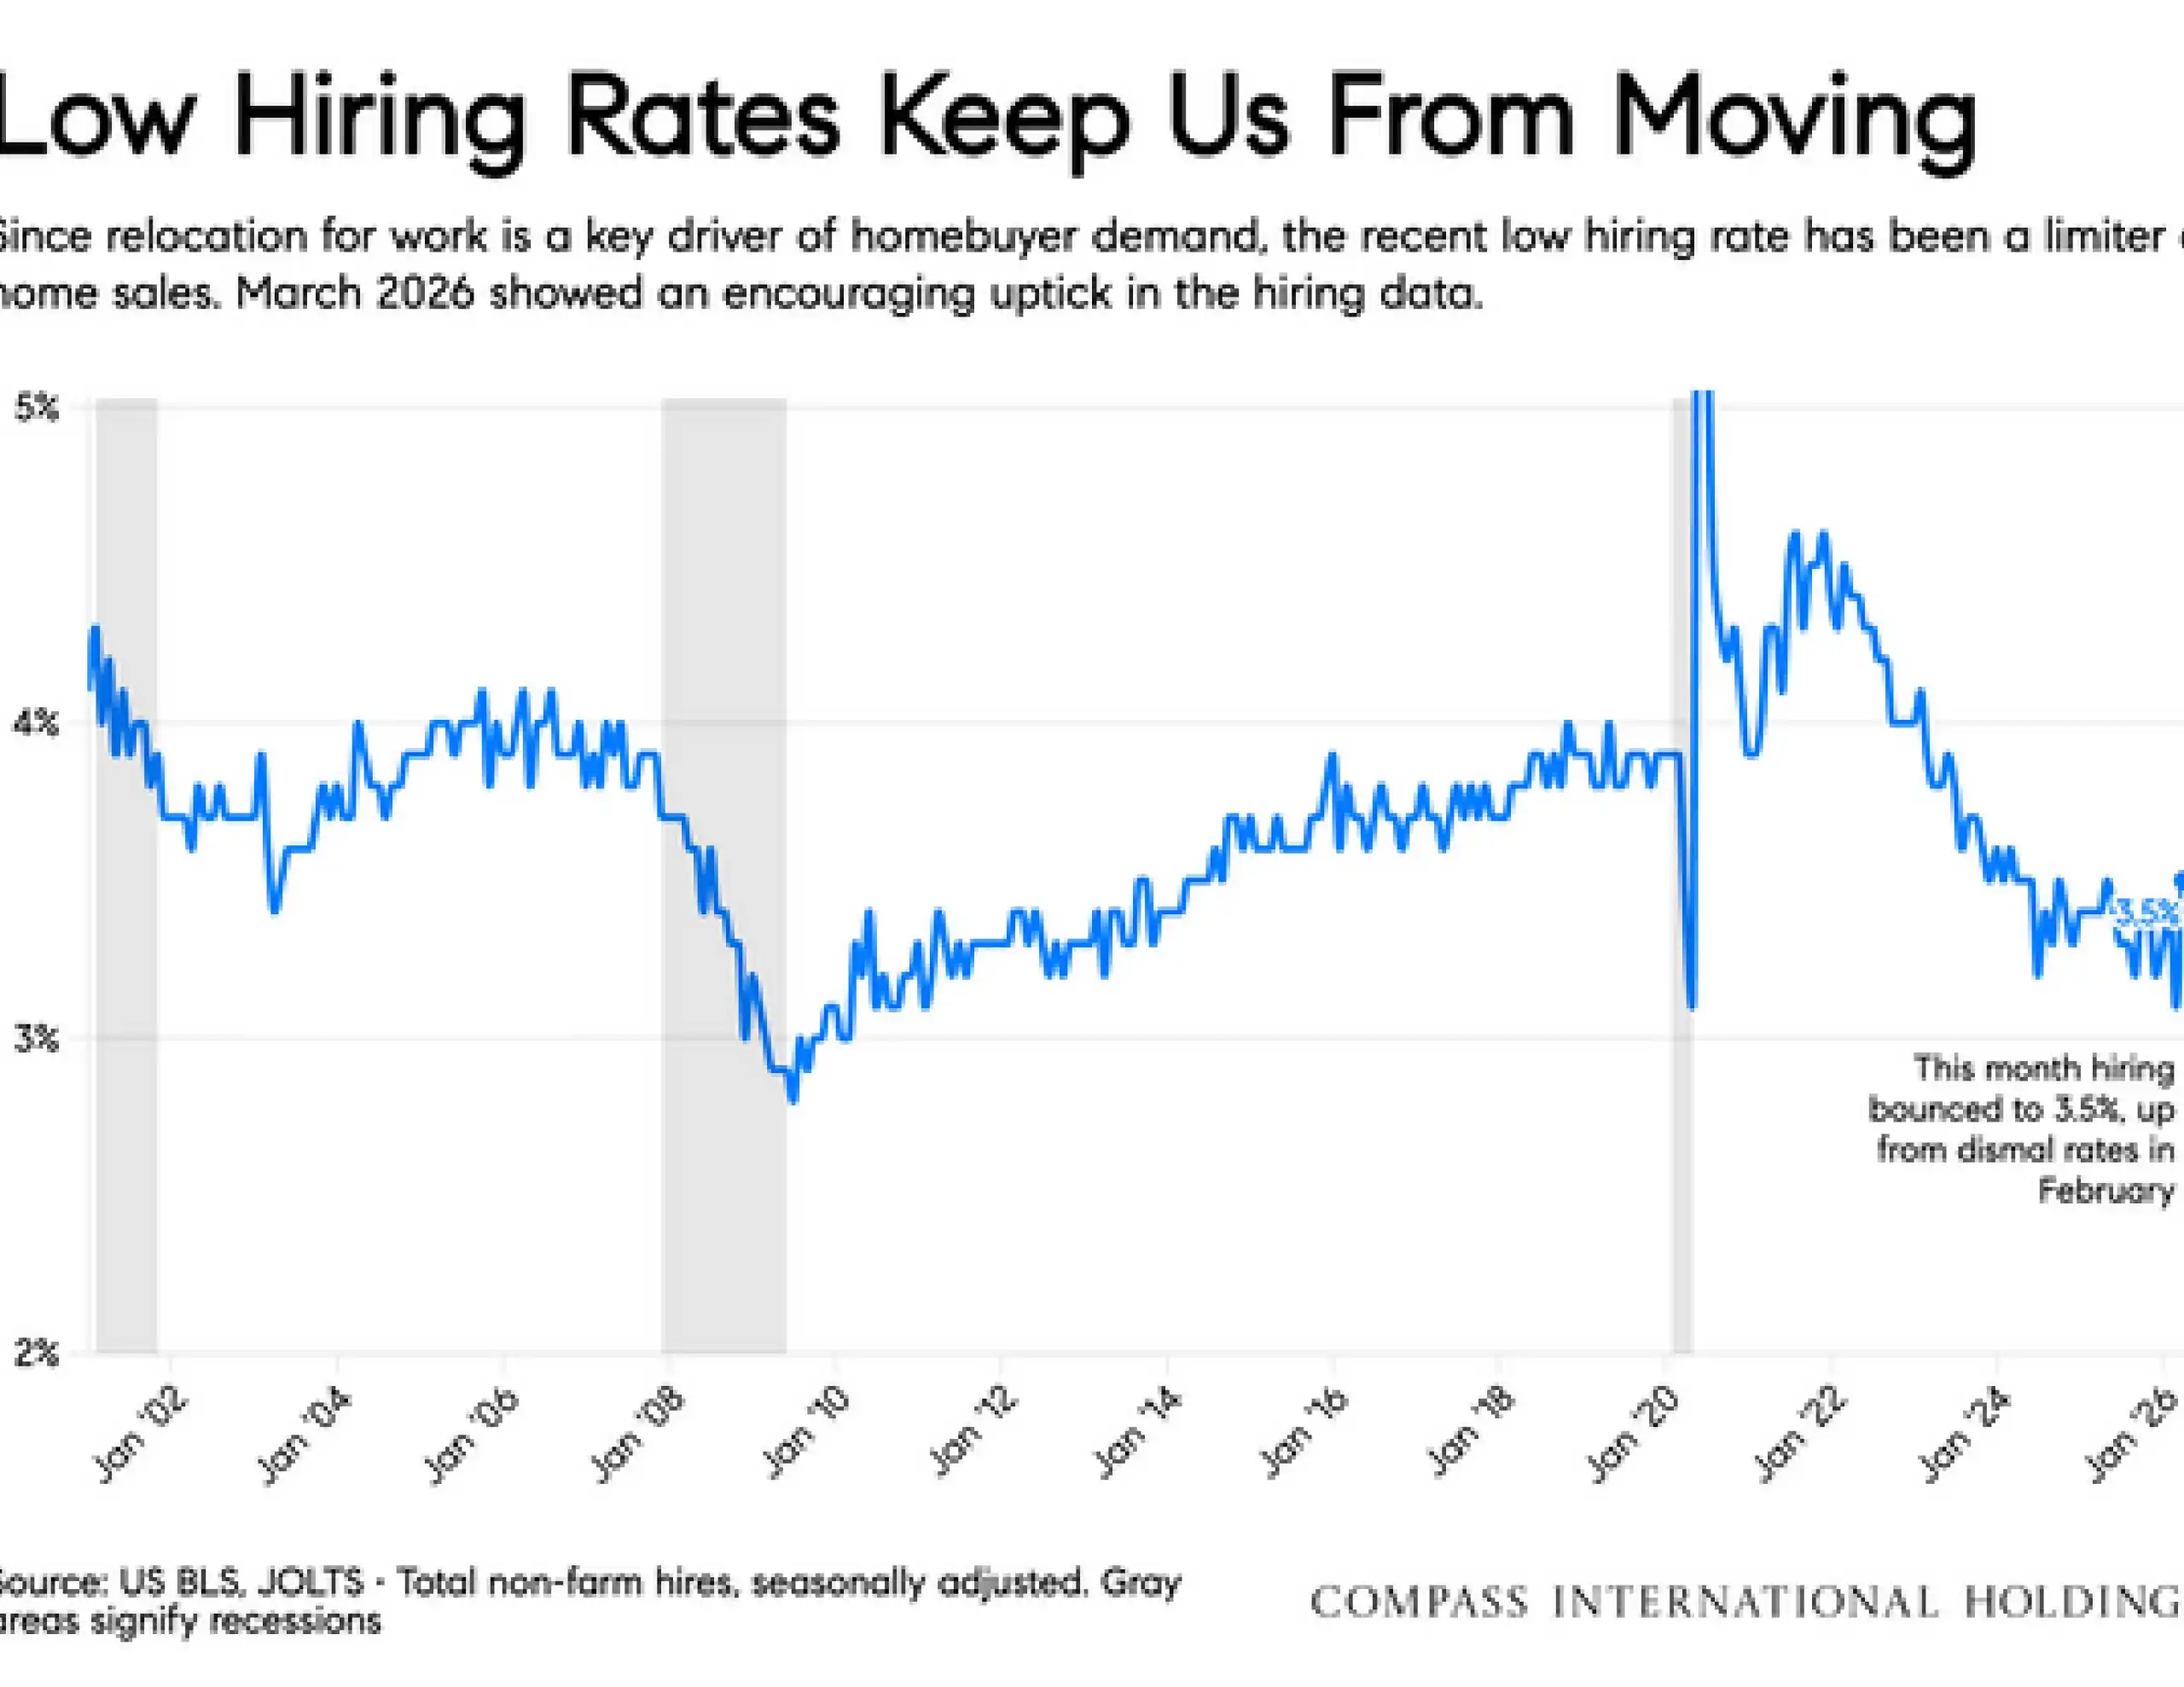
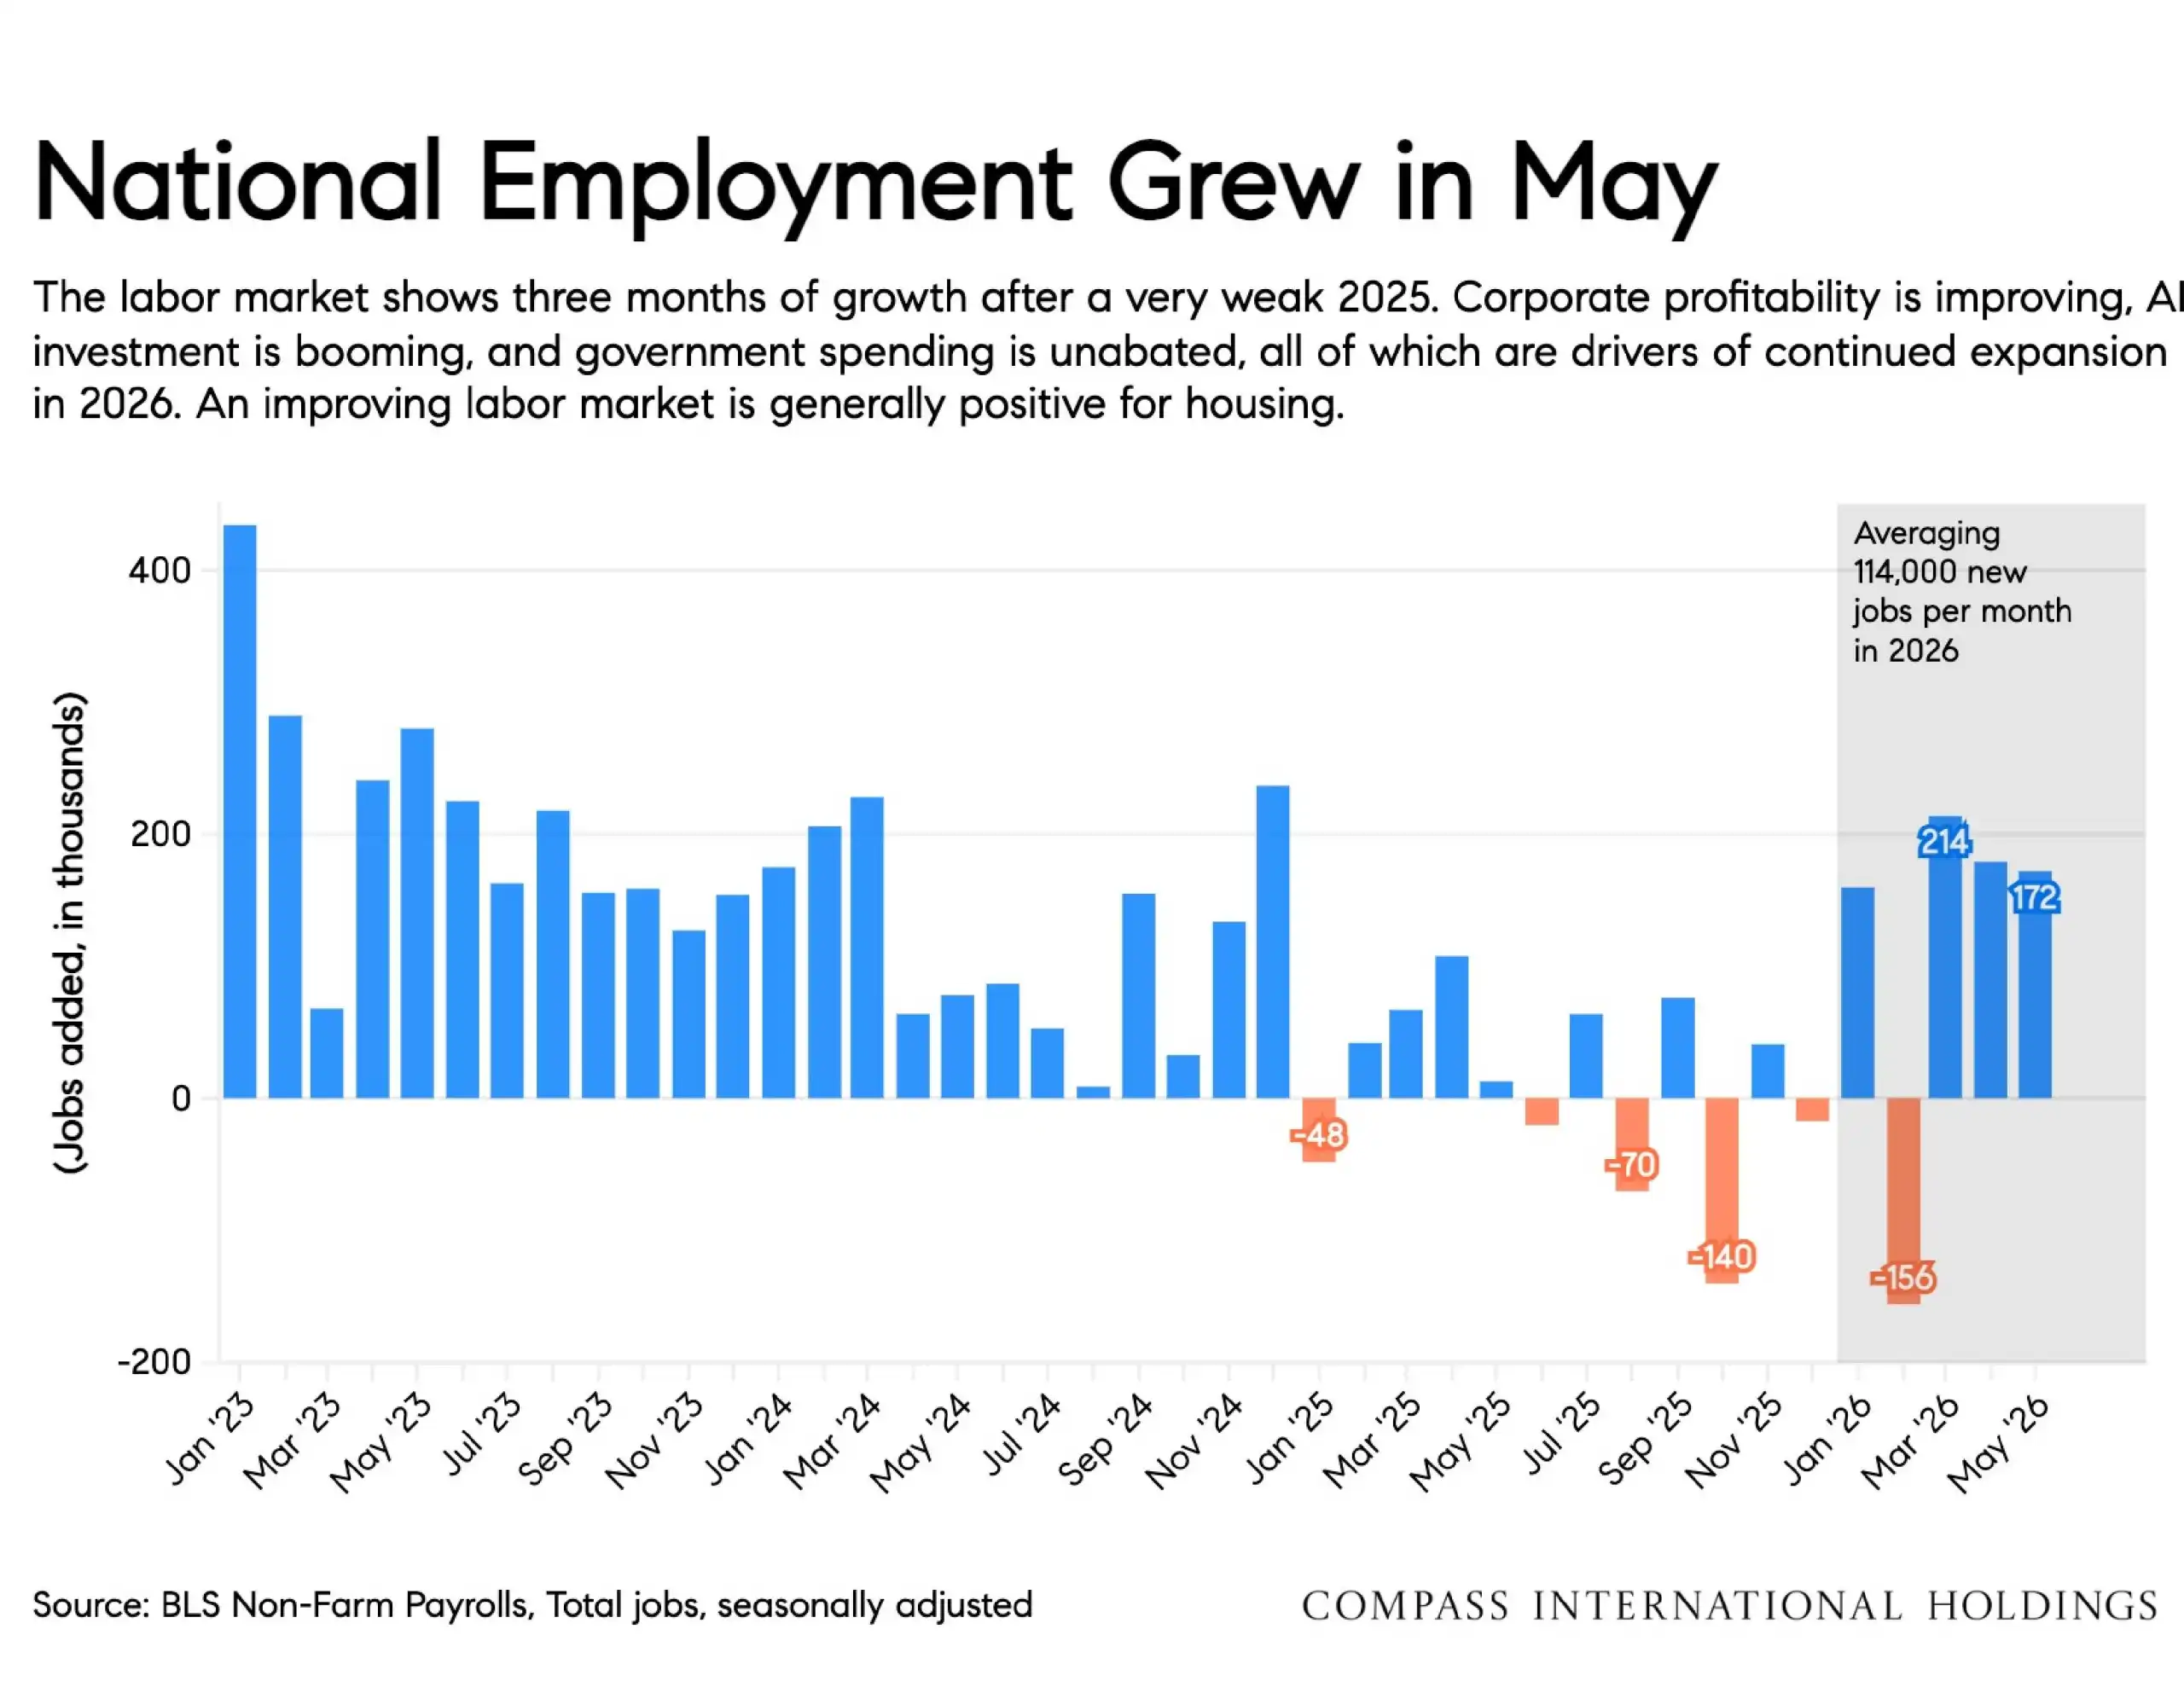
Employment: Job creation improved in April, and hiring showed early signs of recovery. This matters because job relocation is one of the drivers of housing demand.
Home Prices: National home price growth remains slightly positive, but results vary by market.
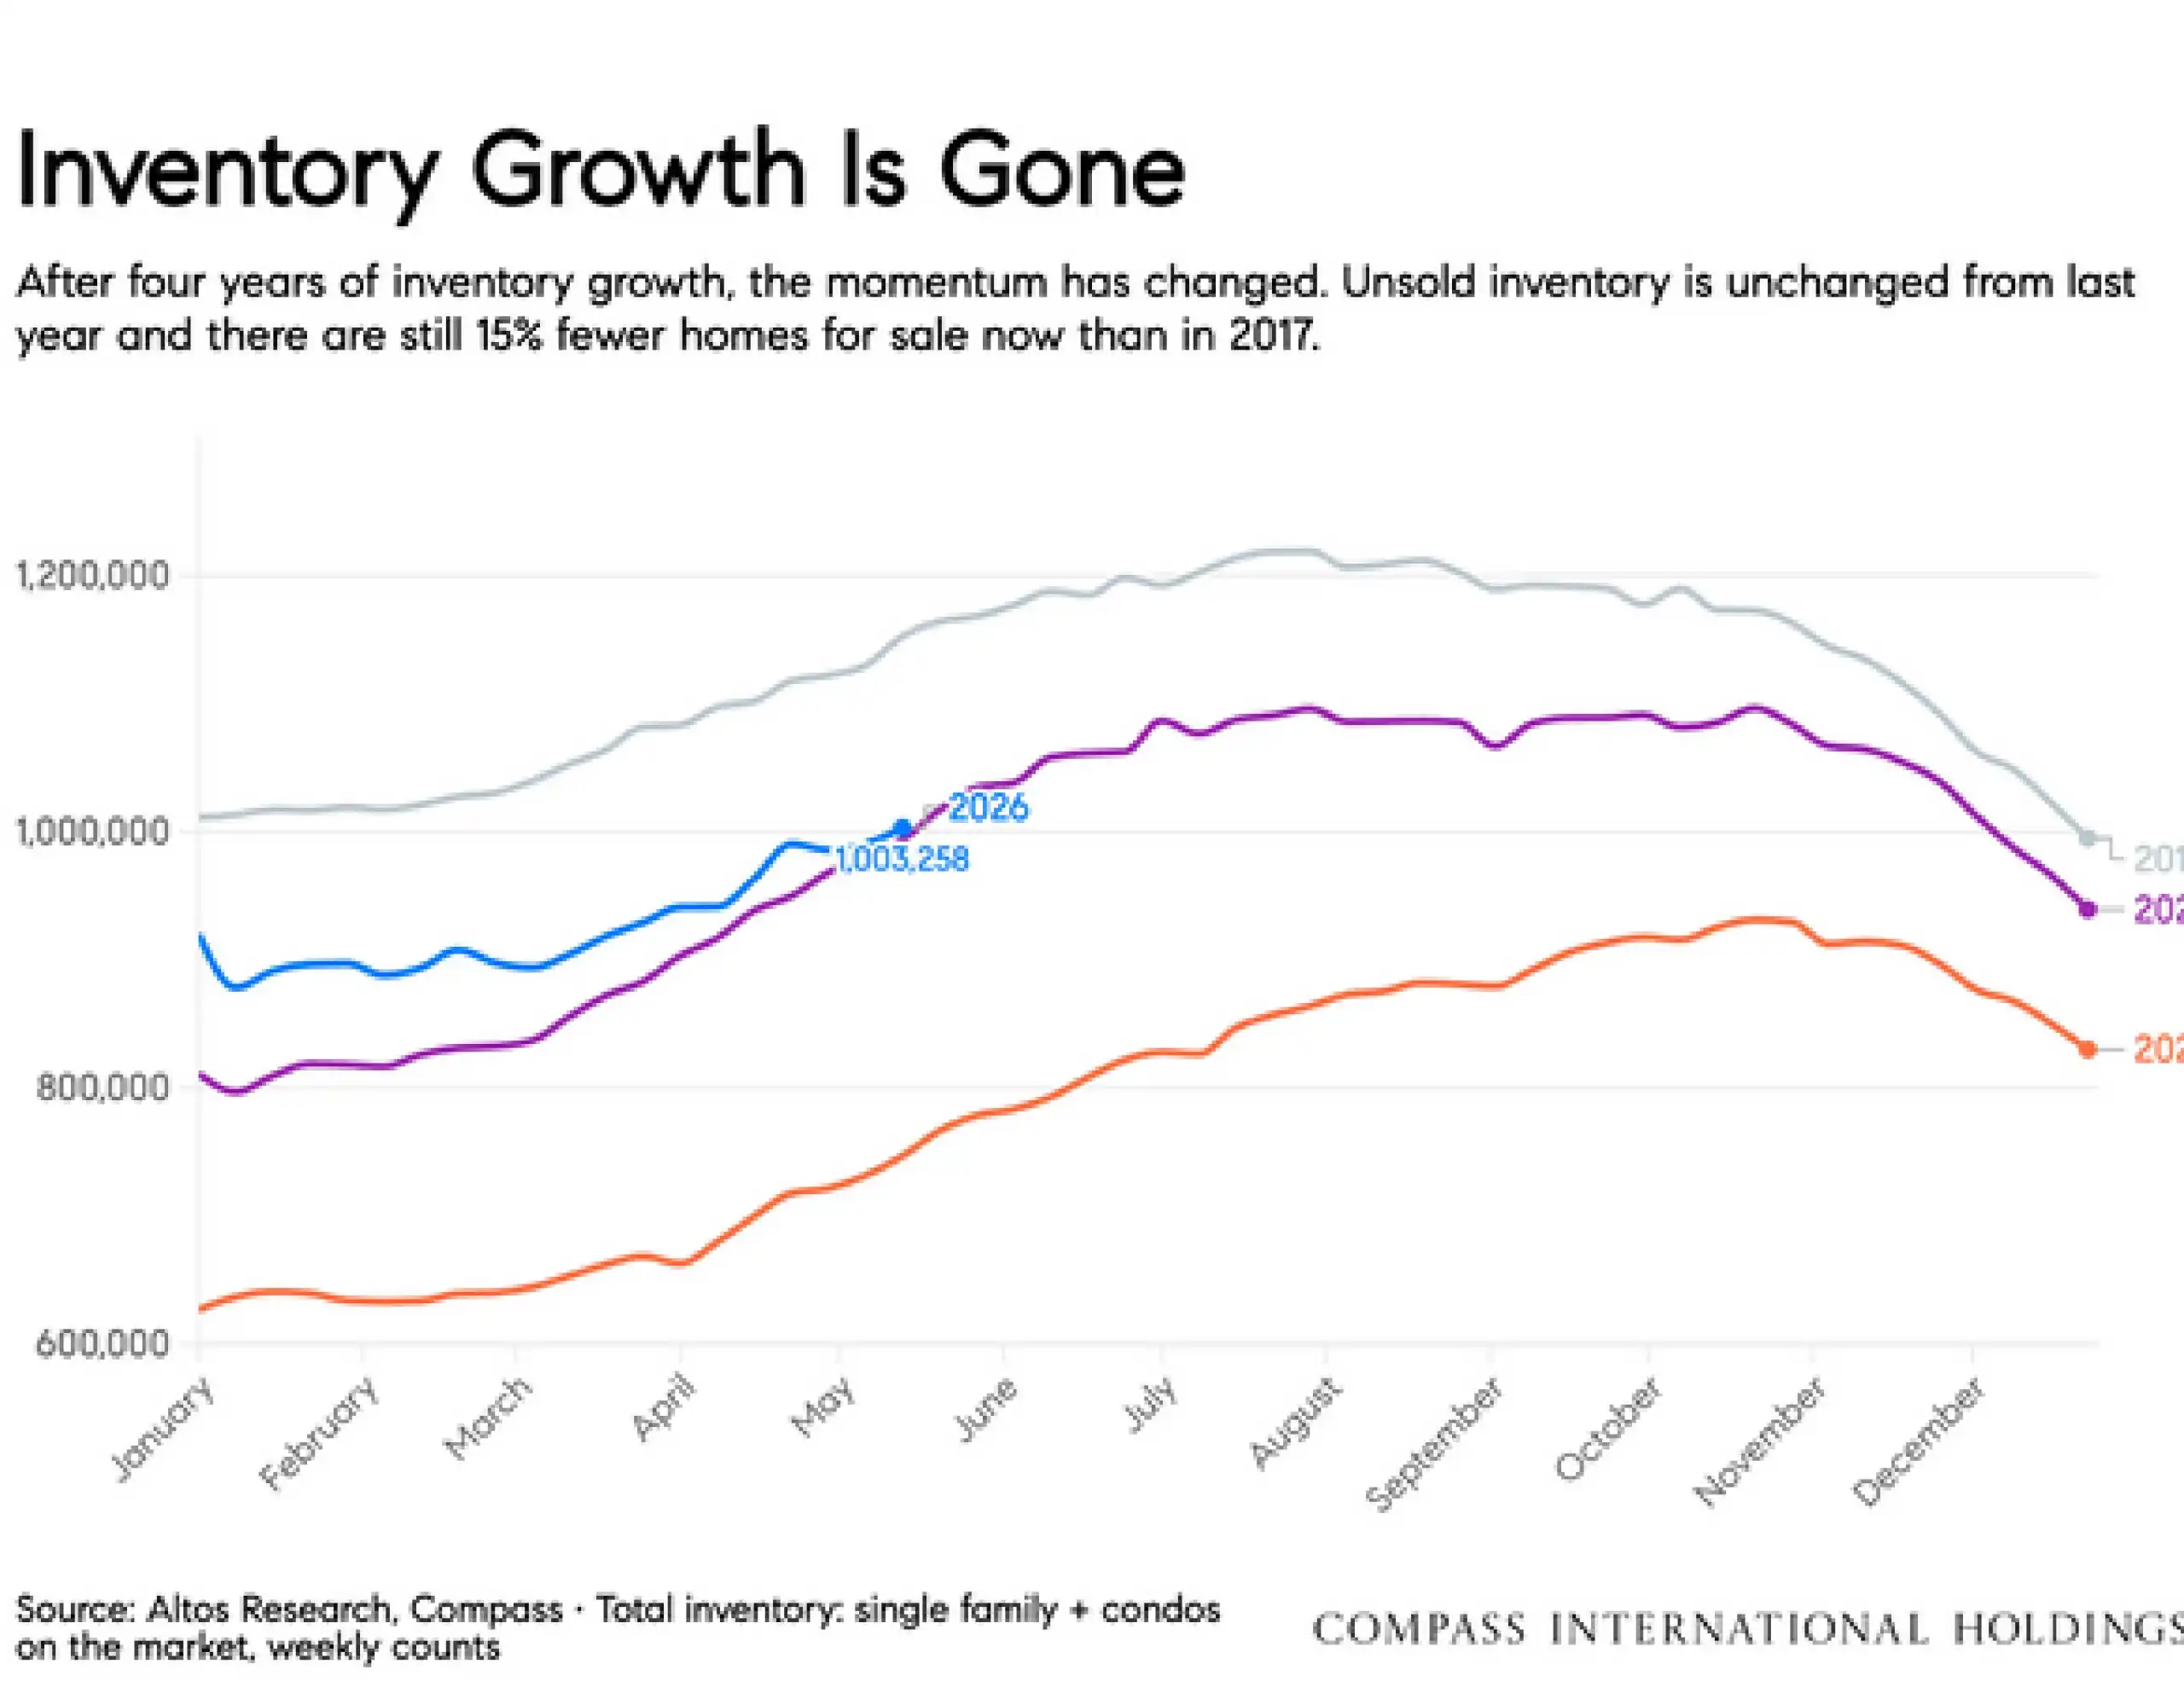
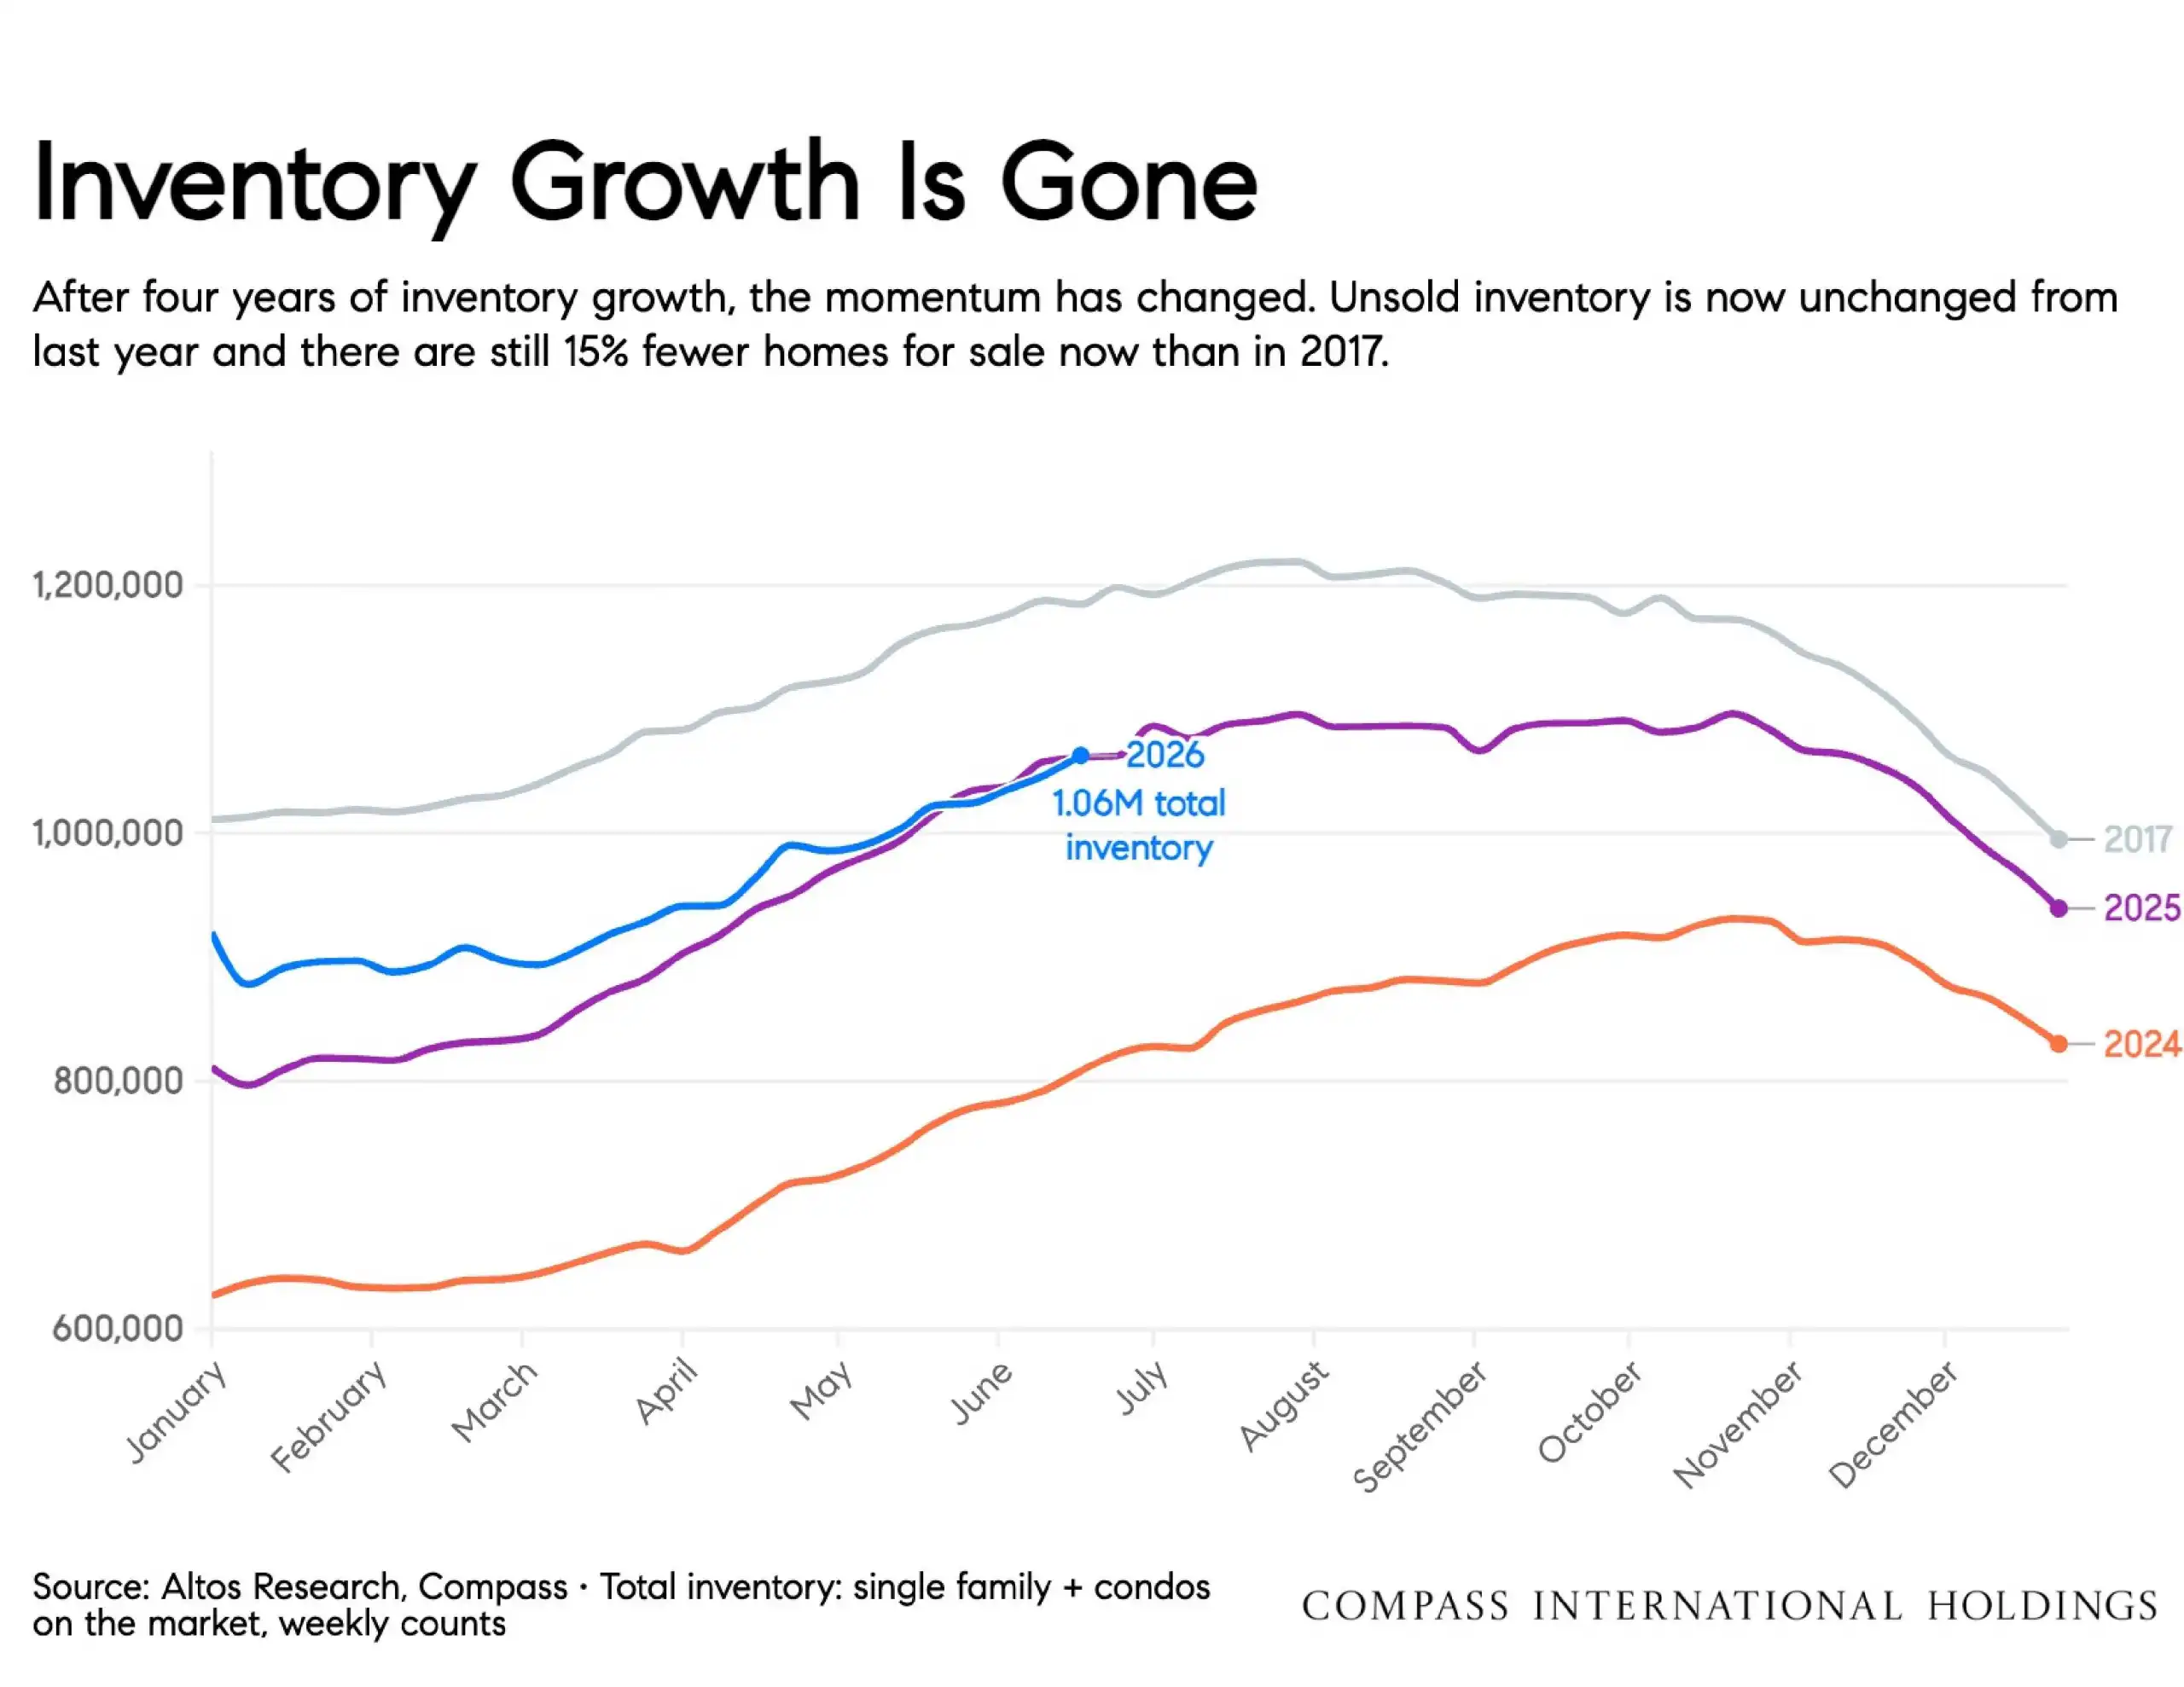
Inventory: After several years of national inventory growth, the supply of homes for sale is now roughly unchanged from last year.
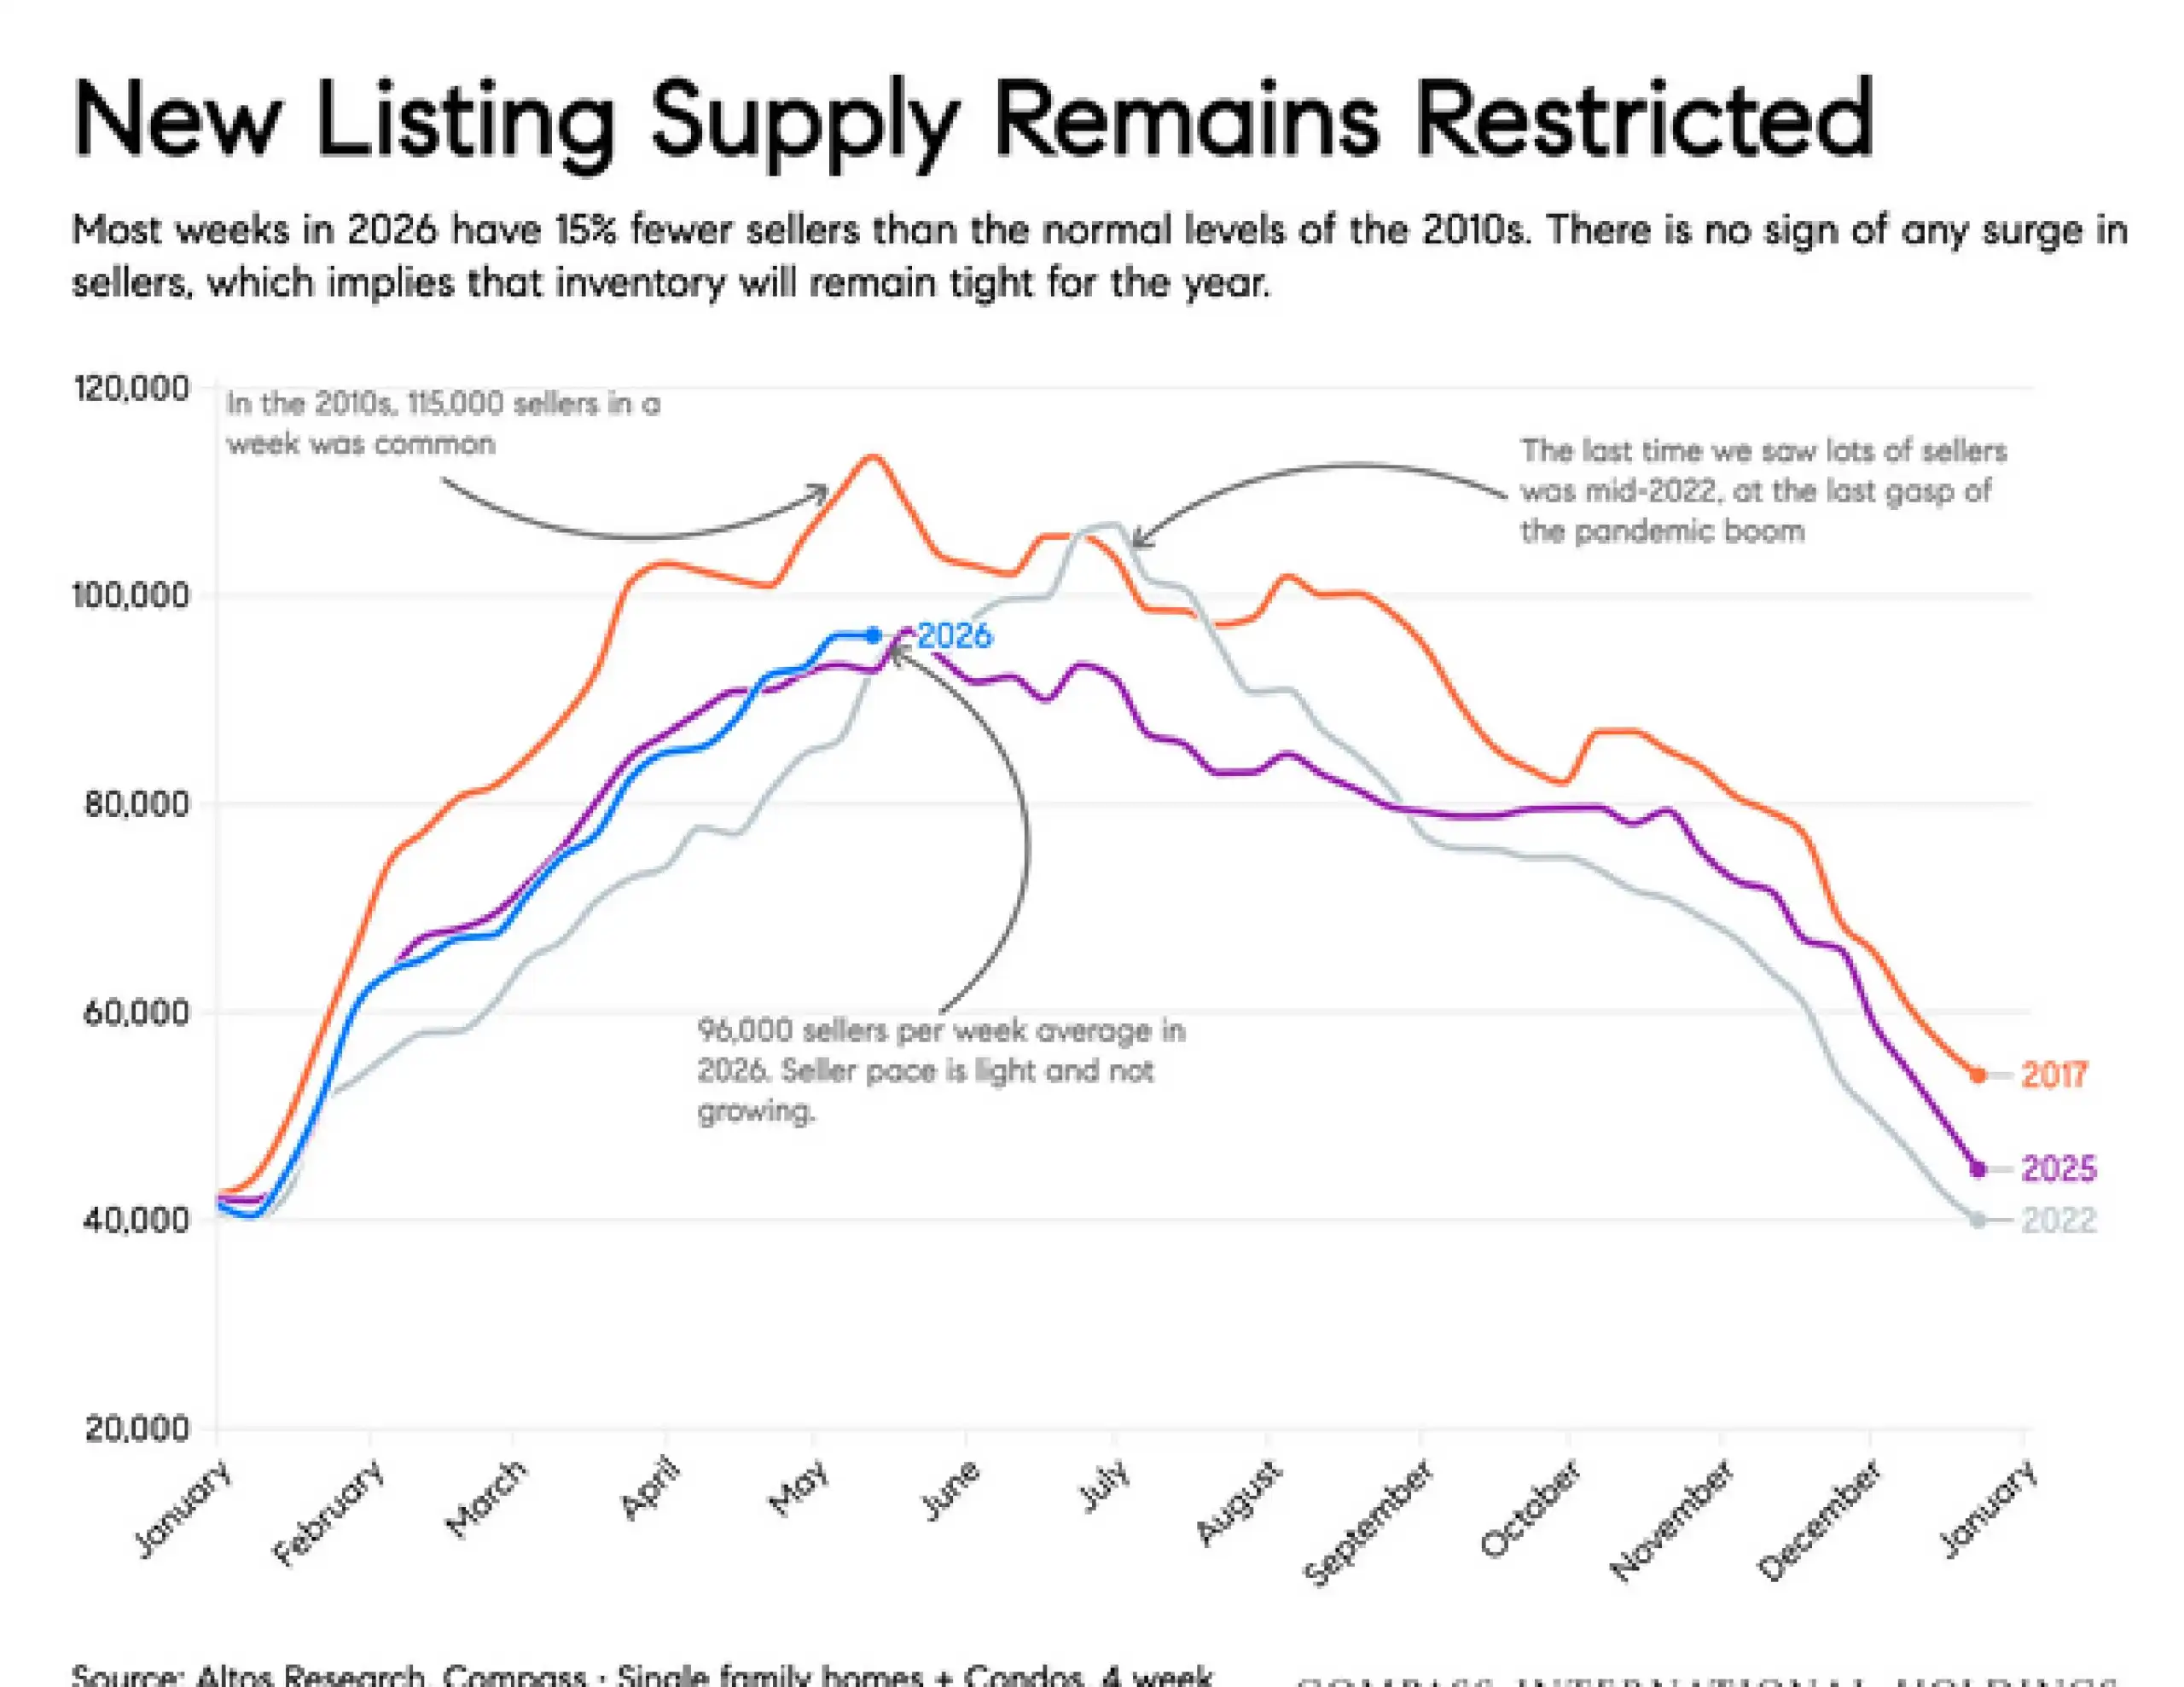
New Listings: New listing supply remains restricted, which may help support price stability if inventory continues to tighten.
Pending Sales: Pending activity improved modestly from January and year over year.
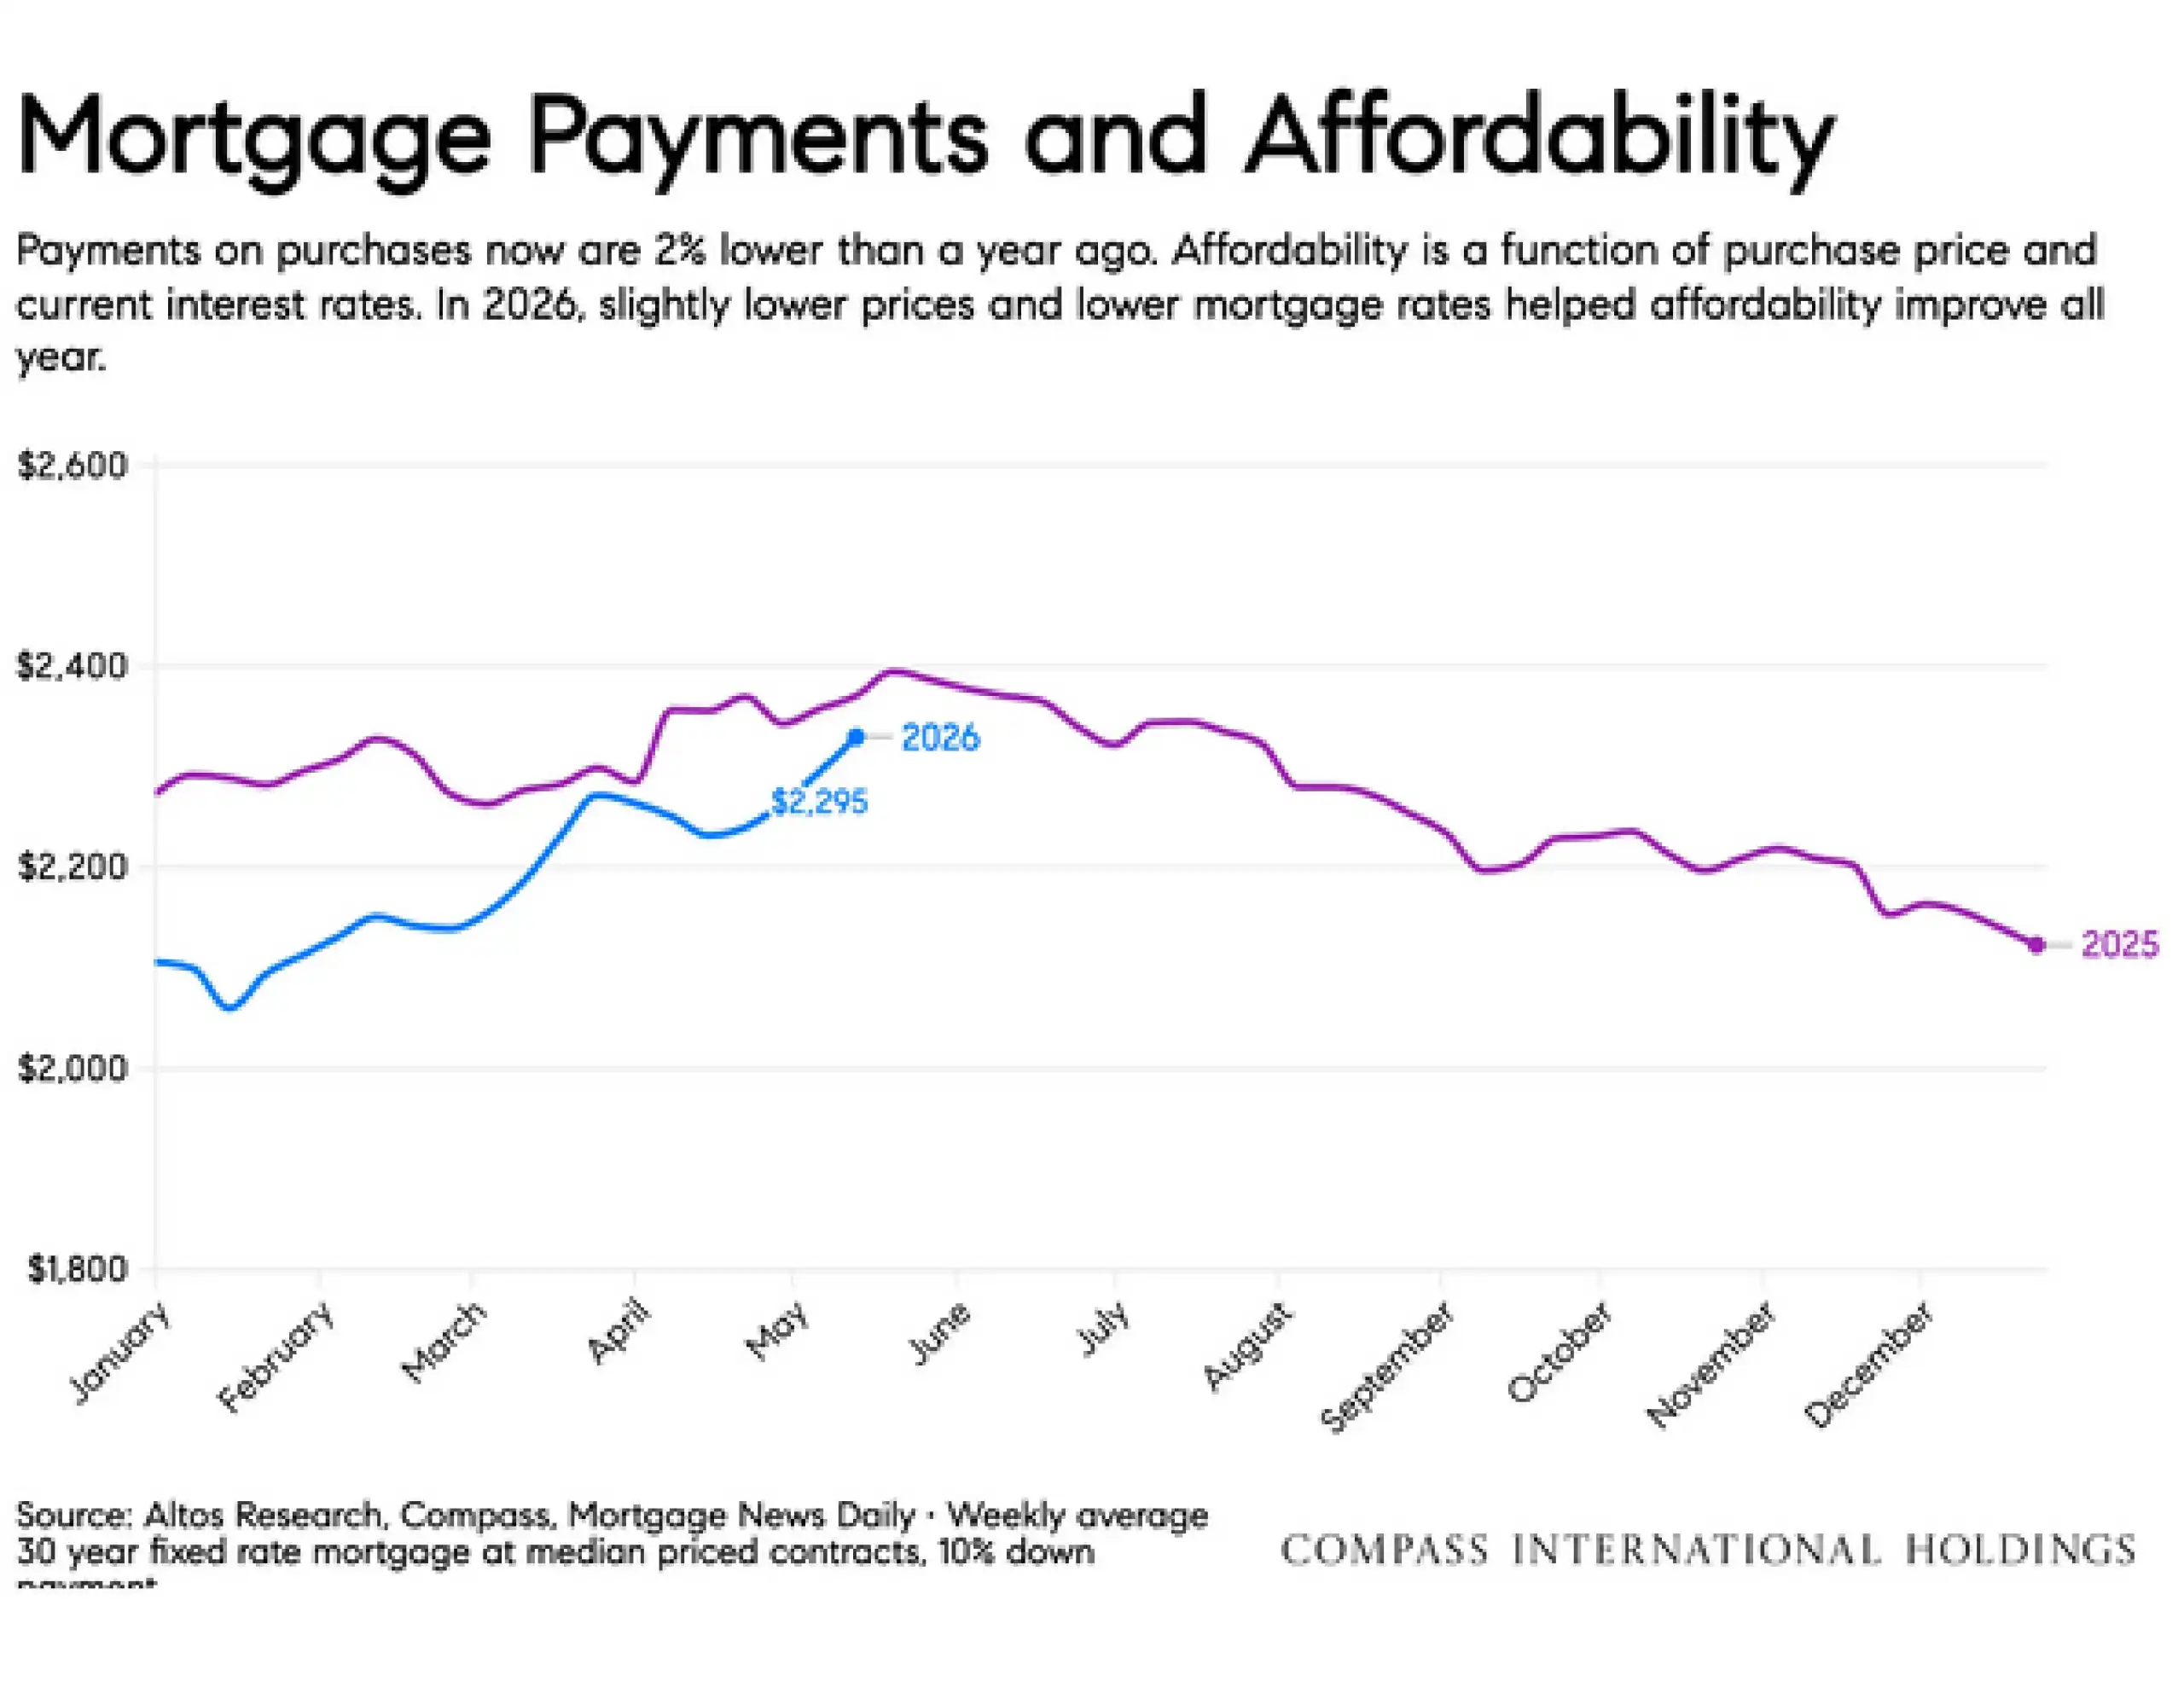
Affordability: Monthly payments are slightly lower than a year ago, but affordability remains a major factor for buyers.
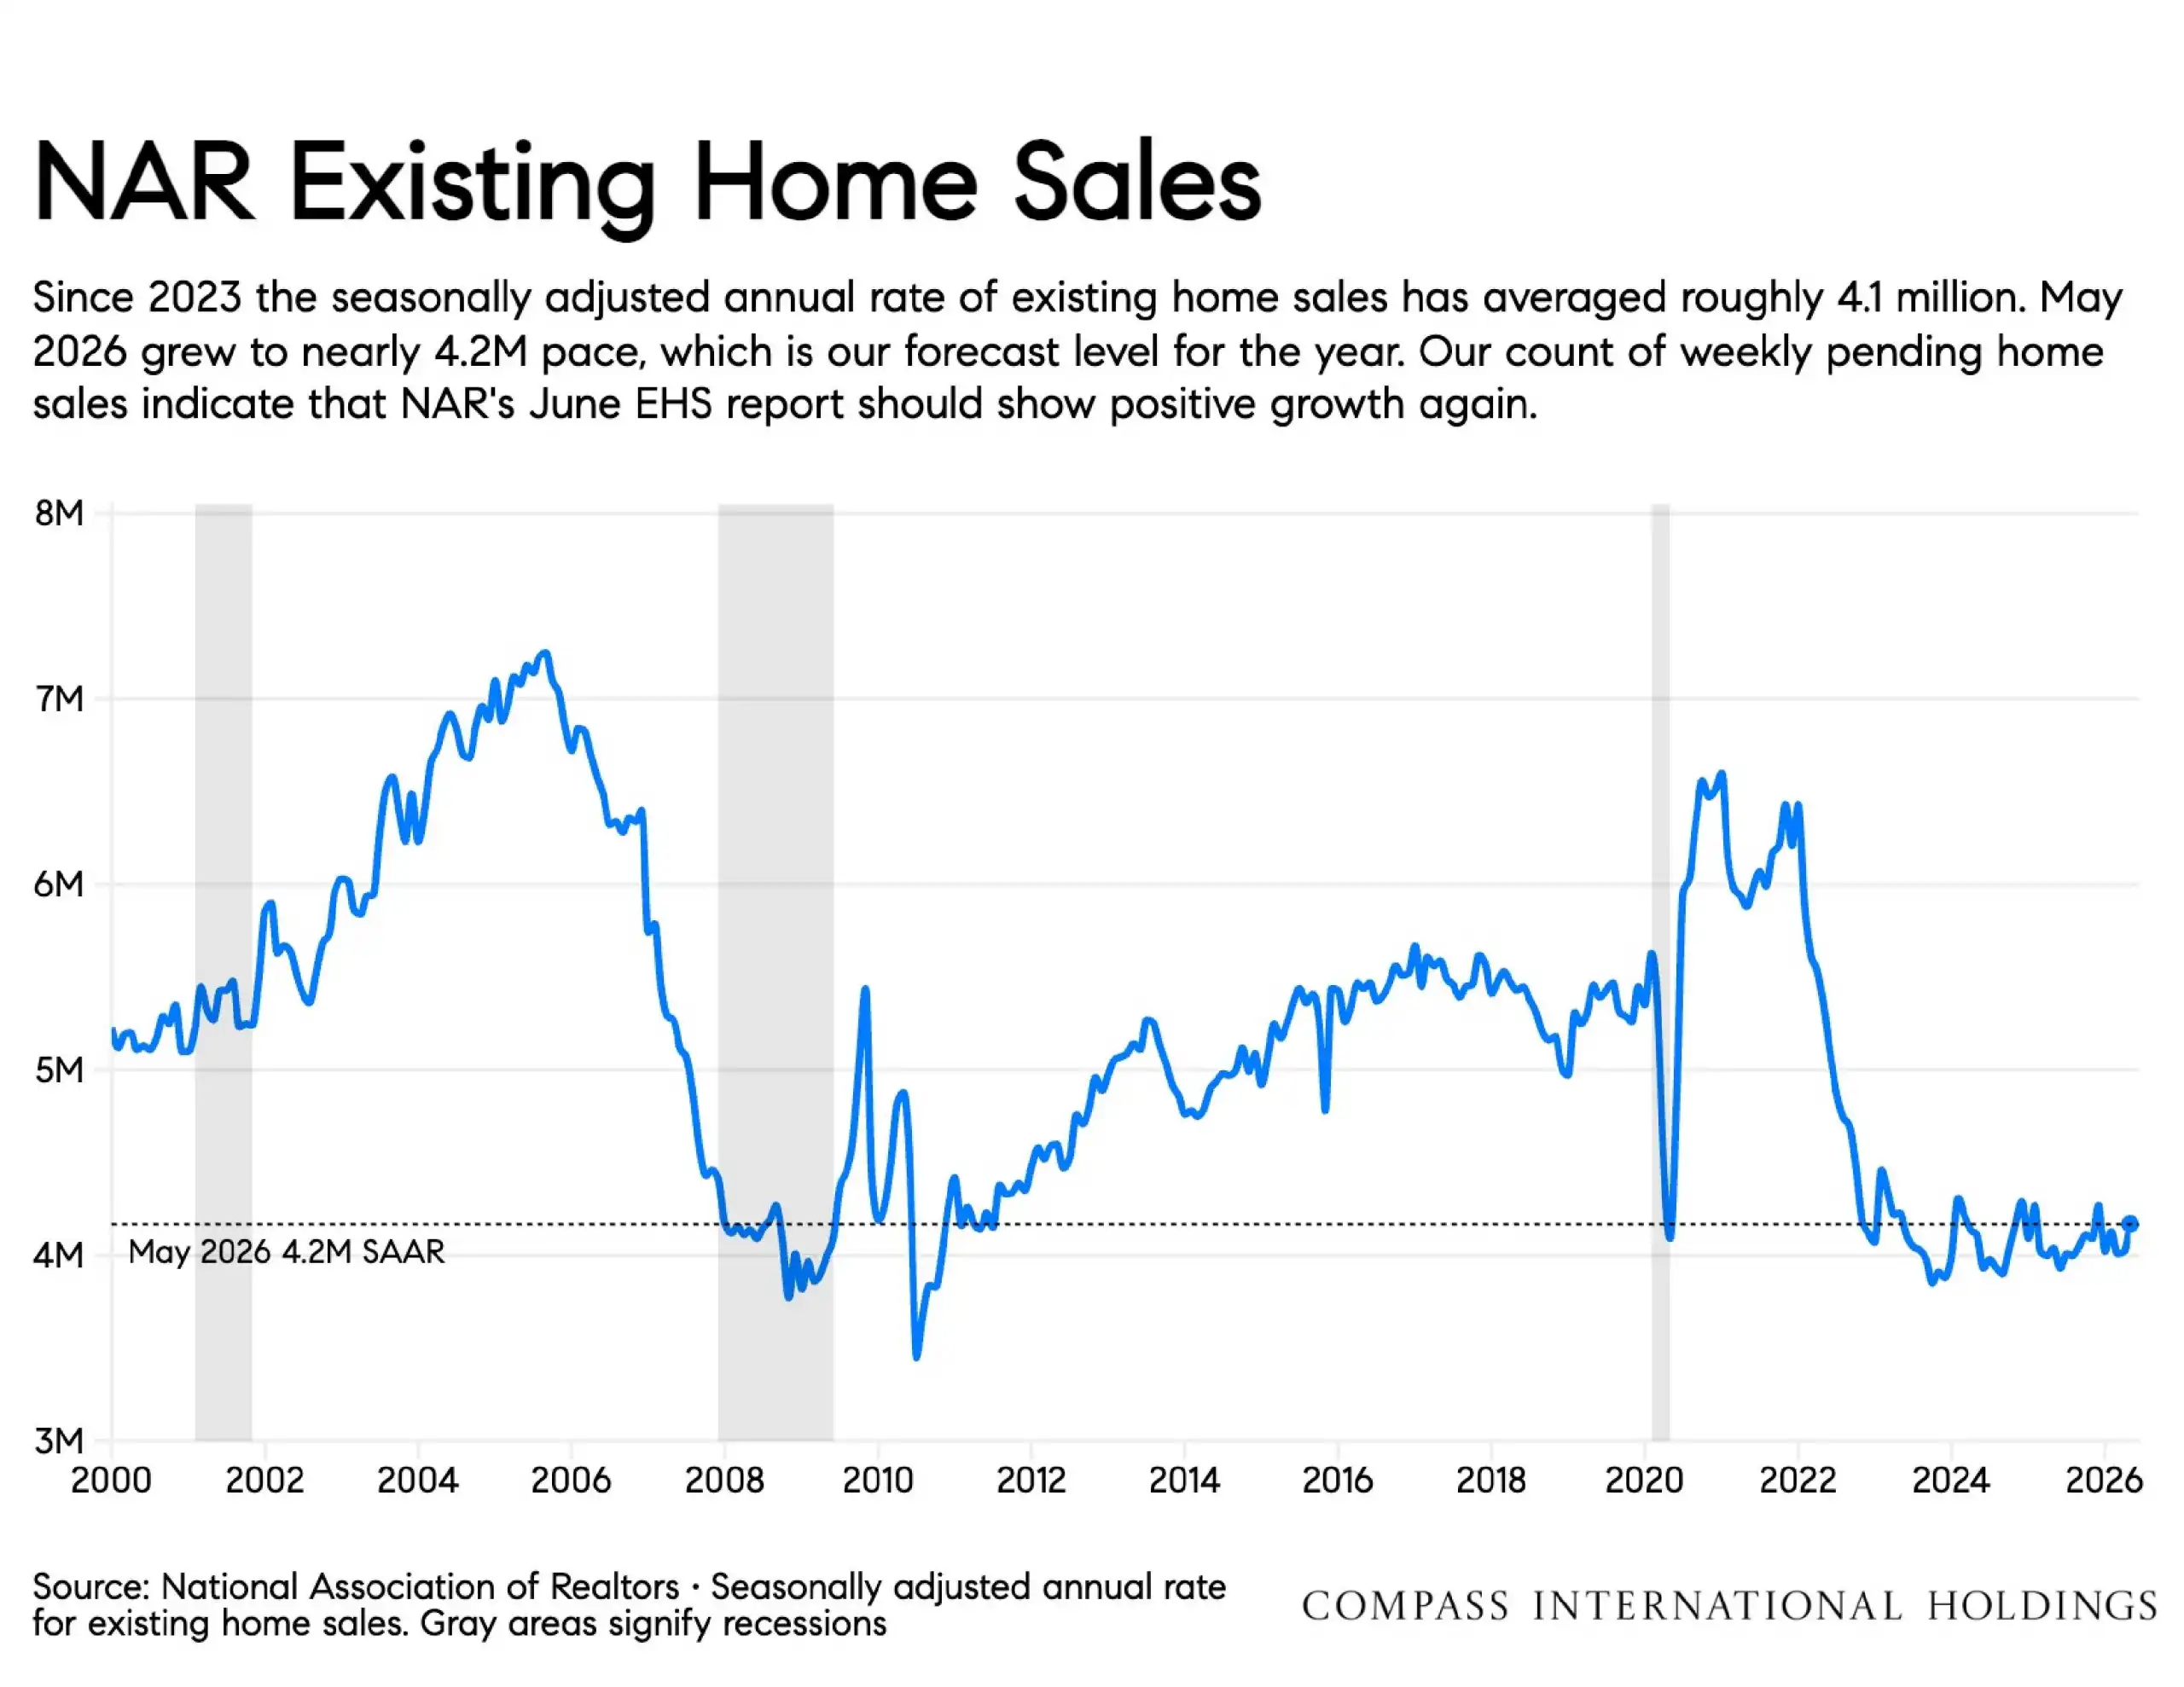
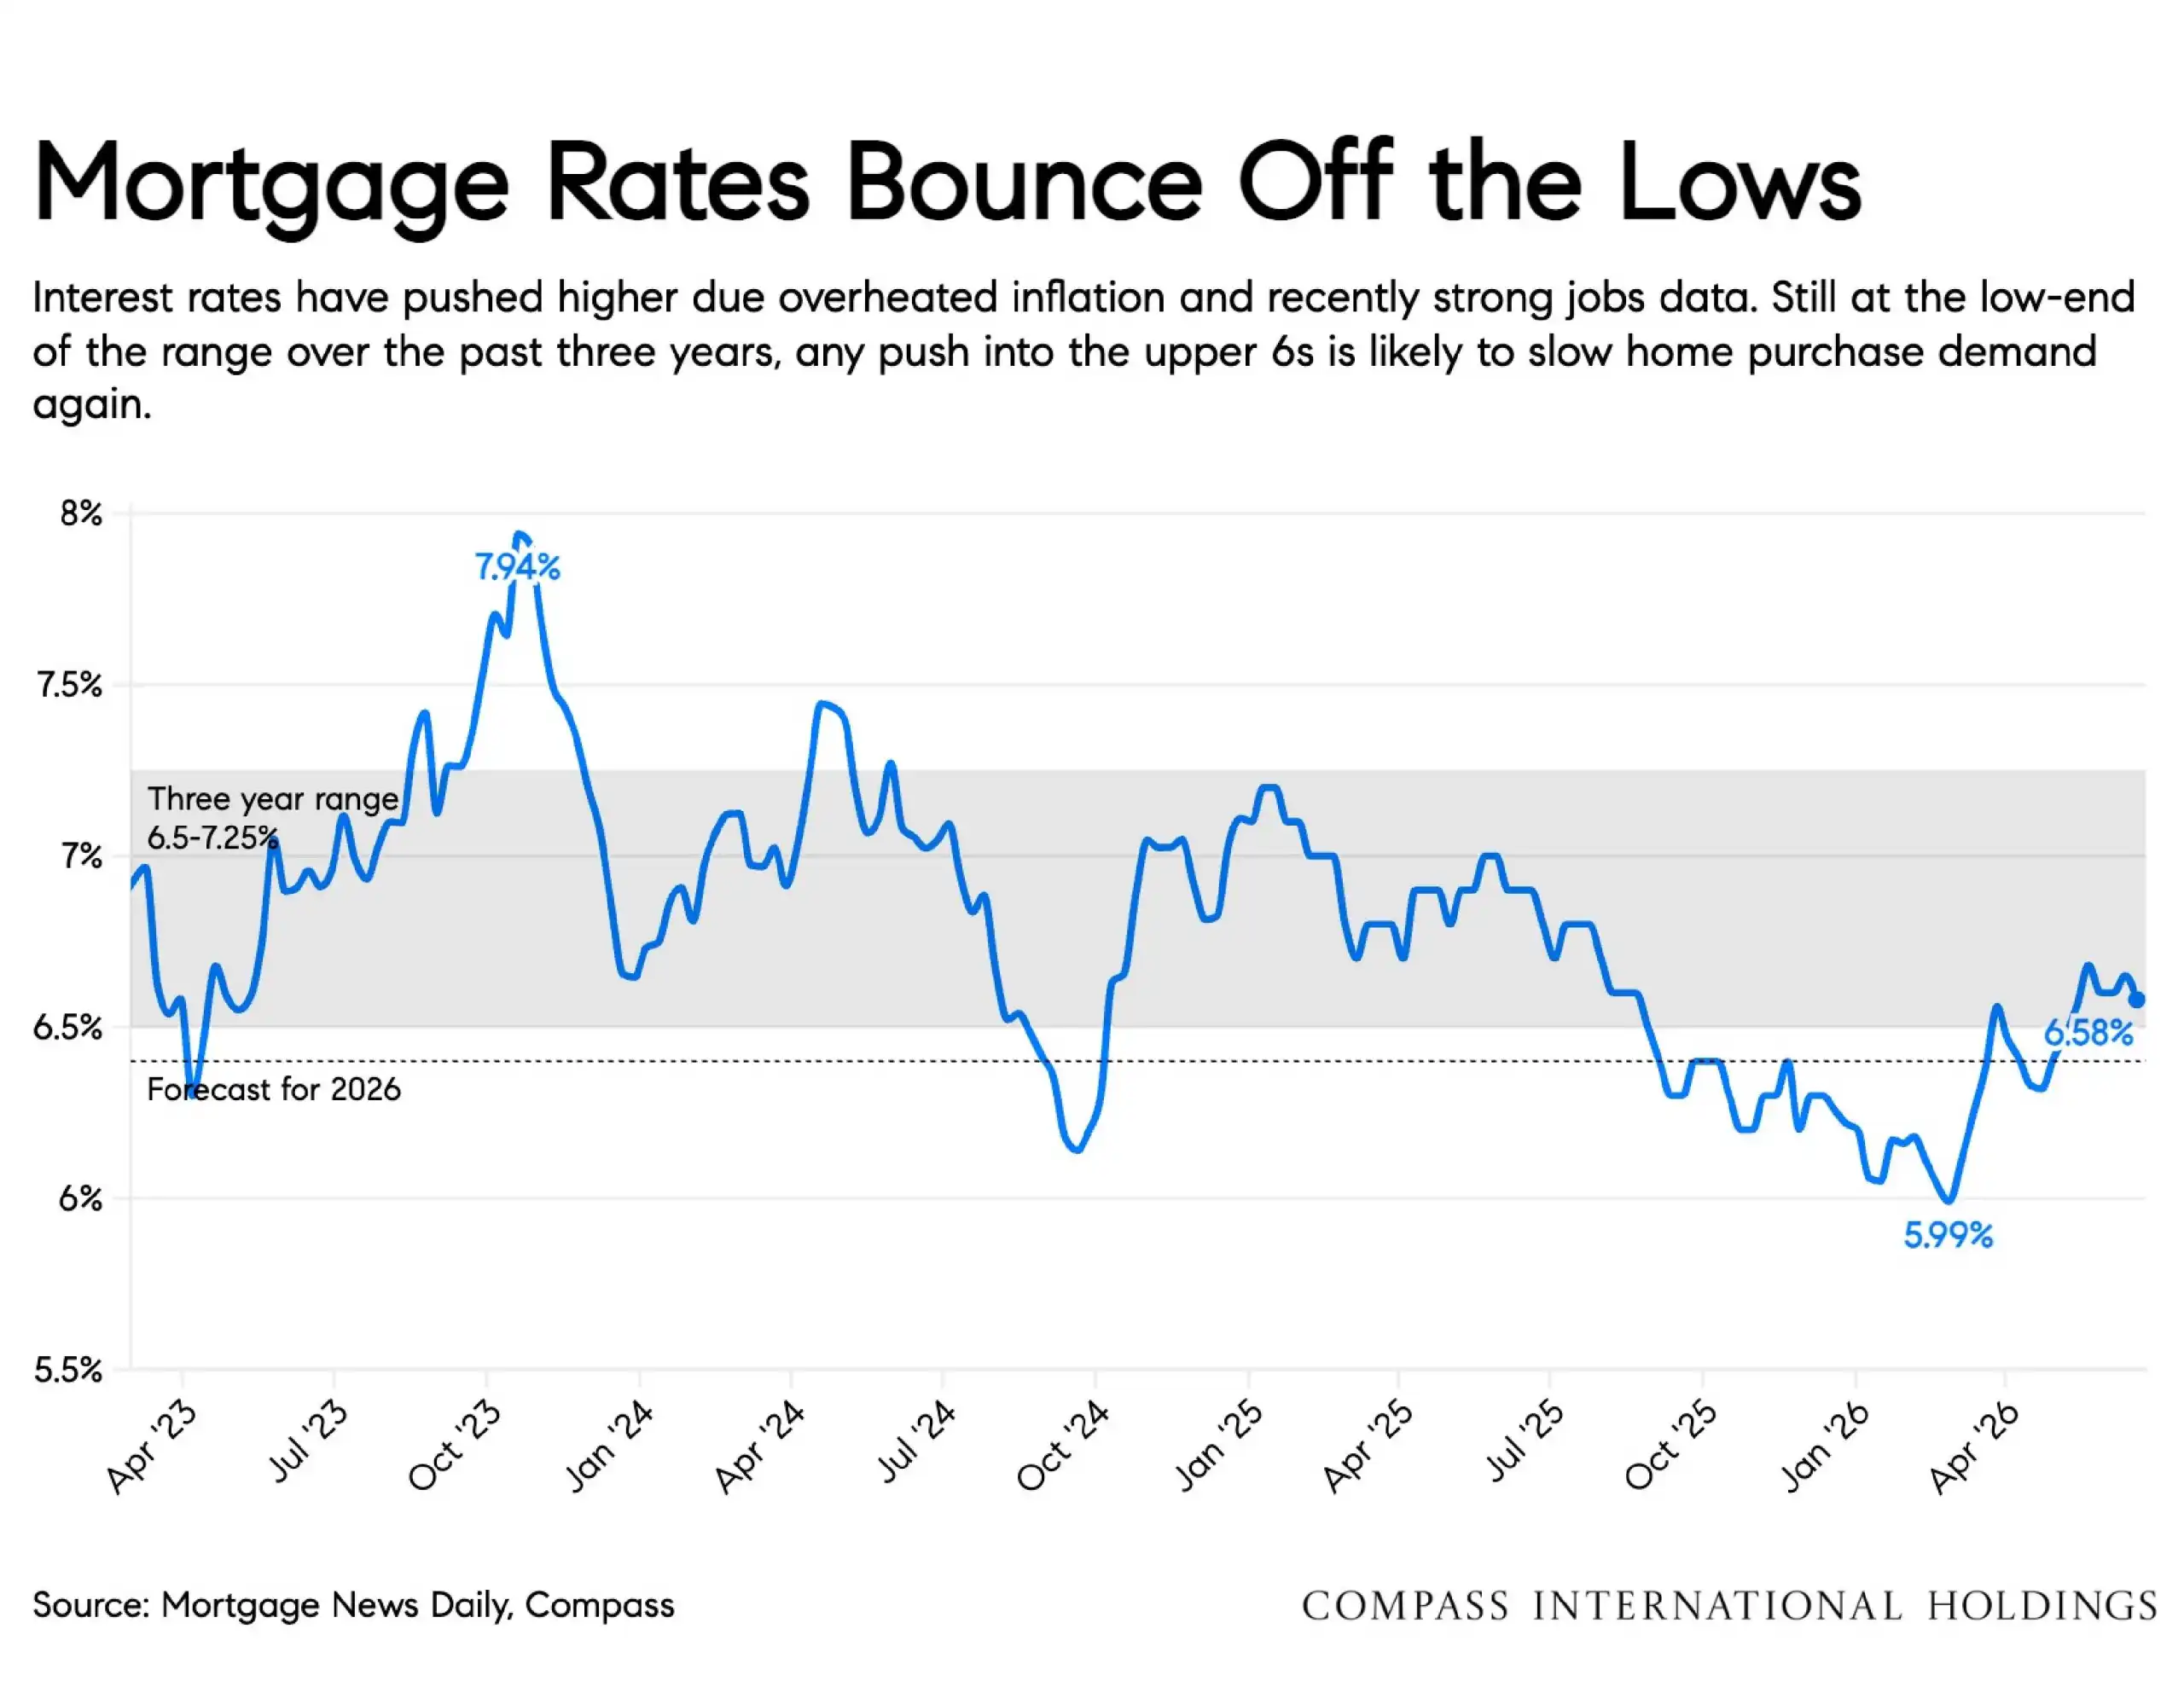
The June 2026 report shows a national housing market that continues to move forward, but with more caution than urgency. Pending sales improved compared with 2025, existing-home sales showed signs of gradual recovery, and inventory growth slowed after several years of increases. At the same time, mortgage rates moved back into the mid-to-upper 6% range, inflation remained elevated, and affordability continued to shape buyer behavior.
Market at a Glance
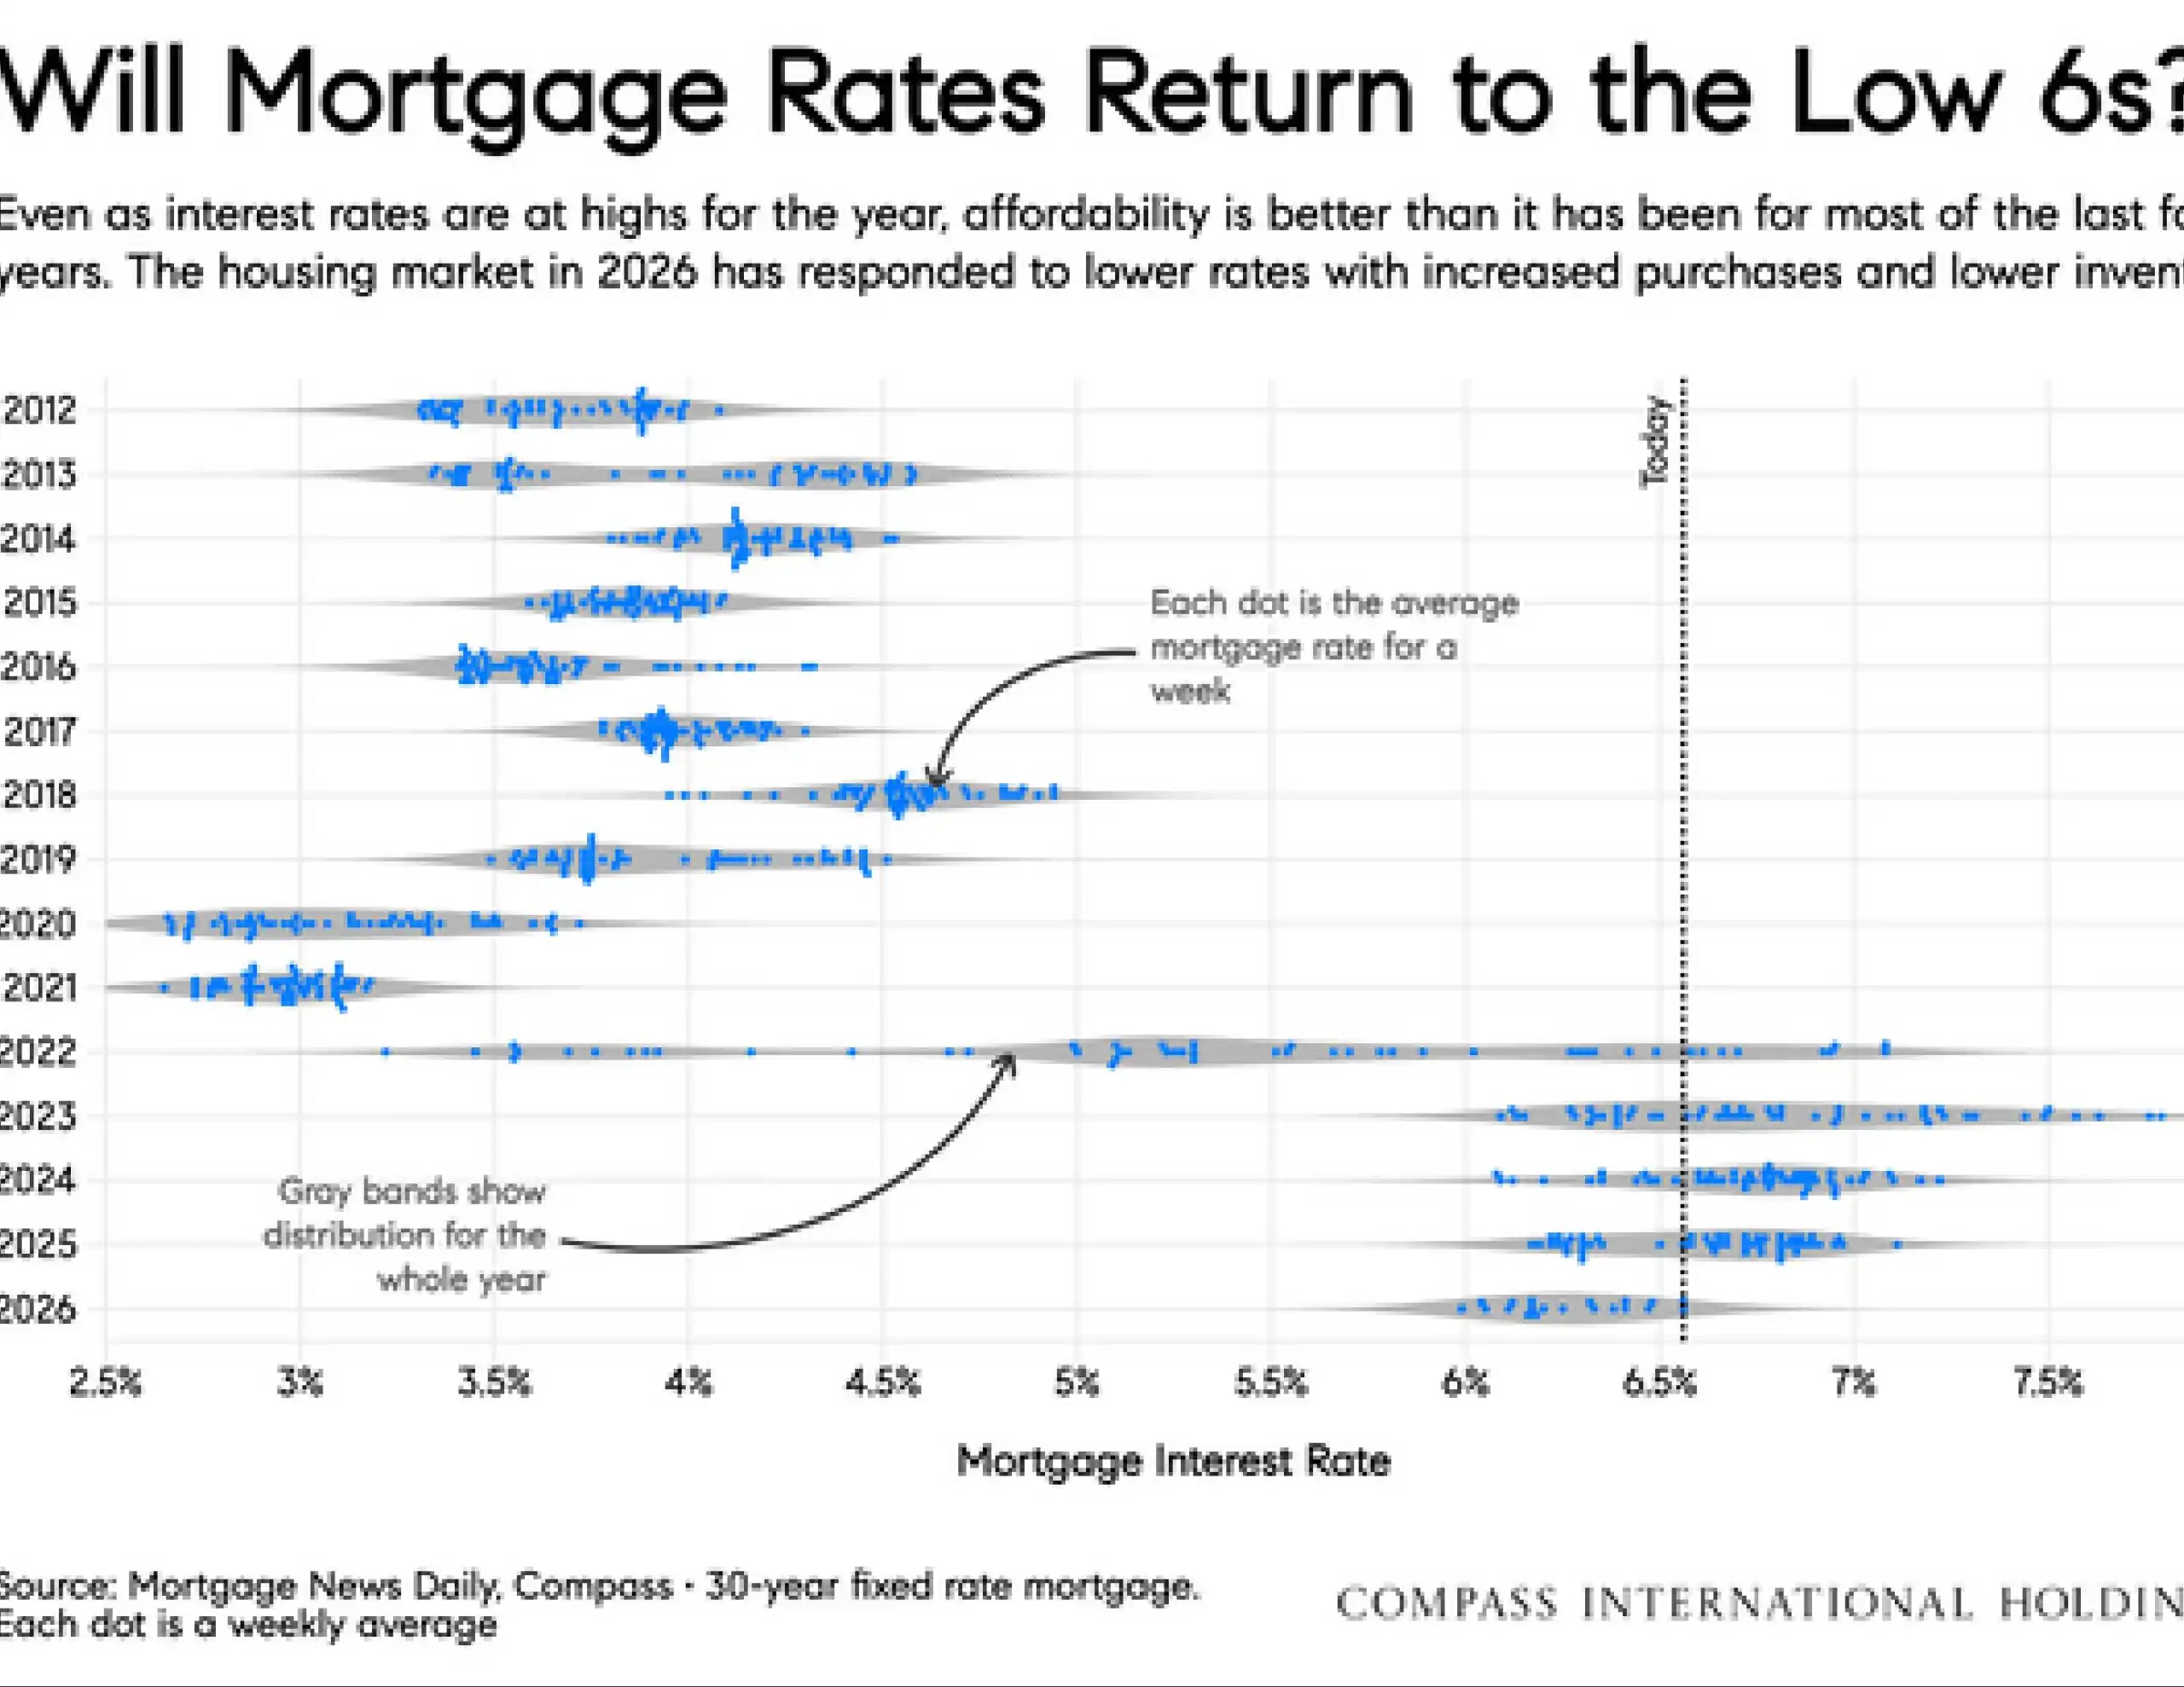
Mortgage Rates: Rates bounced off recent lows and moved back near the mid-to-upper 6% range.
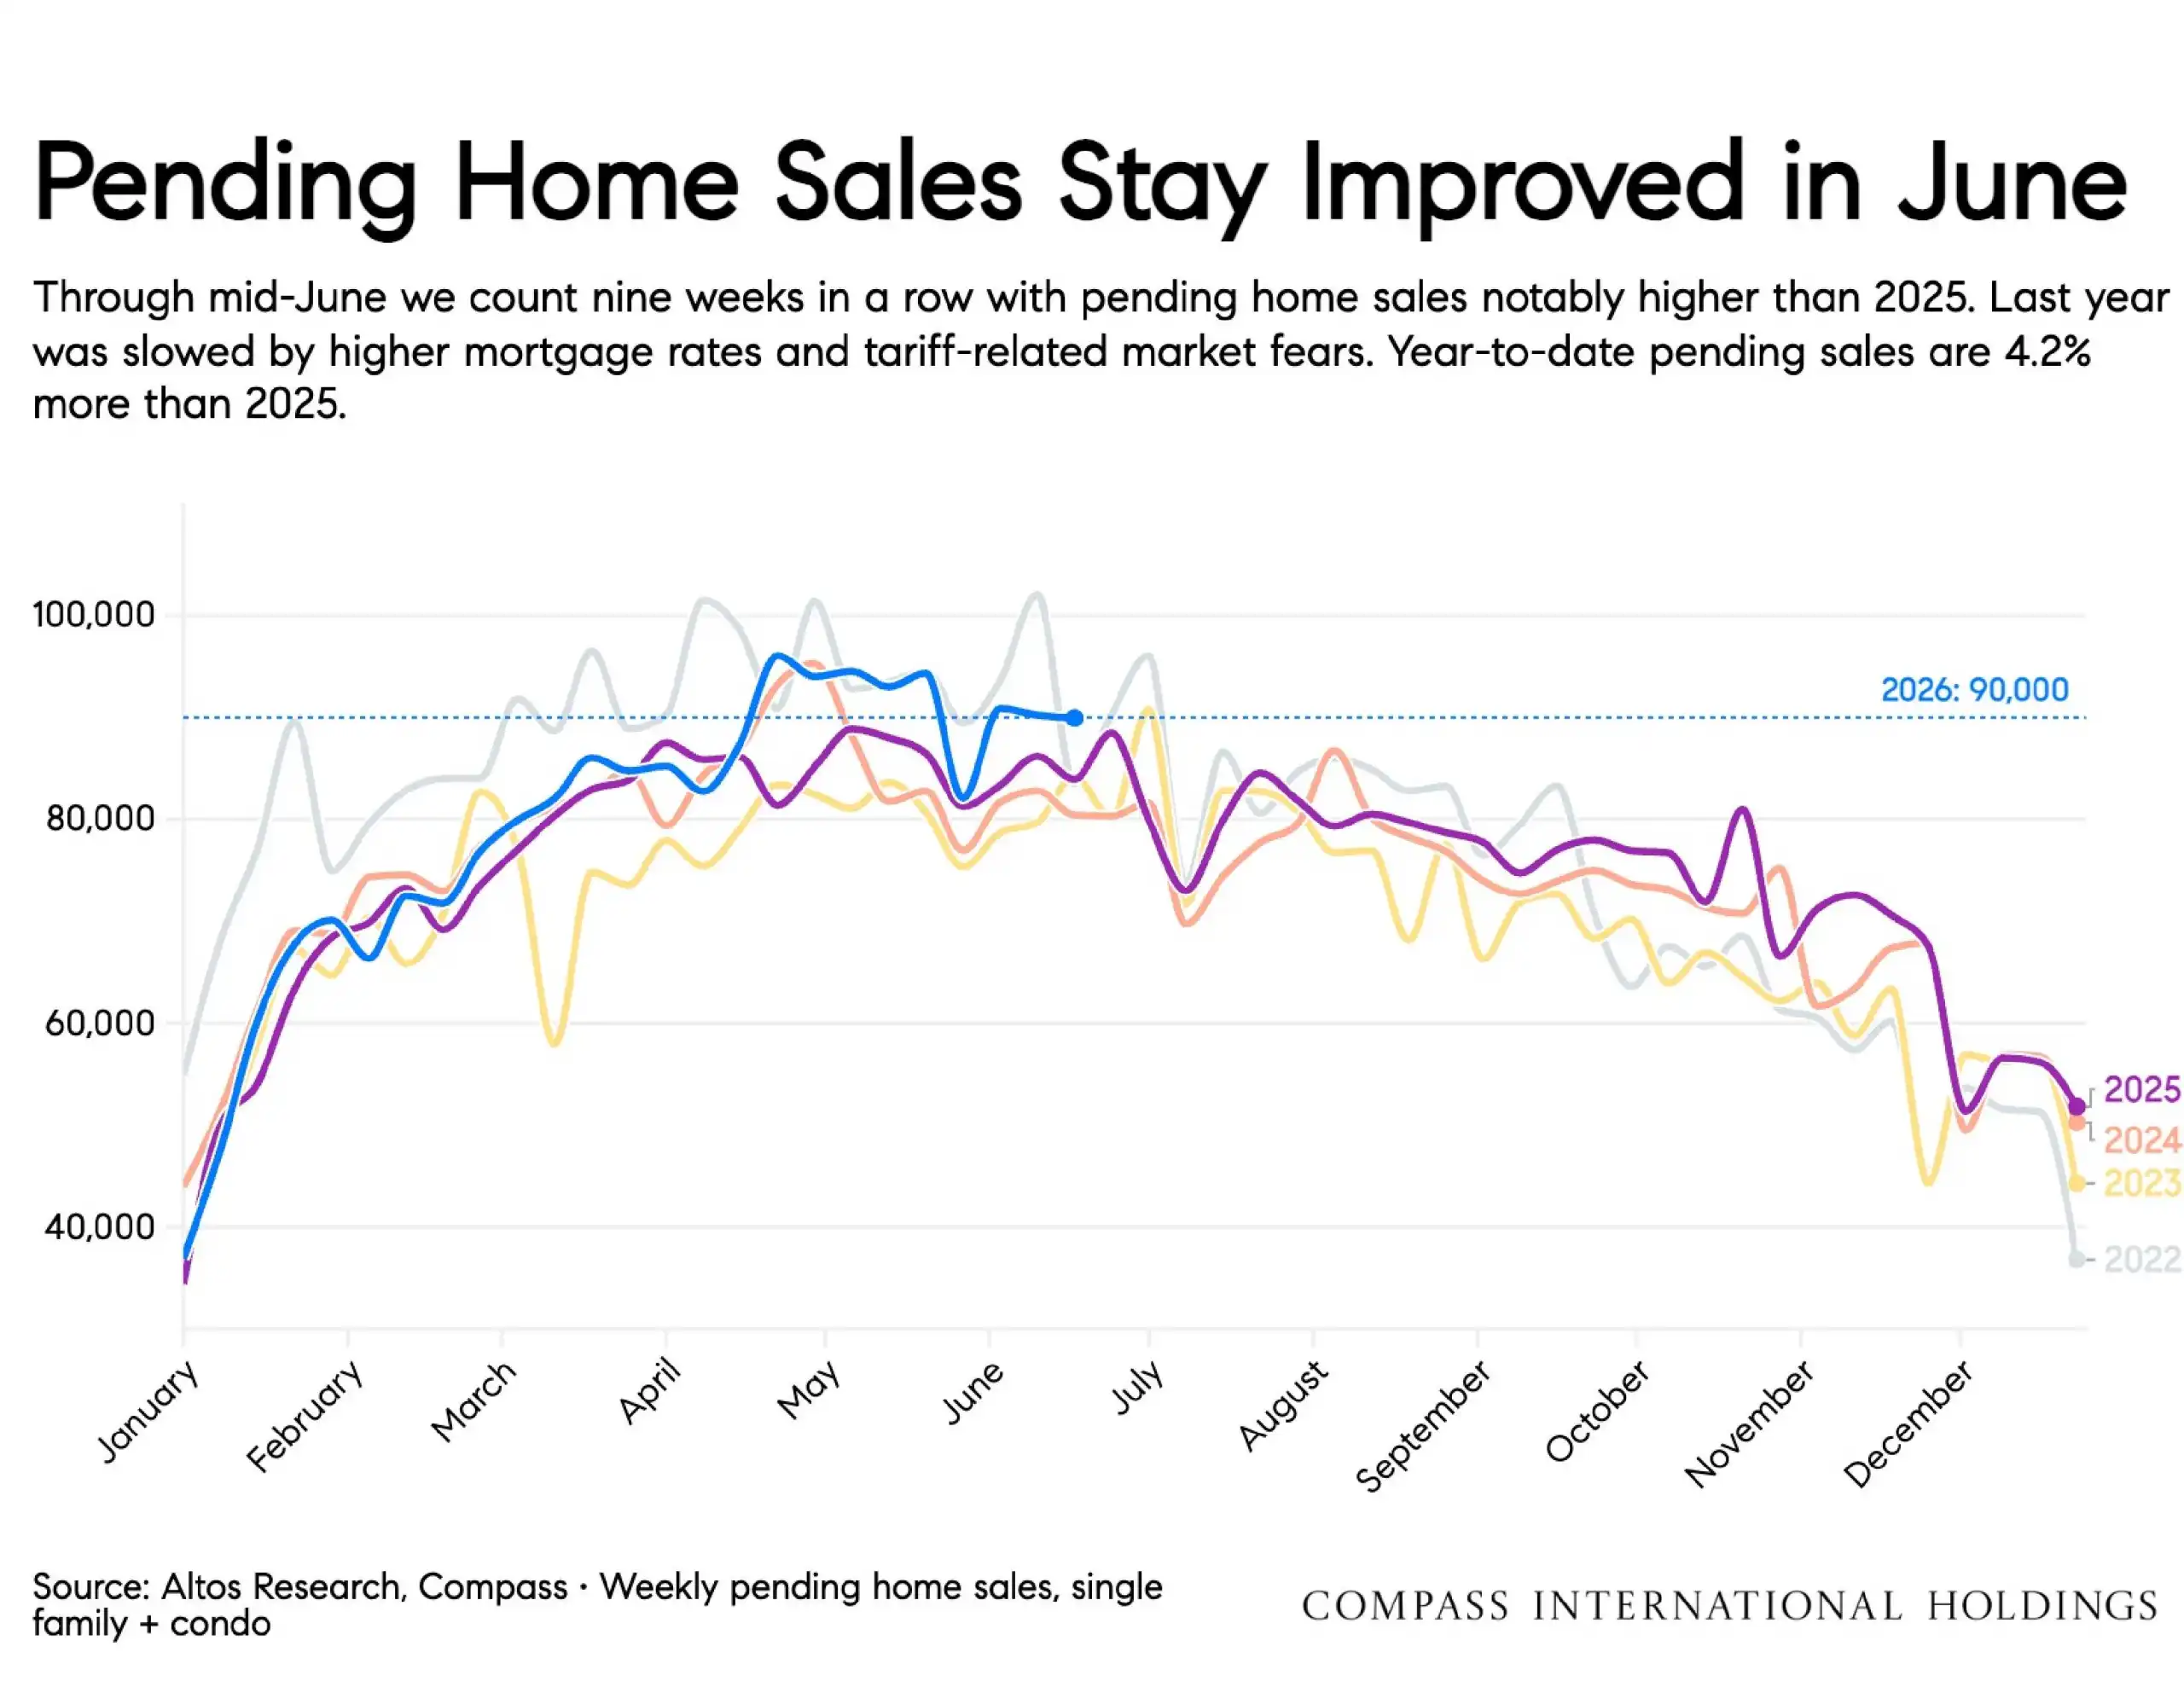
Pending Sales: Pending home sales were stronger than 2025 through mid-June.
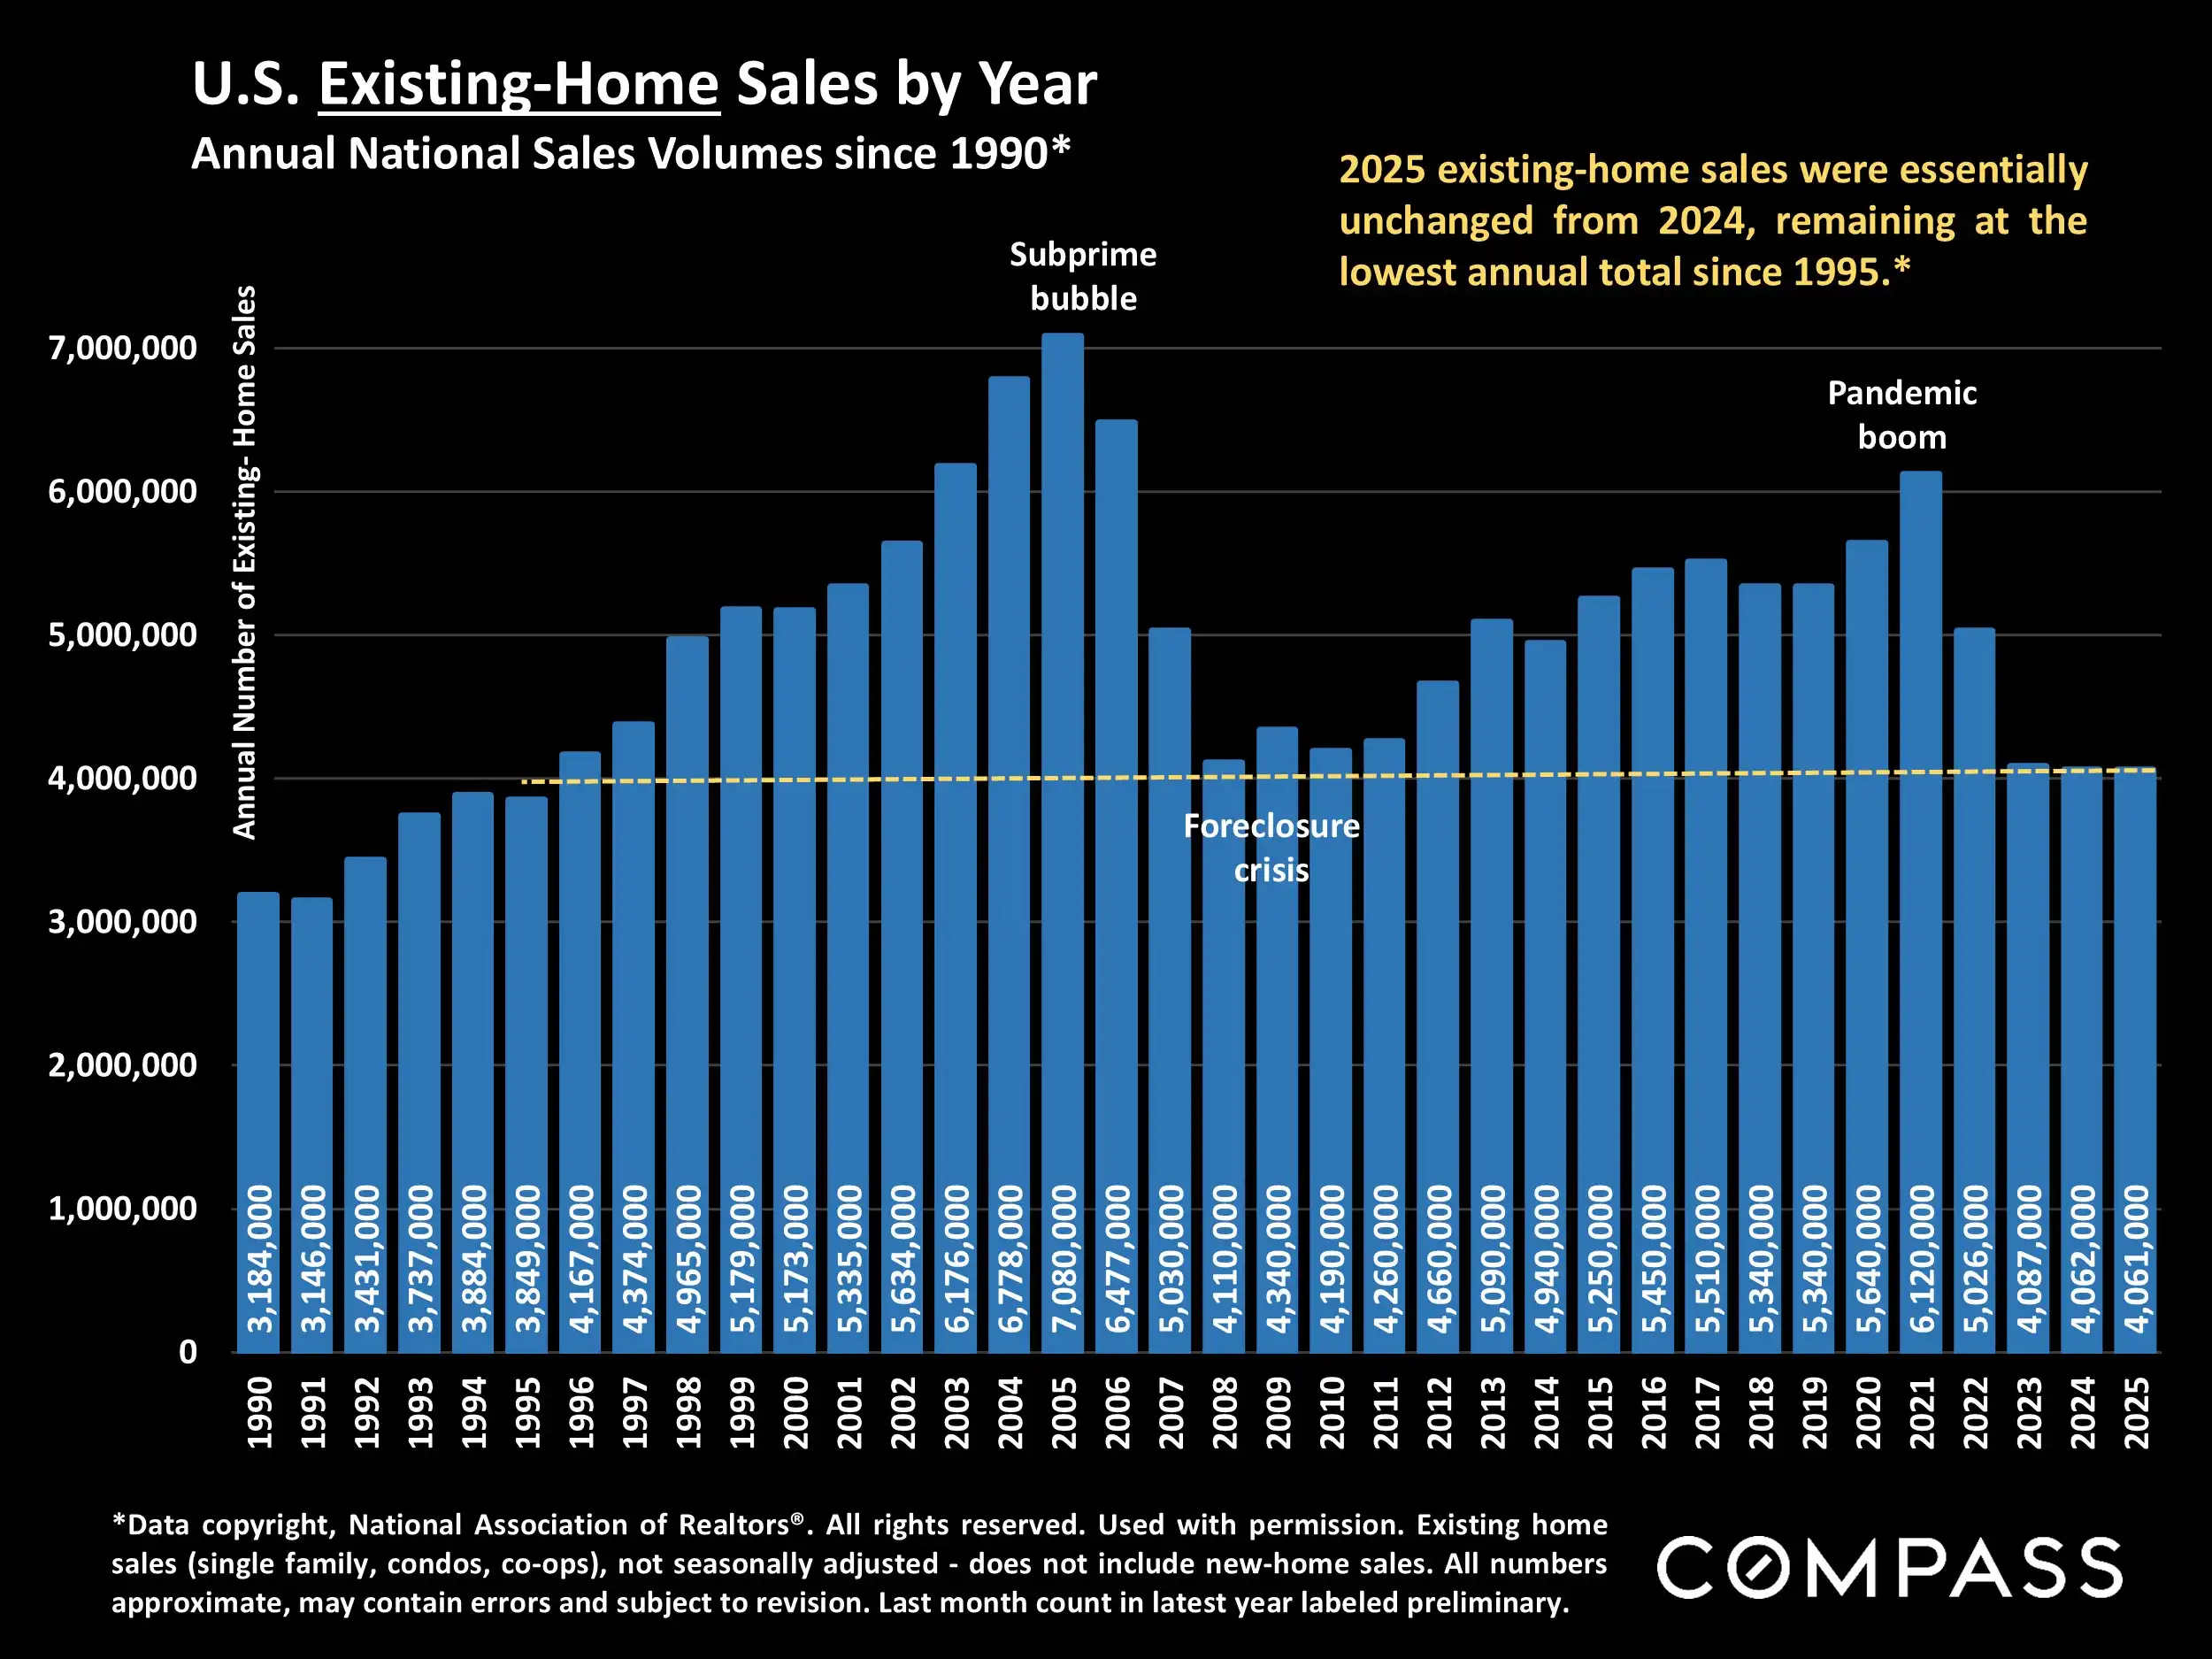
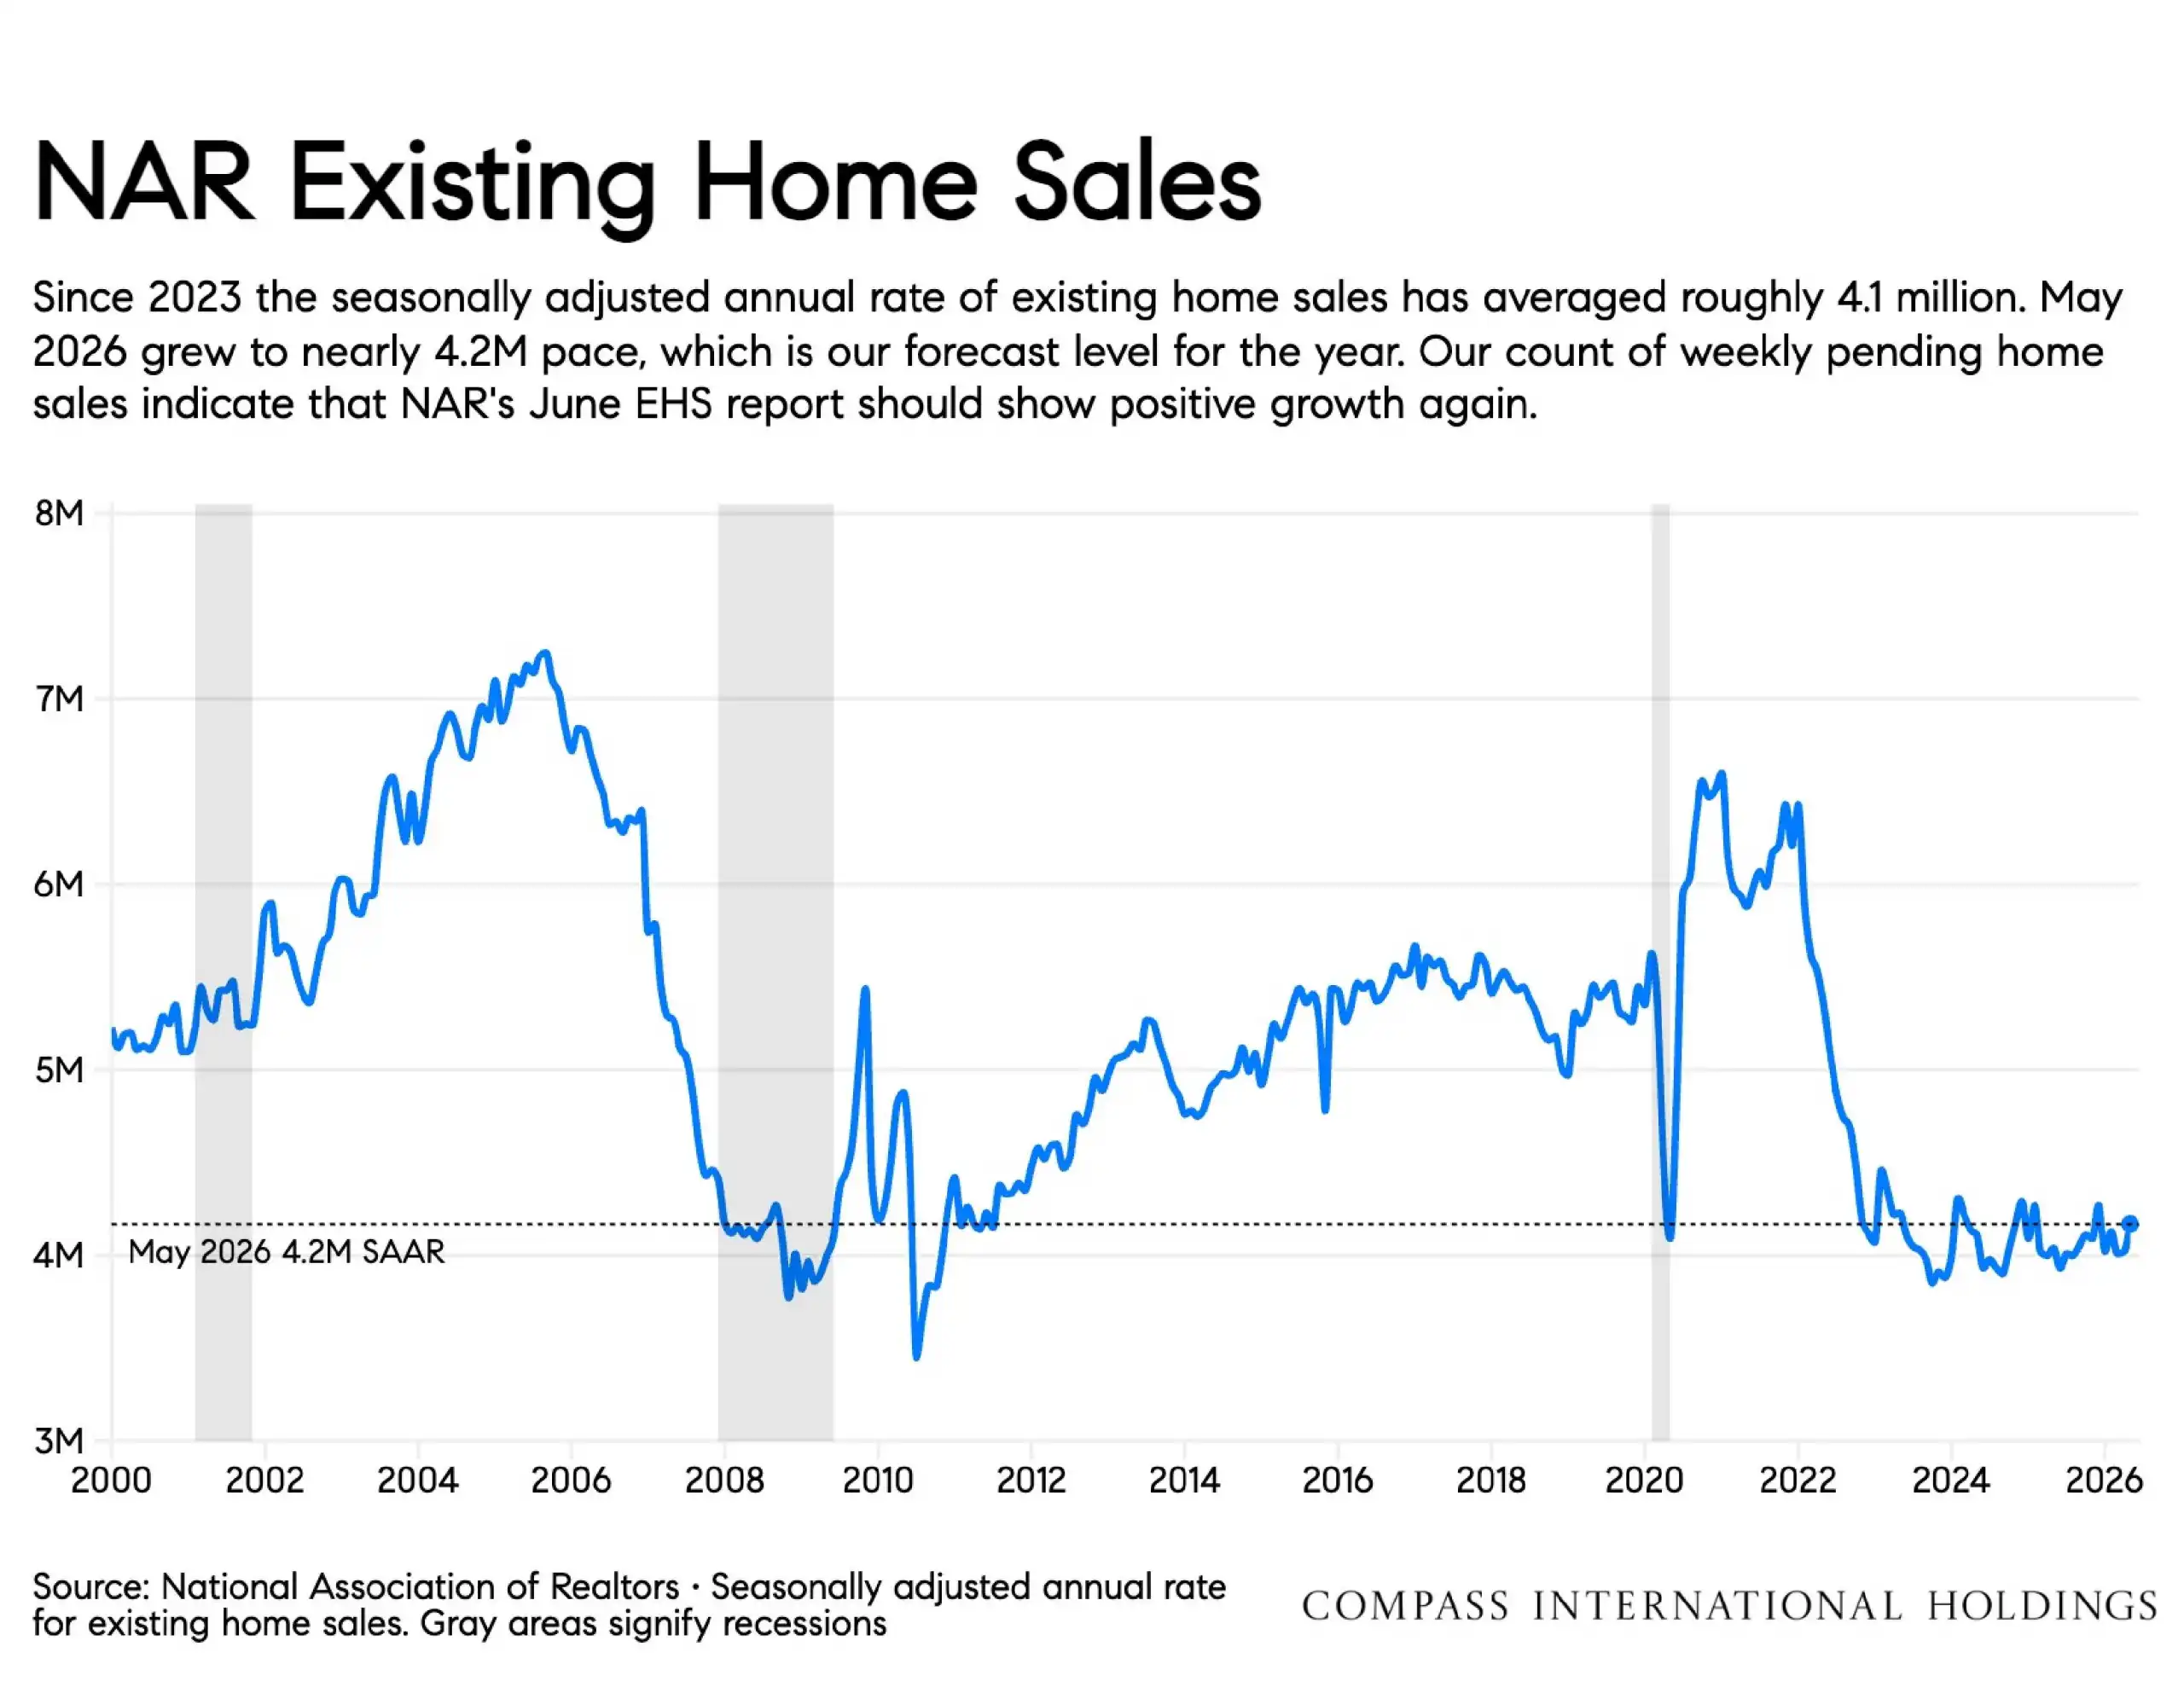
Existing-Home Sales: May existing-home sales reached nearly a 4.2 million annualized pace.
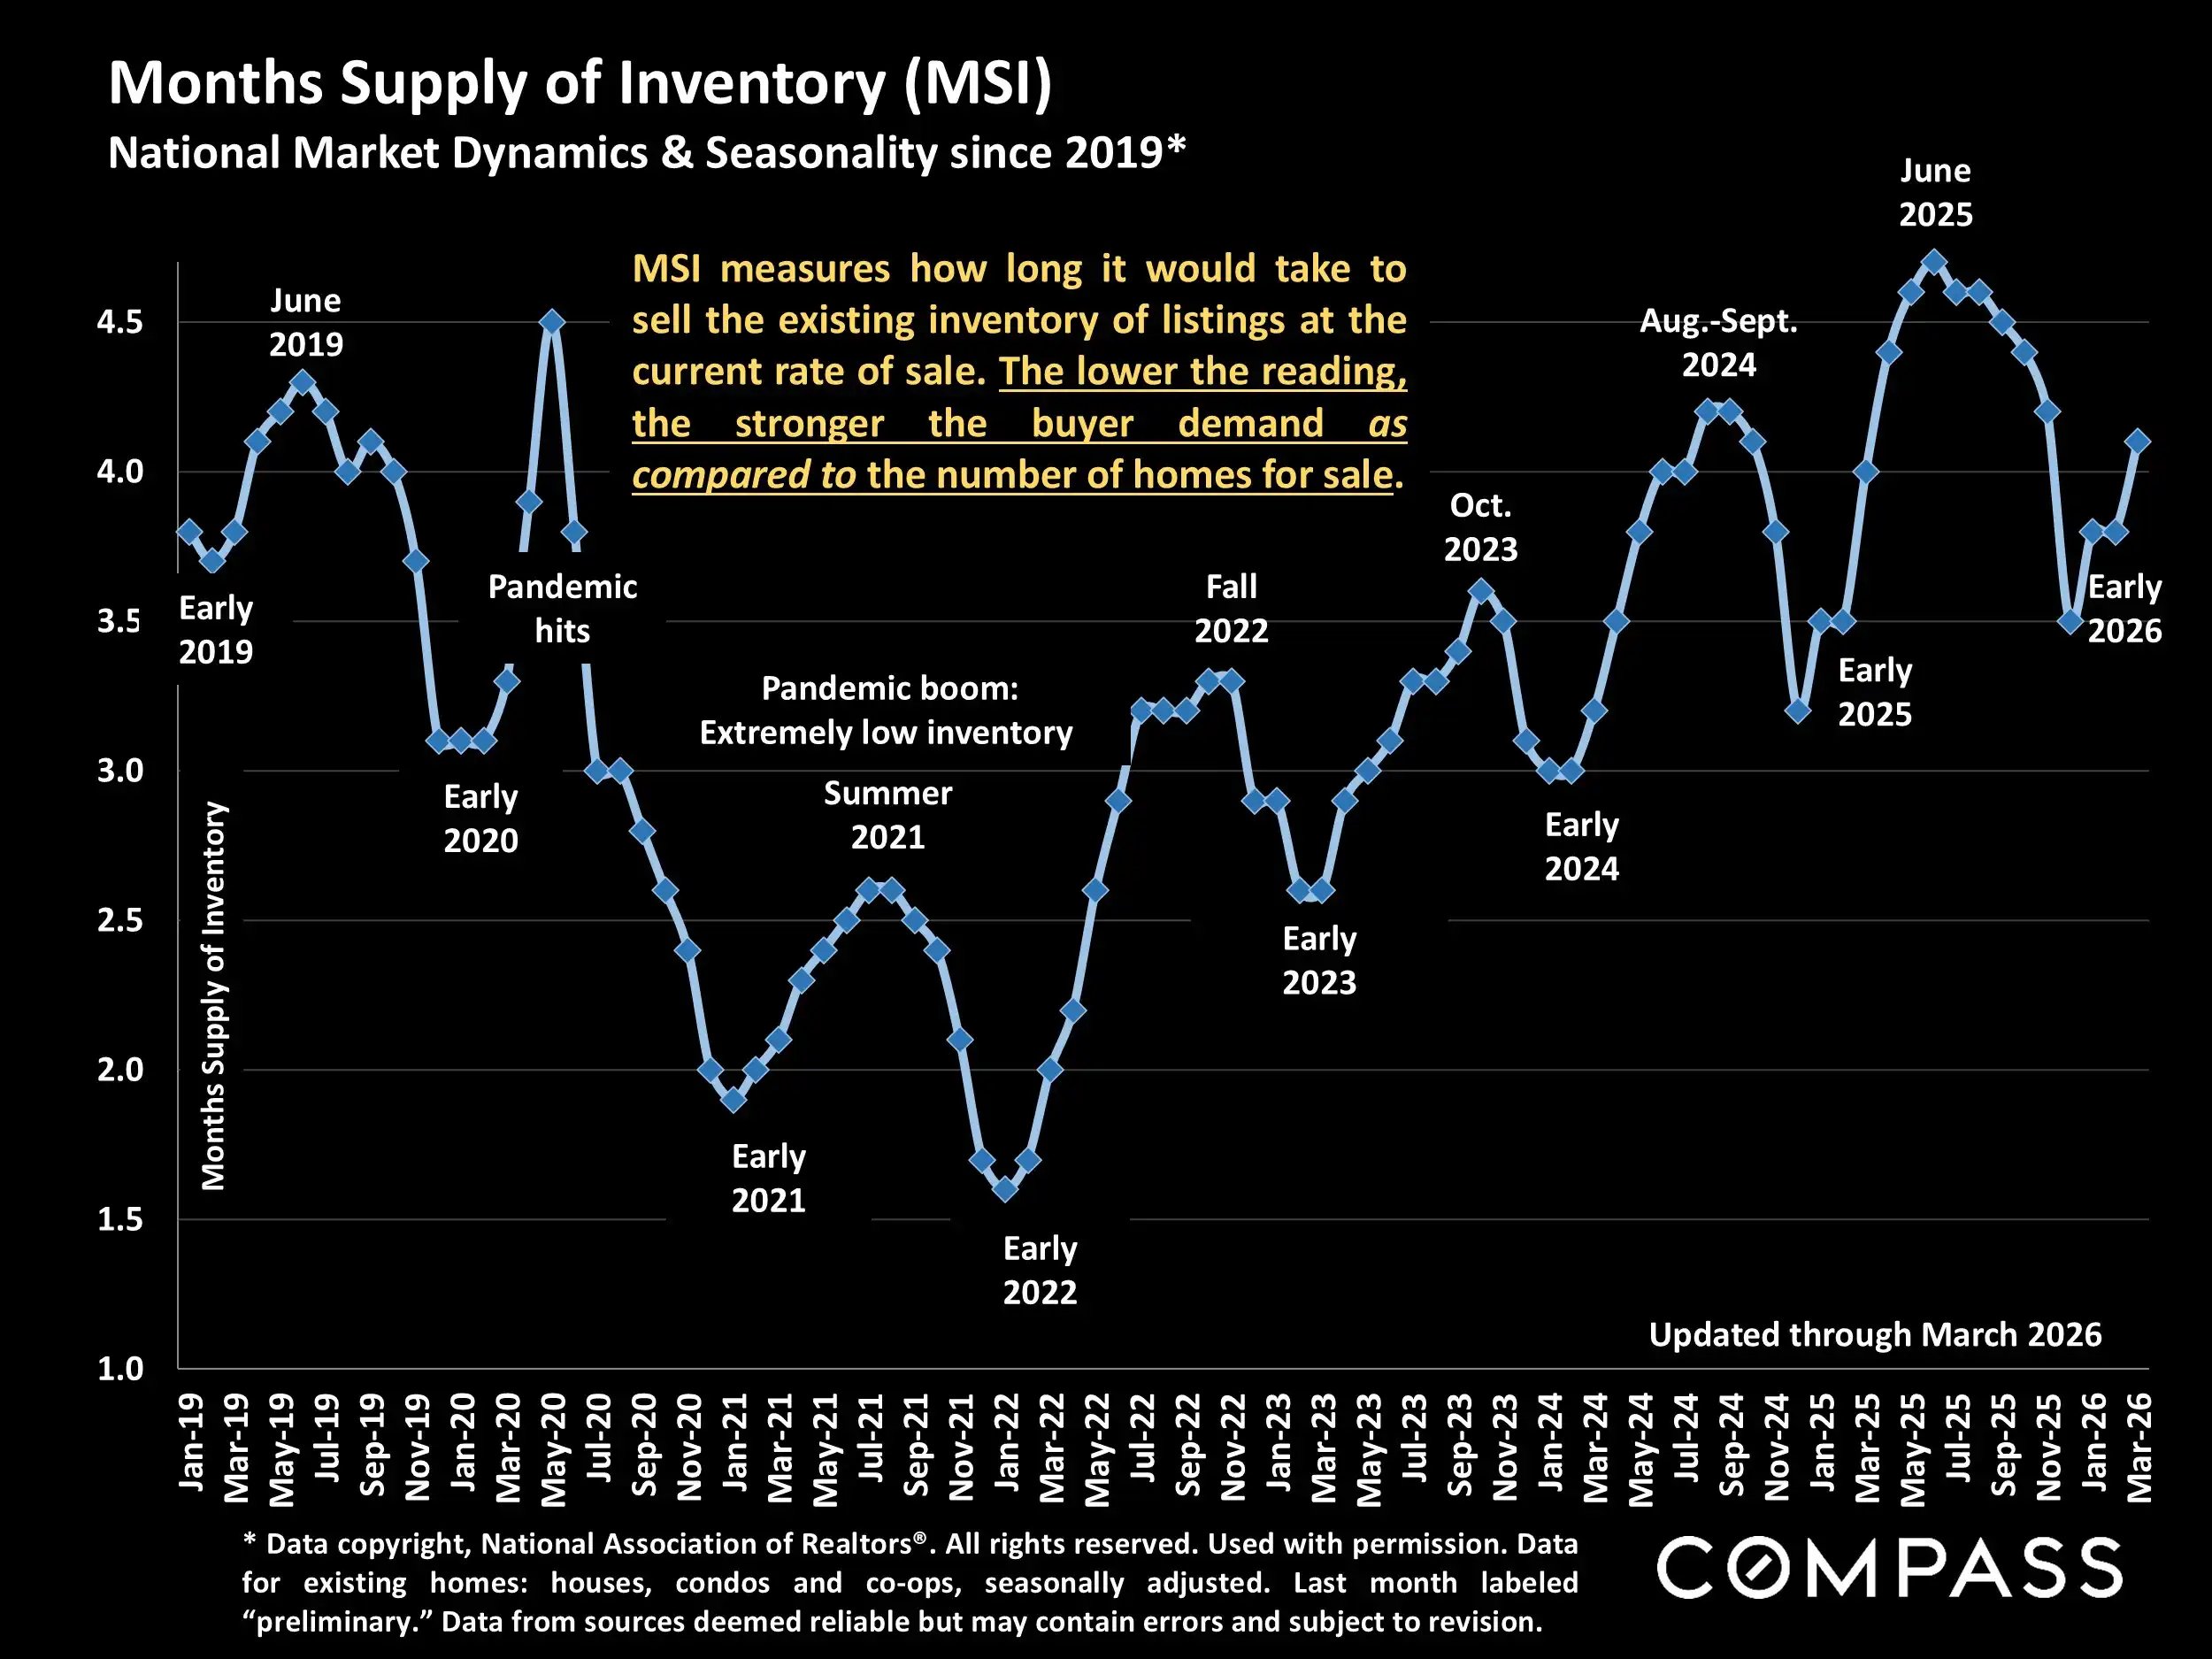
Inventory: Unsold inventory was roughly unchanged from last year and still below 2017 levels.
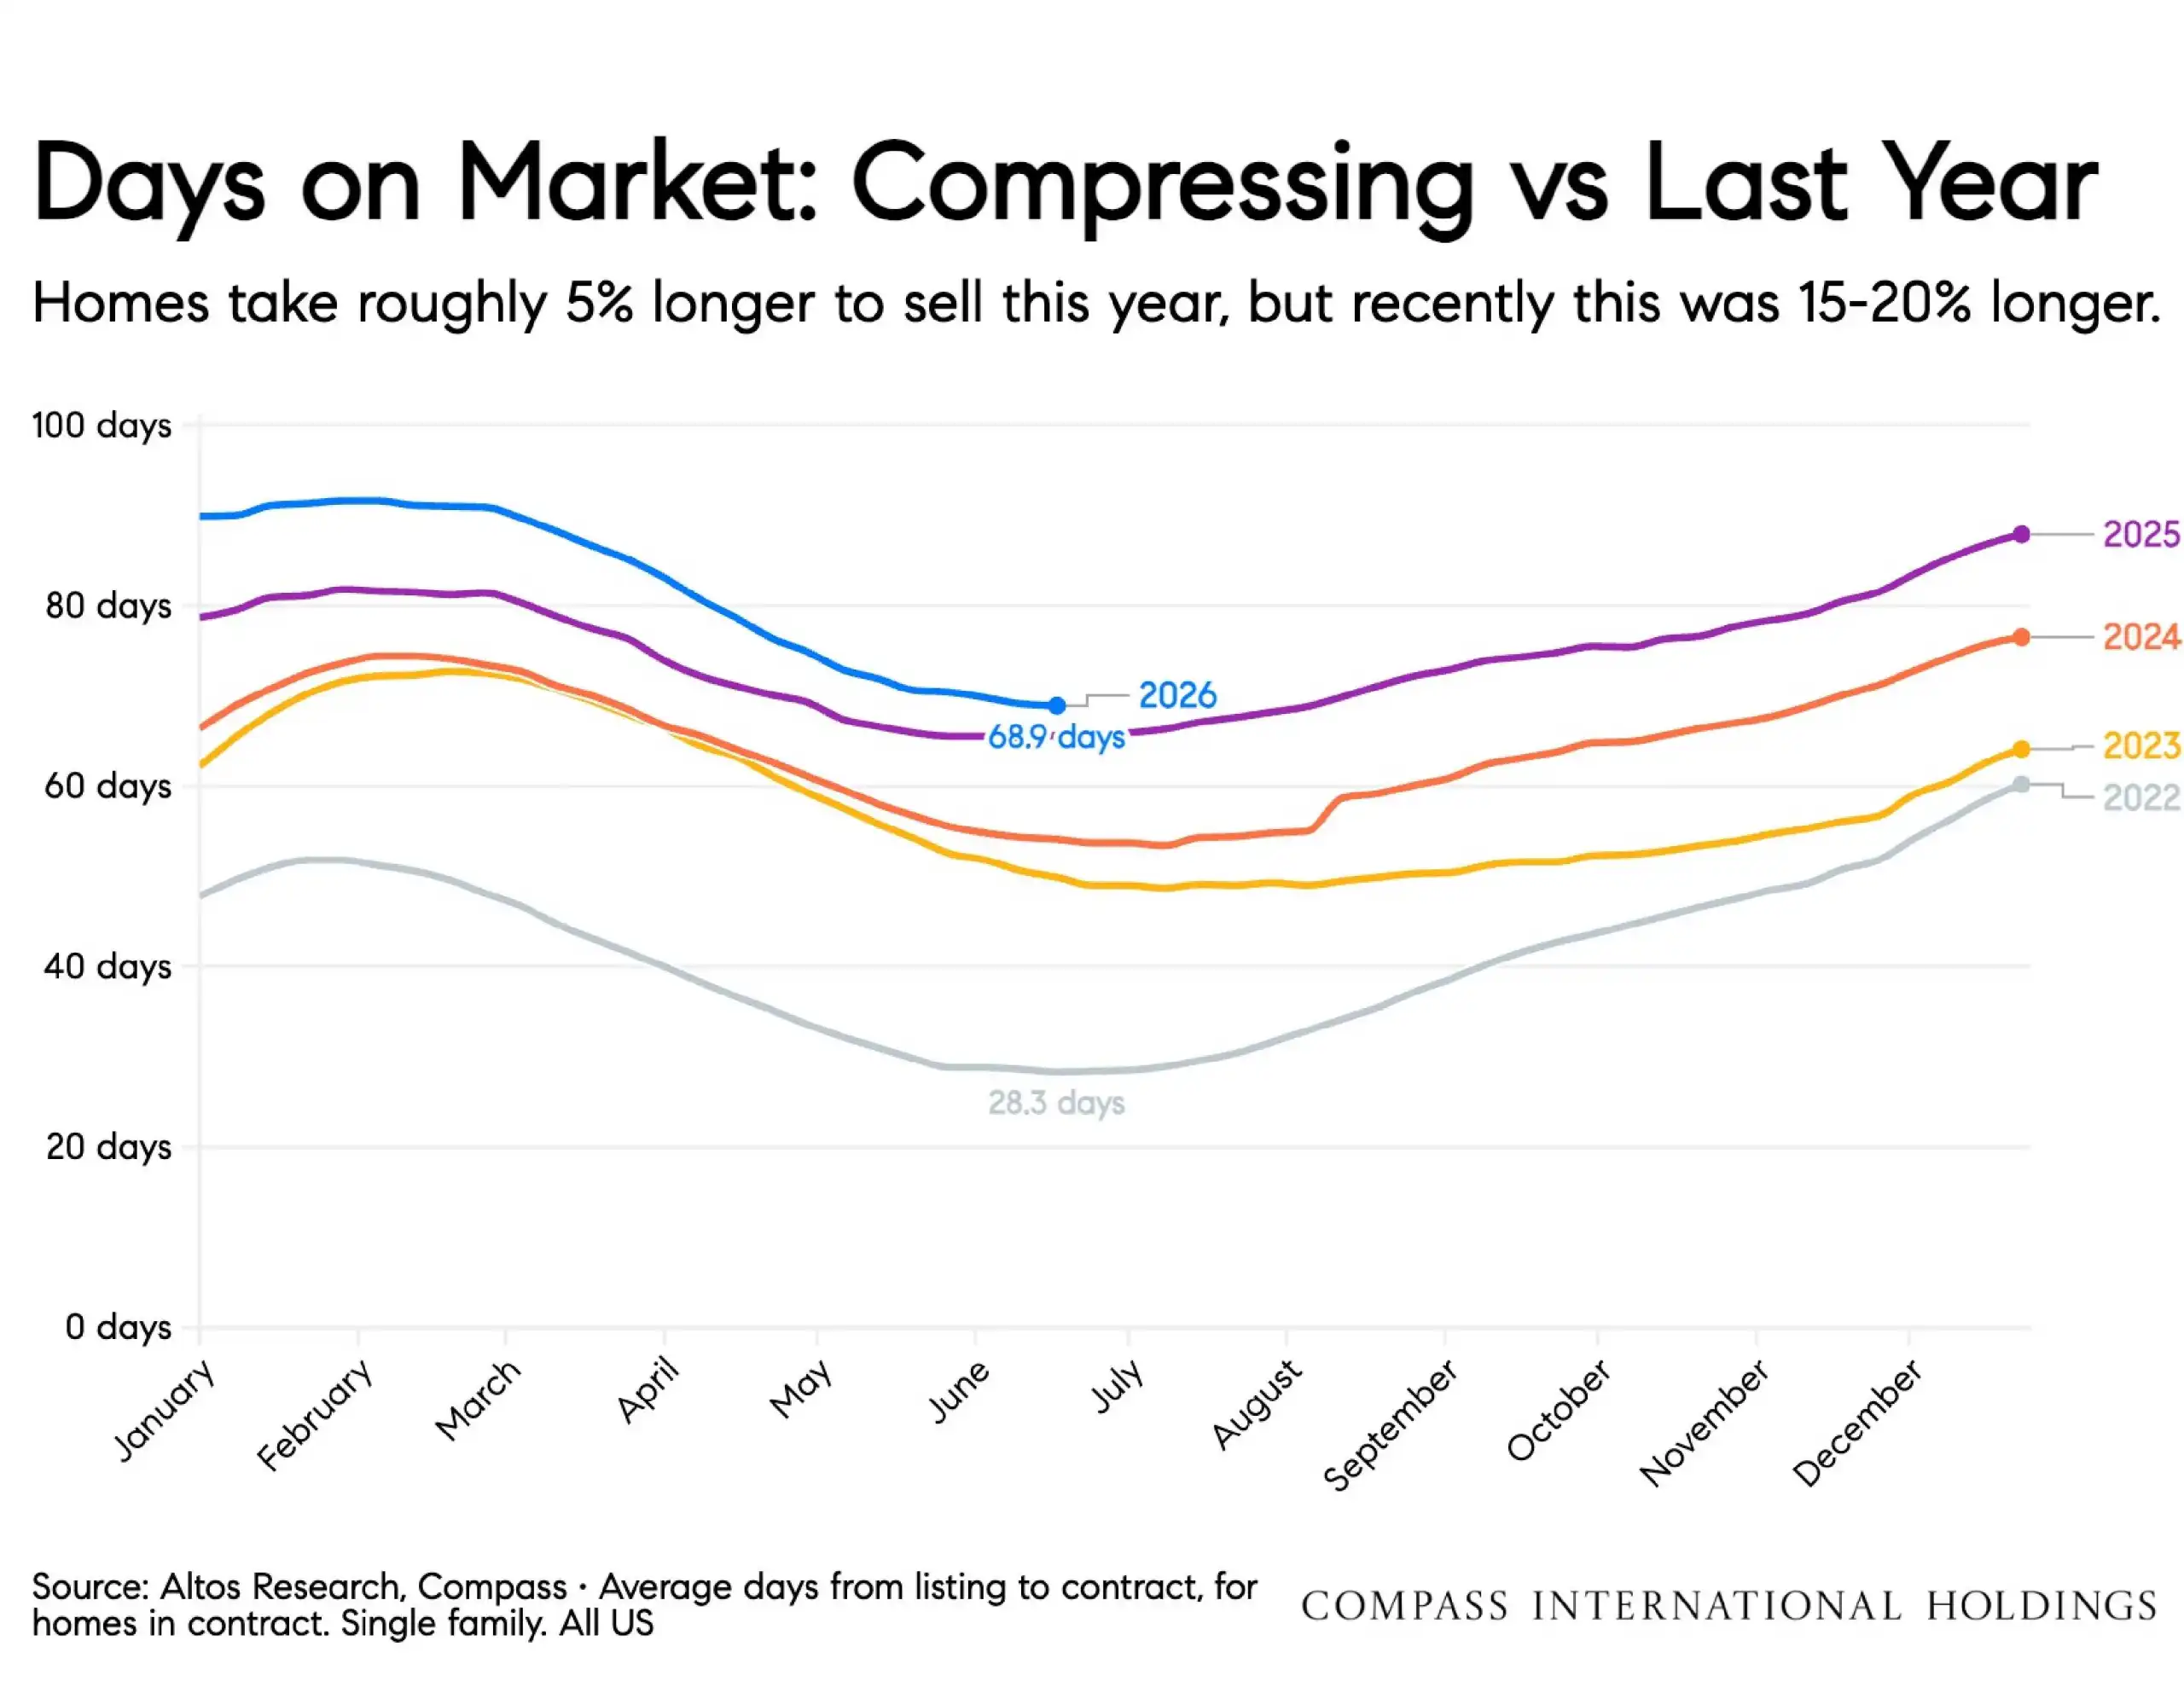
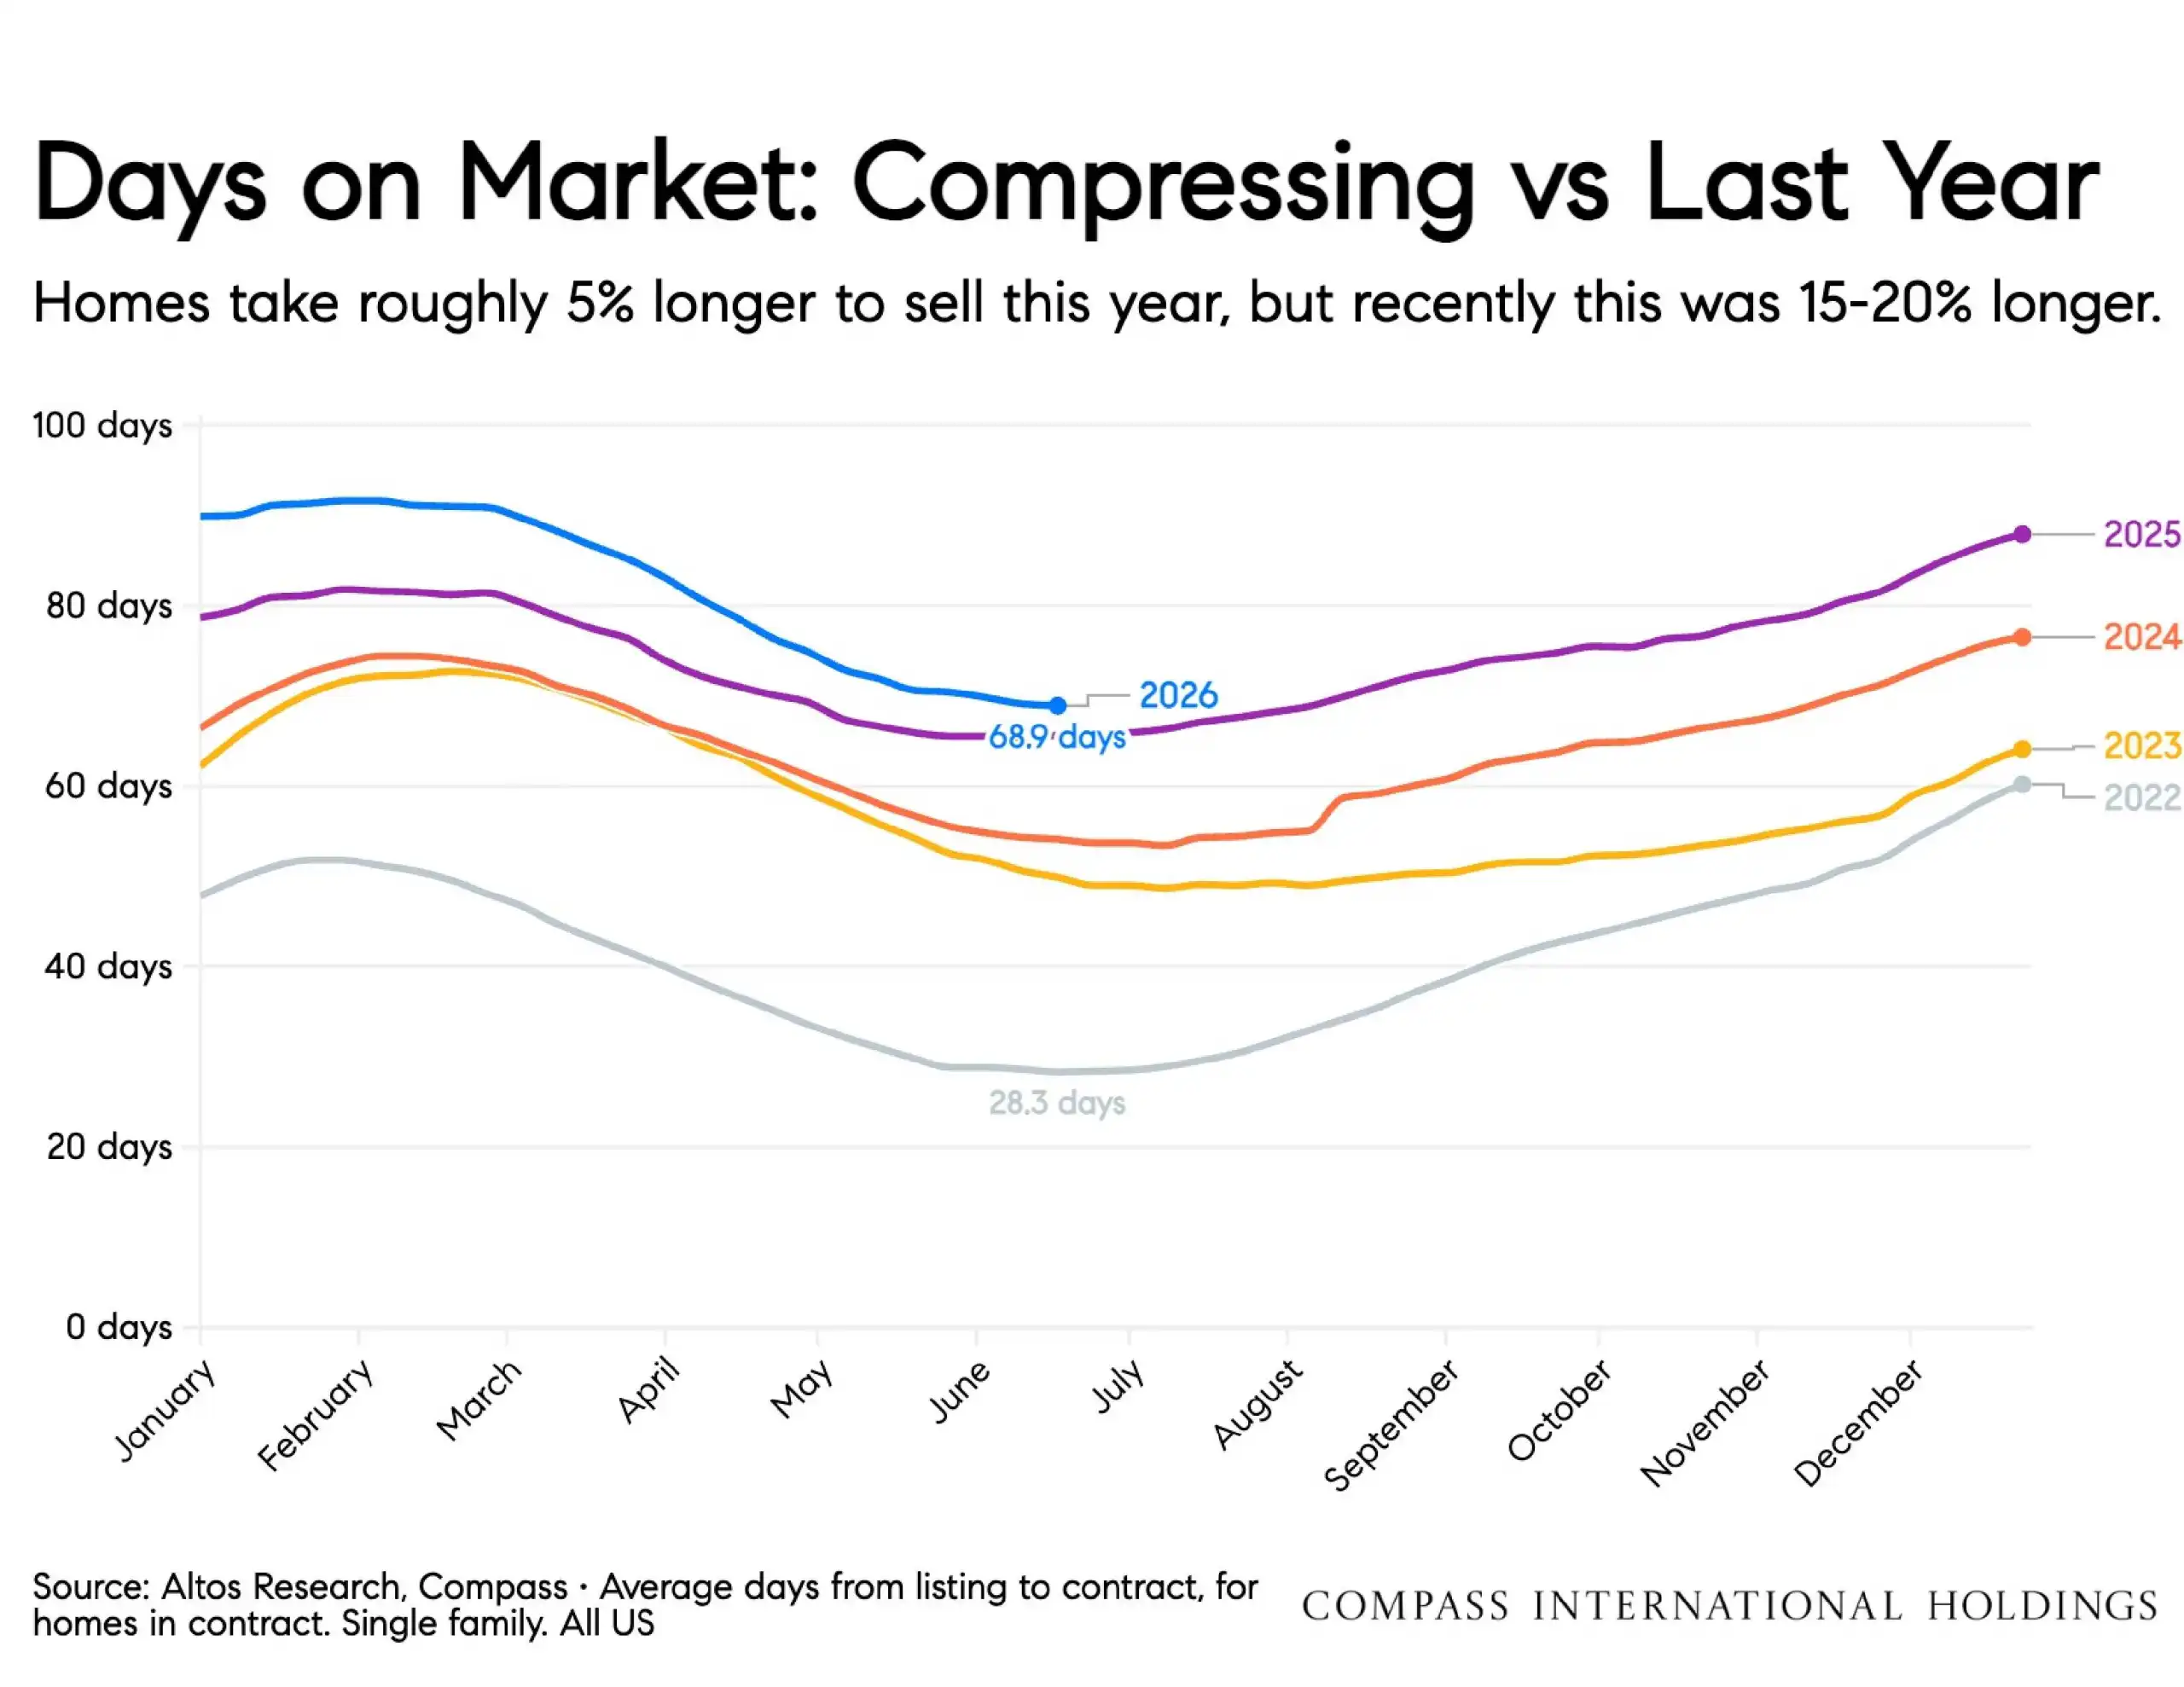
Days on Market: Homes were taking about 5% longer to sell than last year, an improvement from earlier in the year.
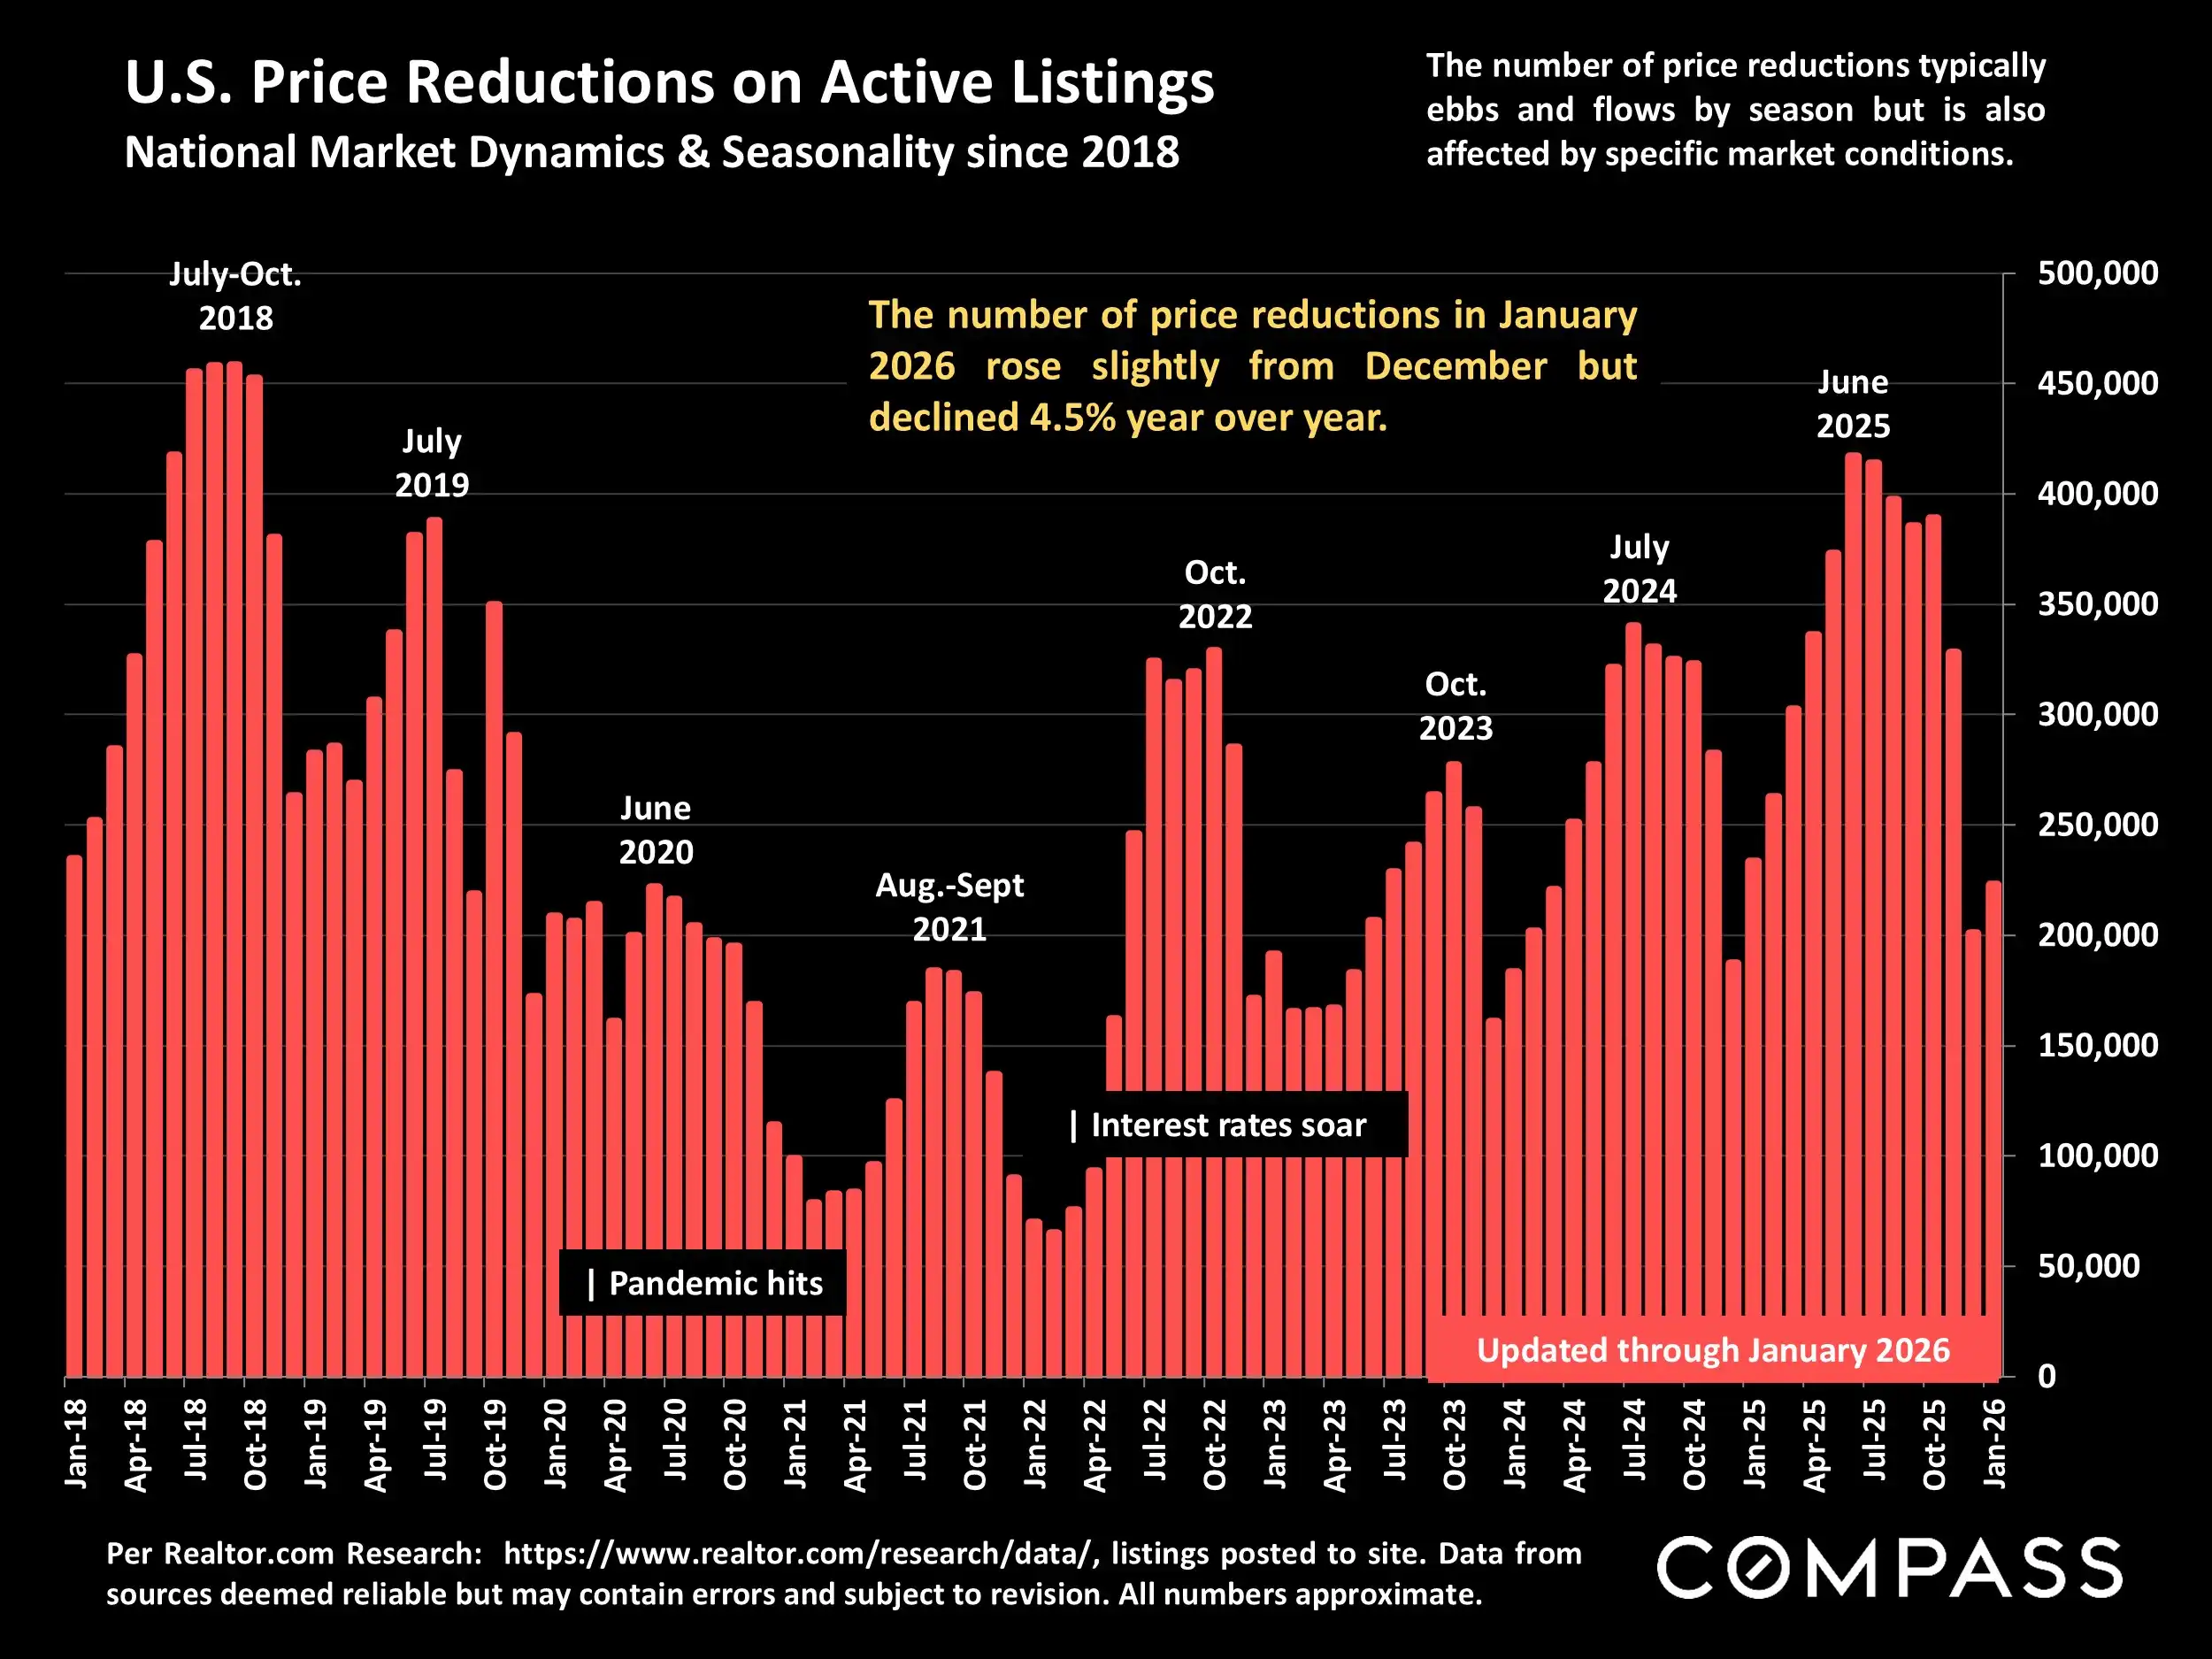
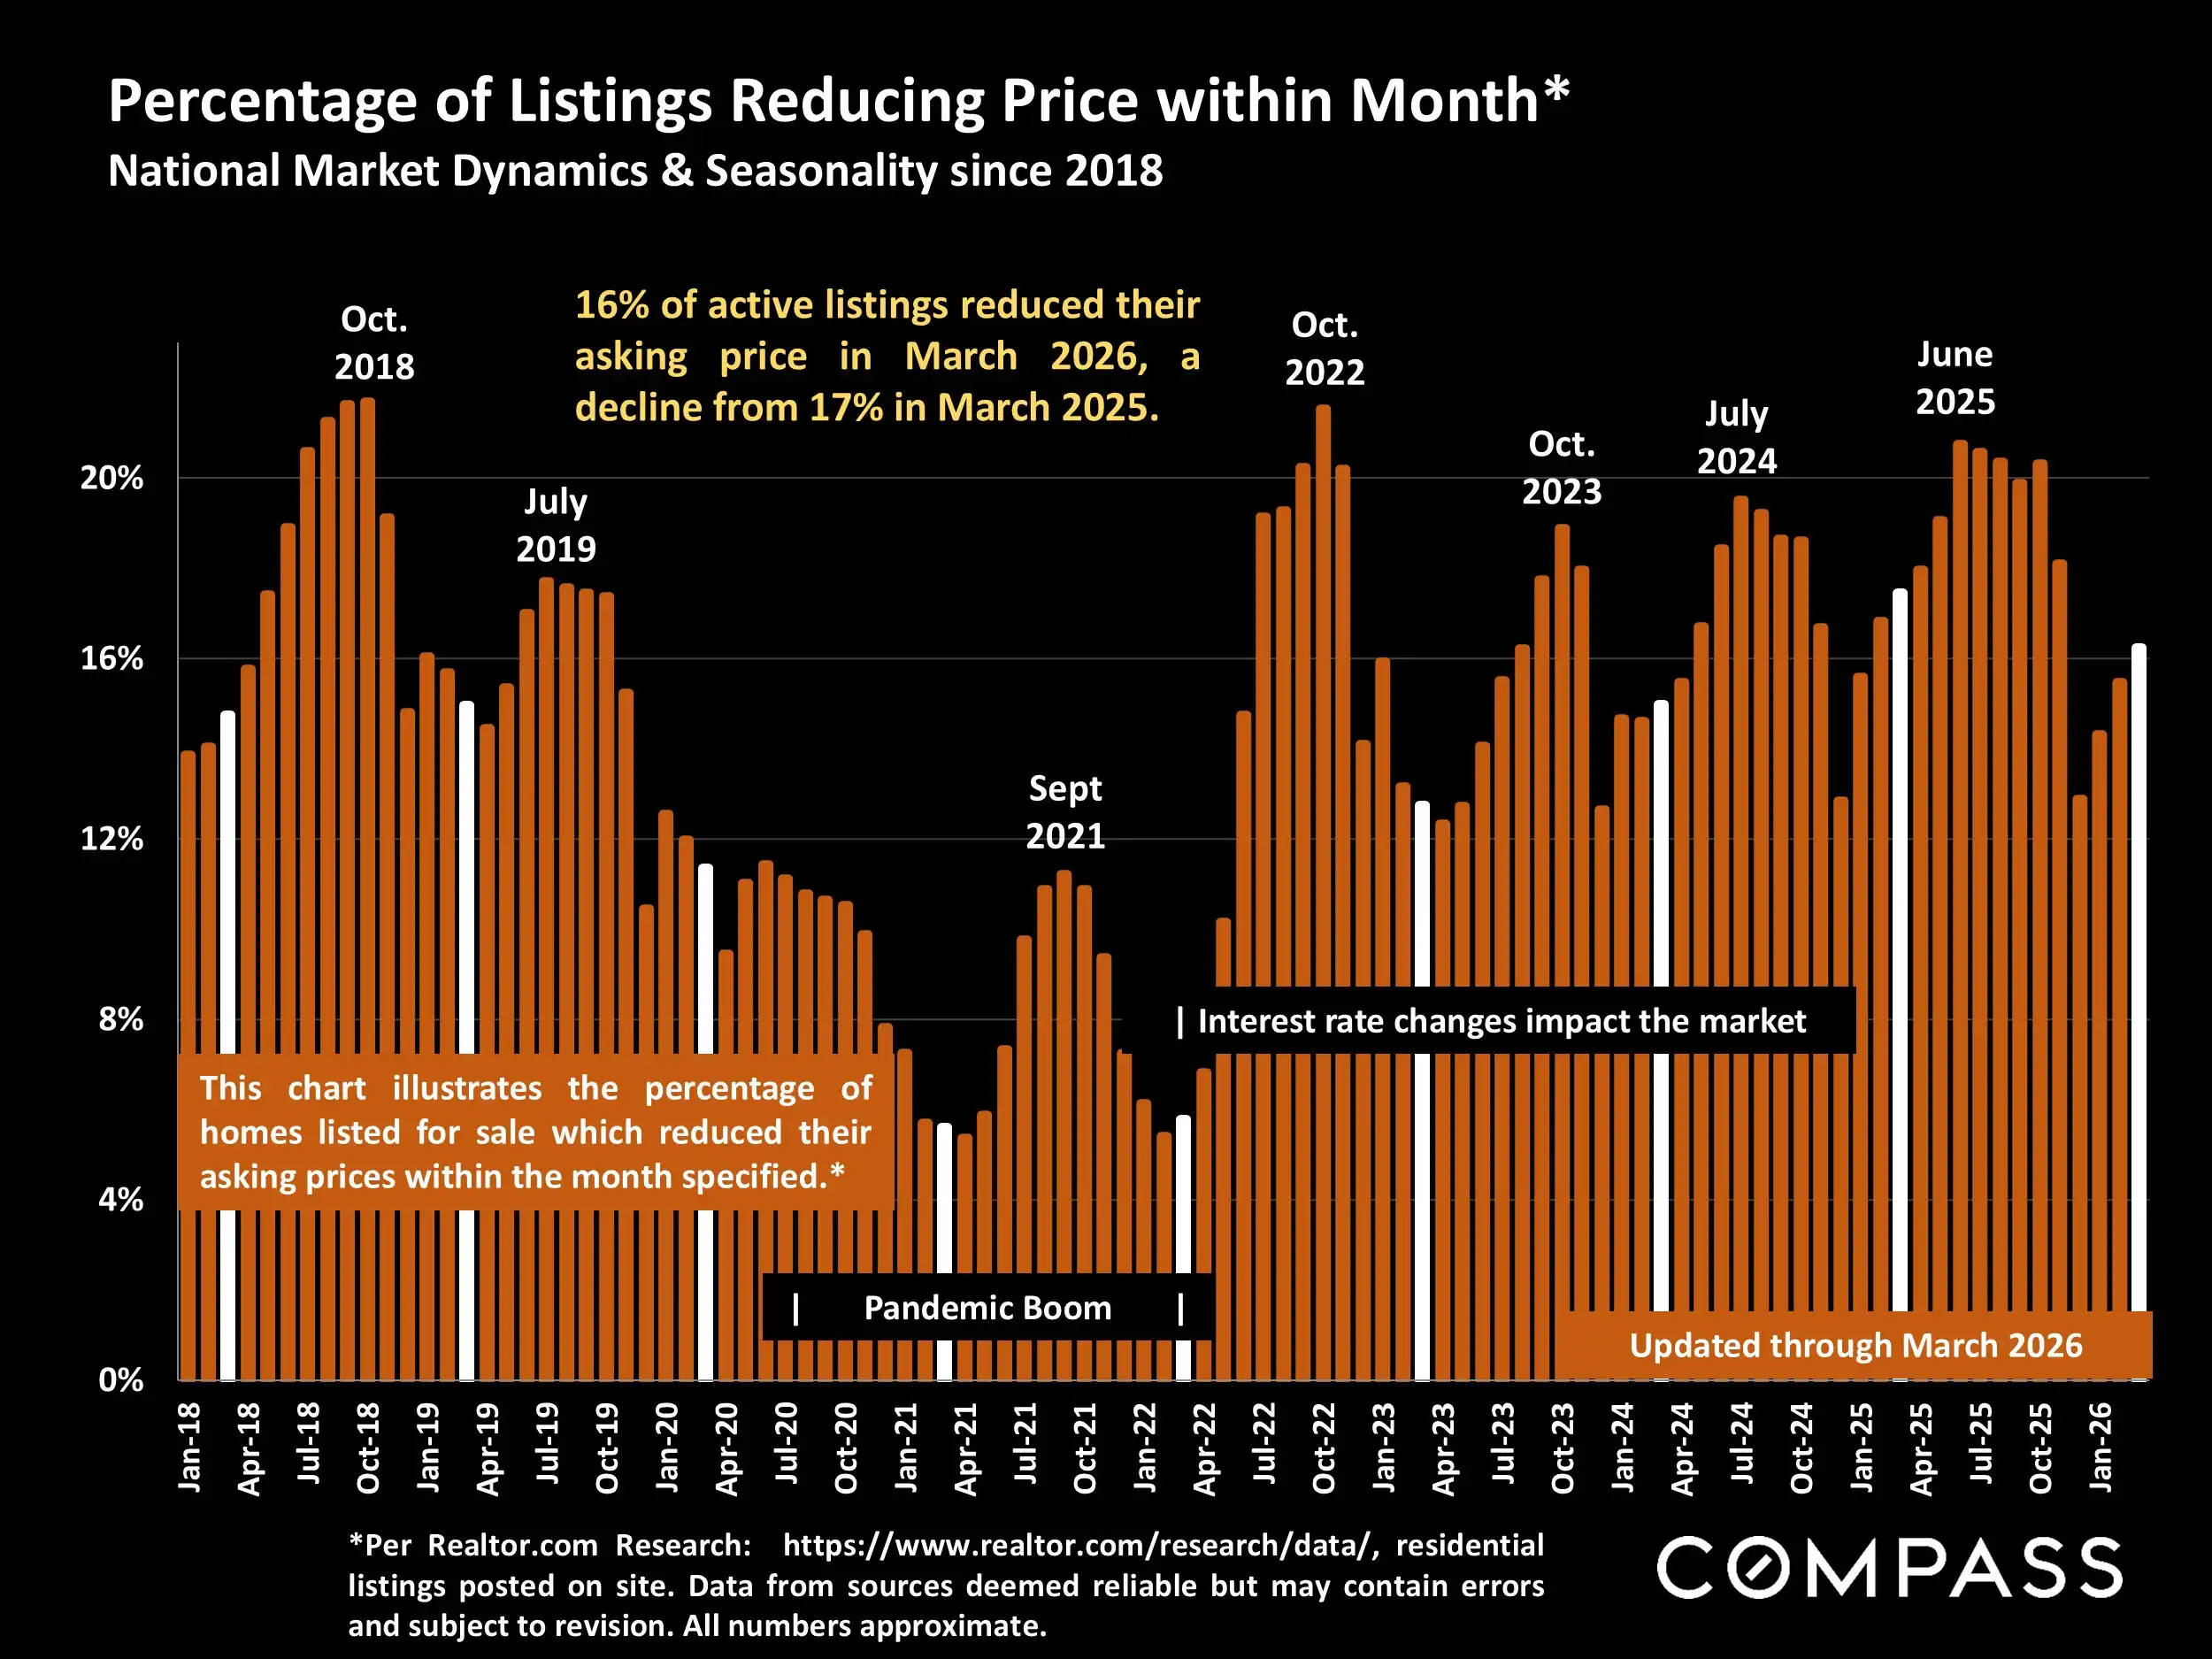
Home Prices: National home prices remained slightly positive year over year, while list-price trends showed softer conditions.
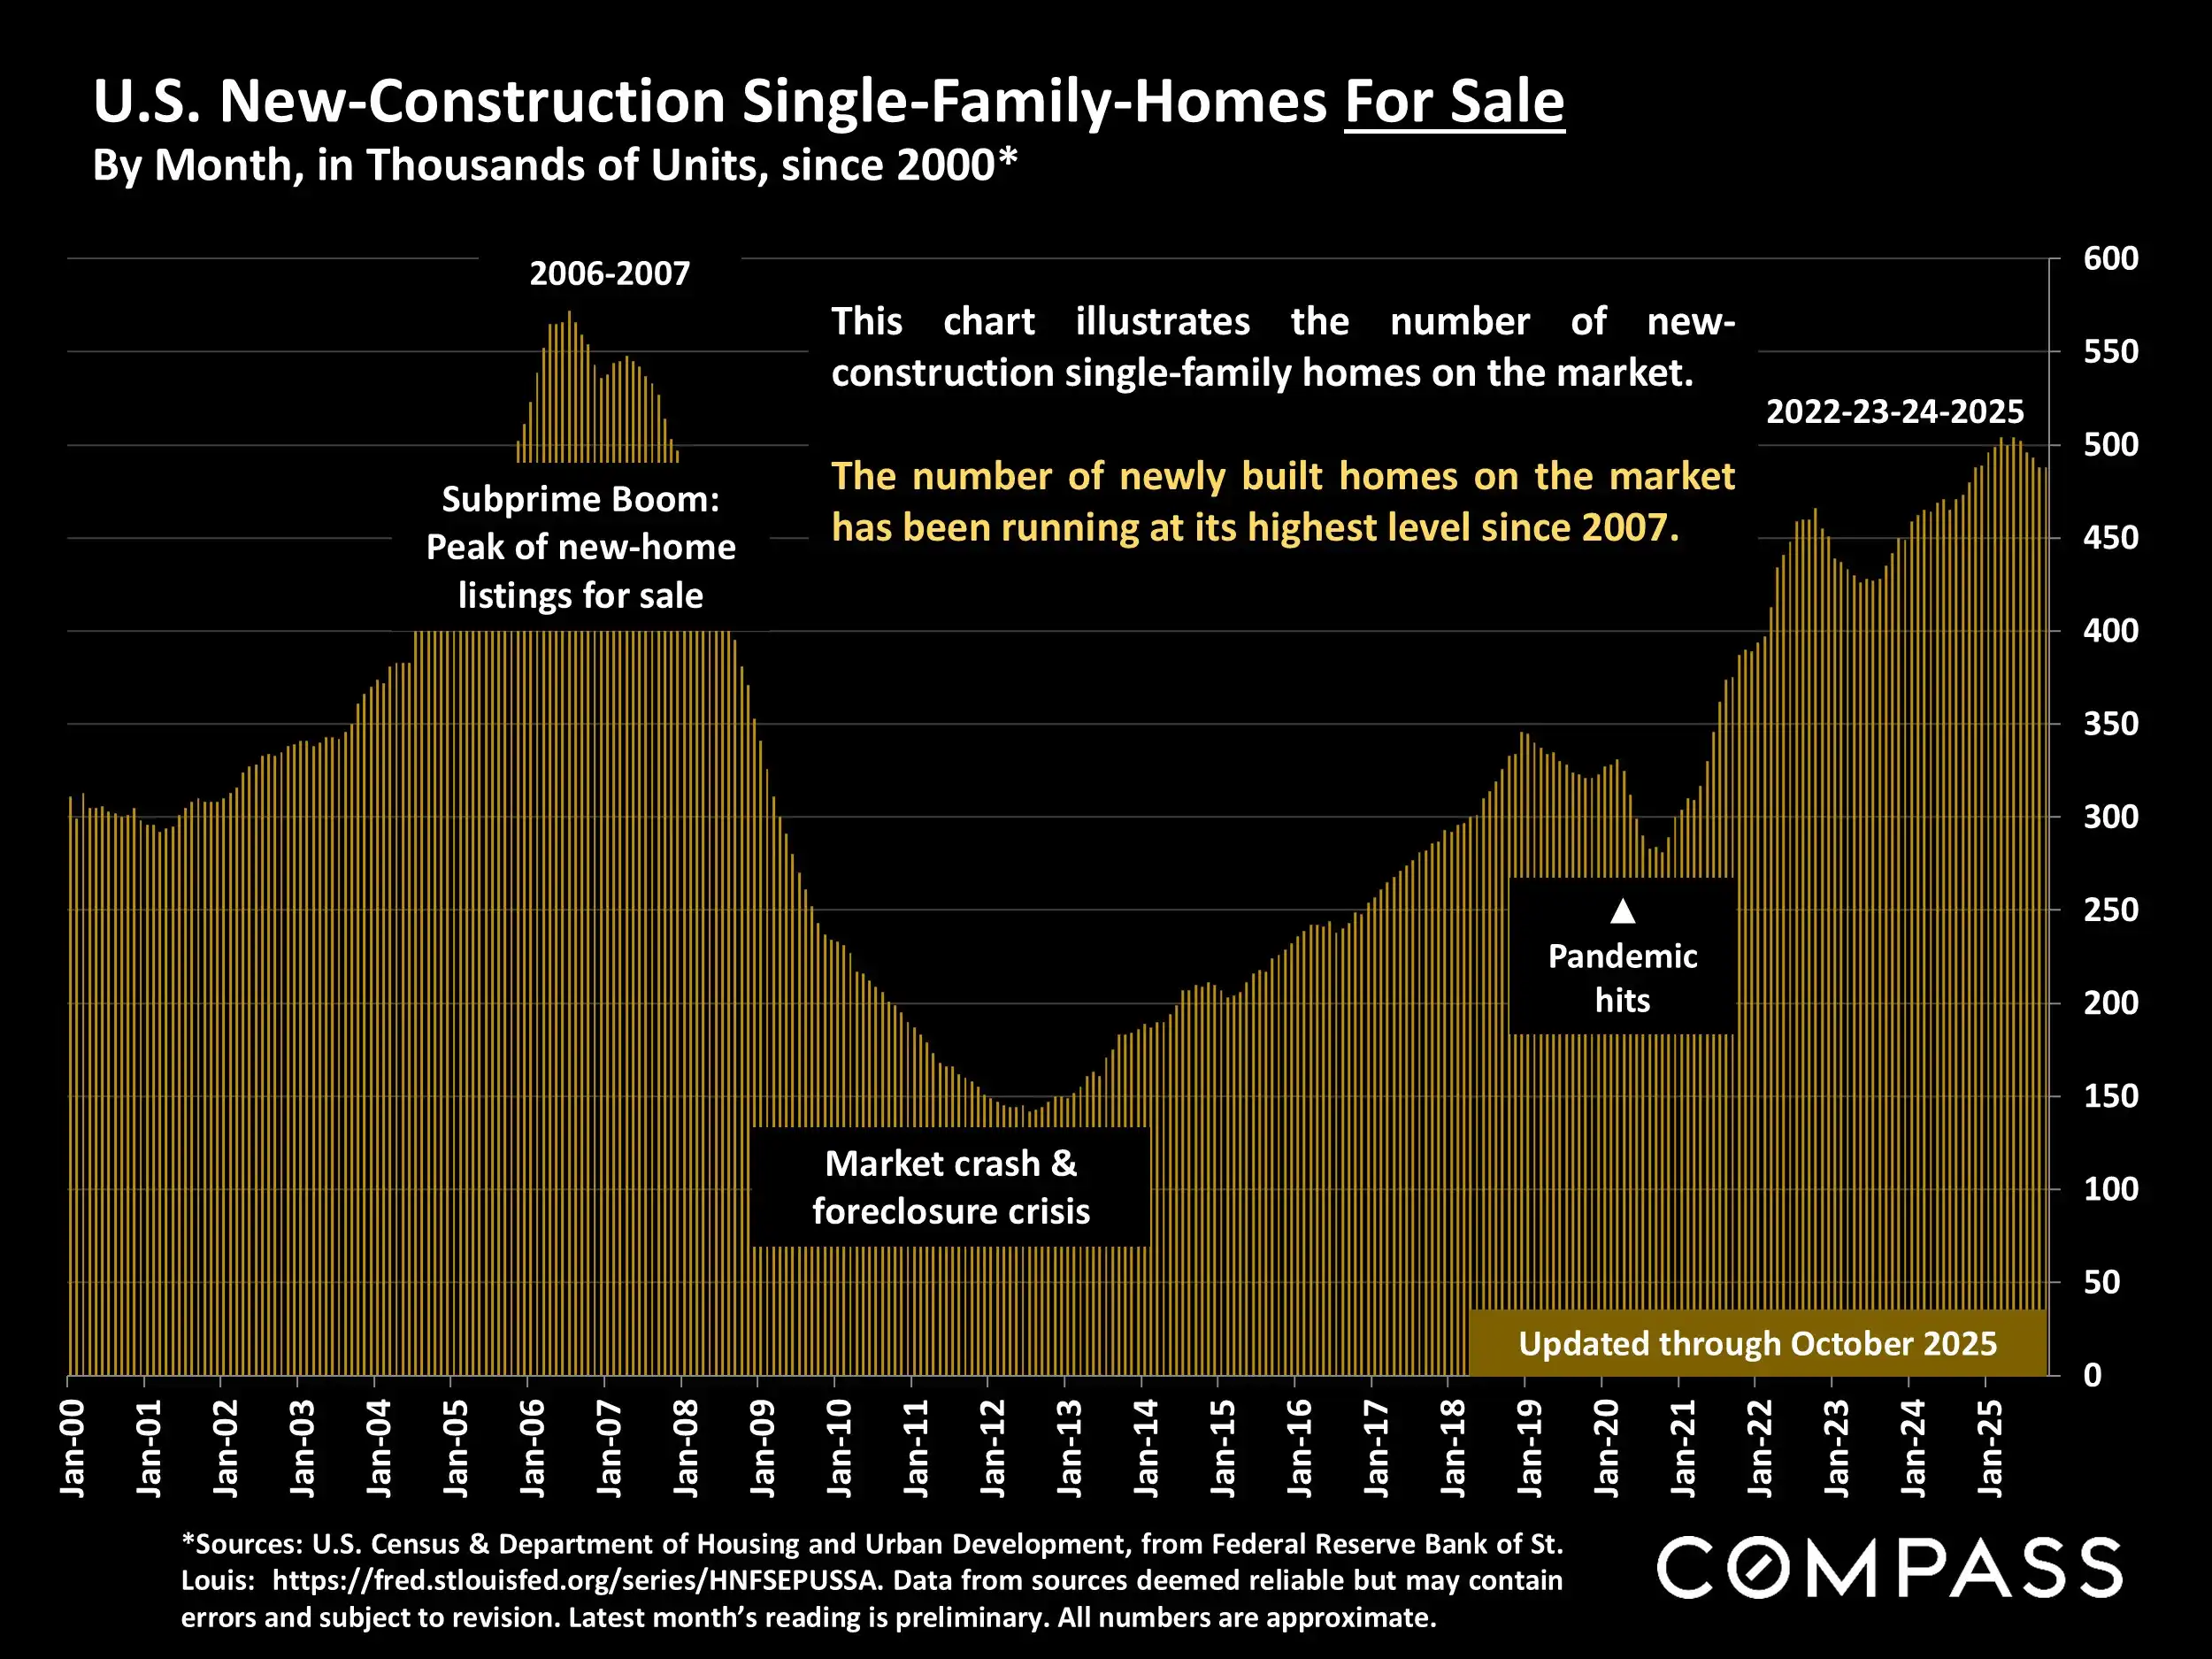
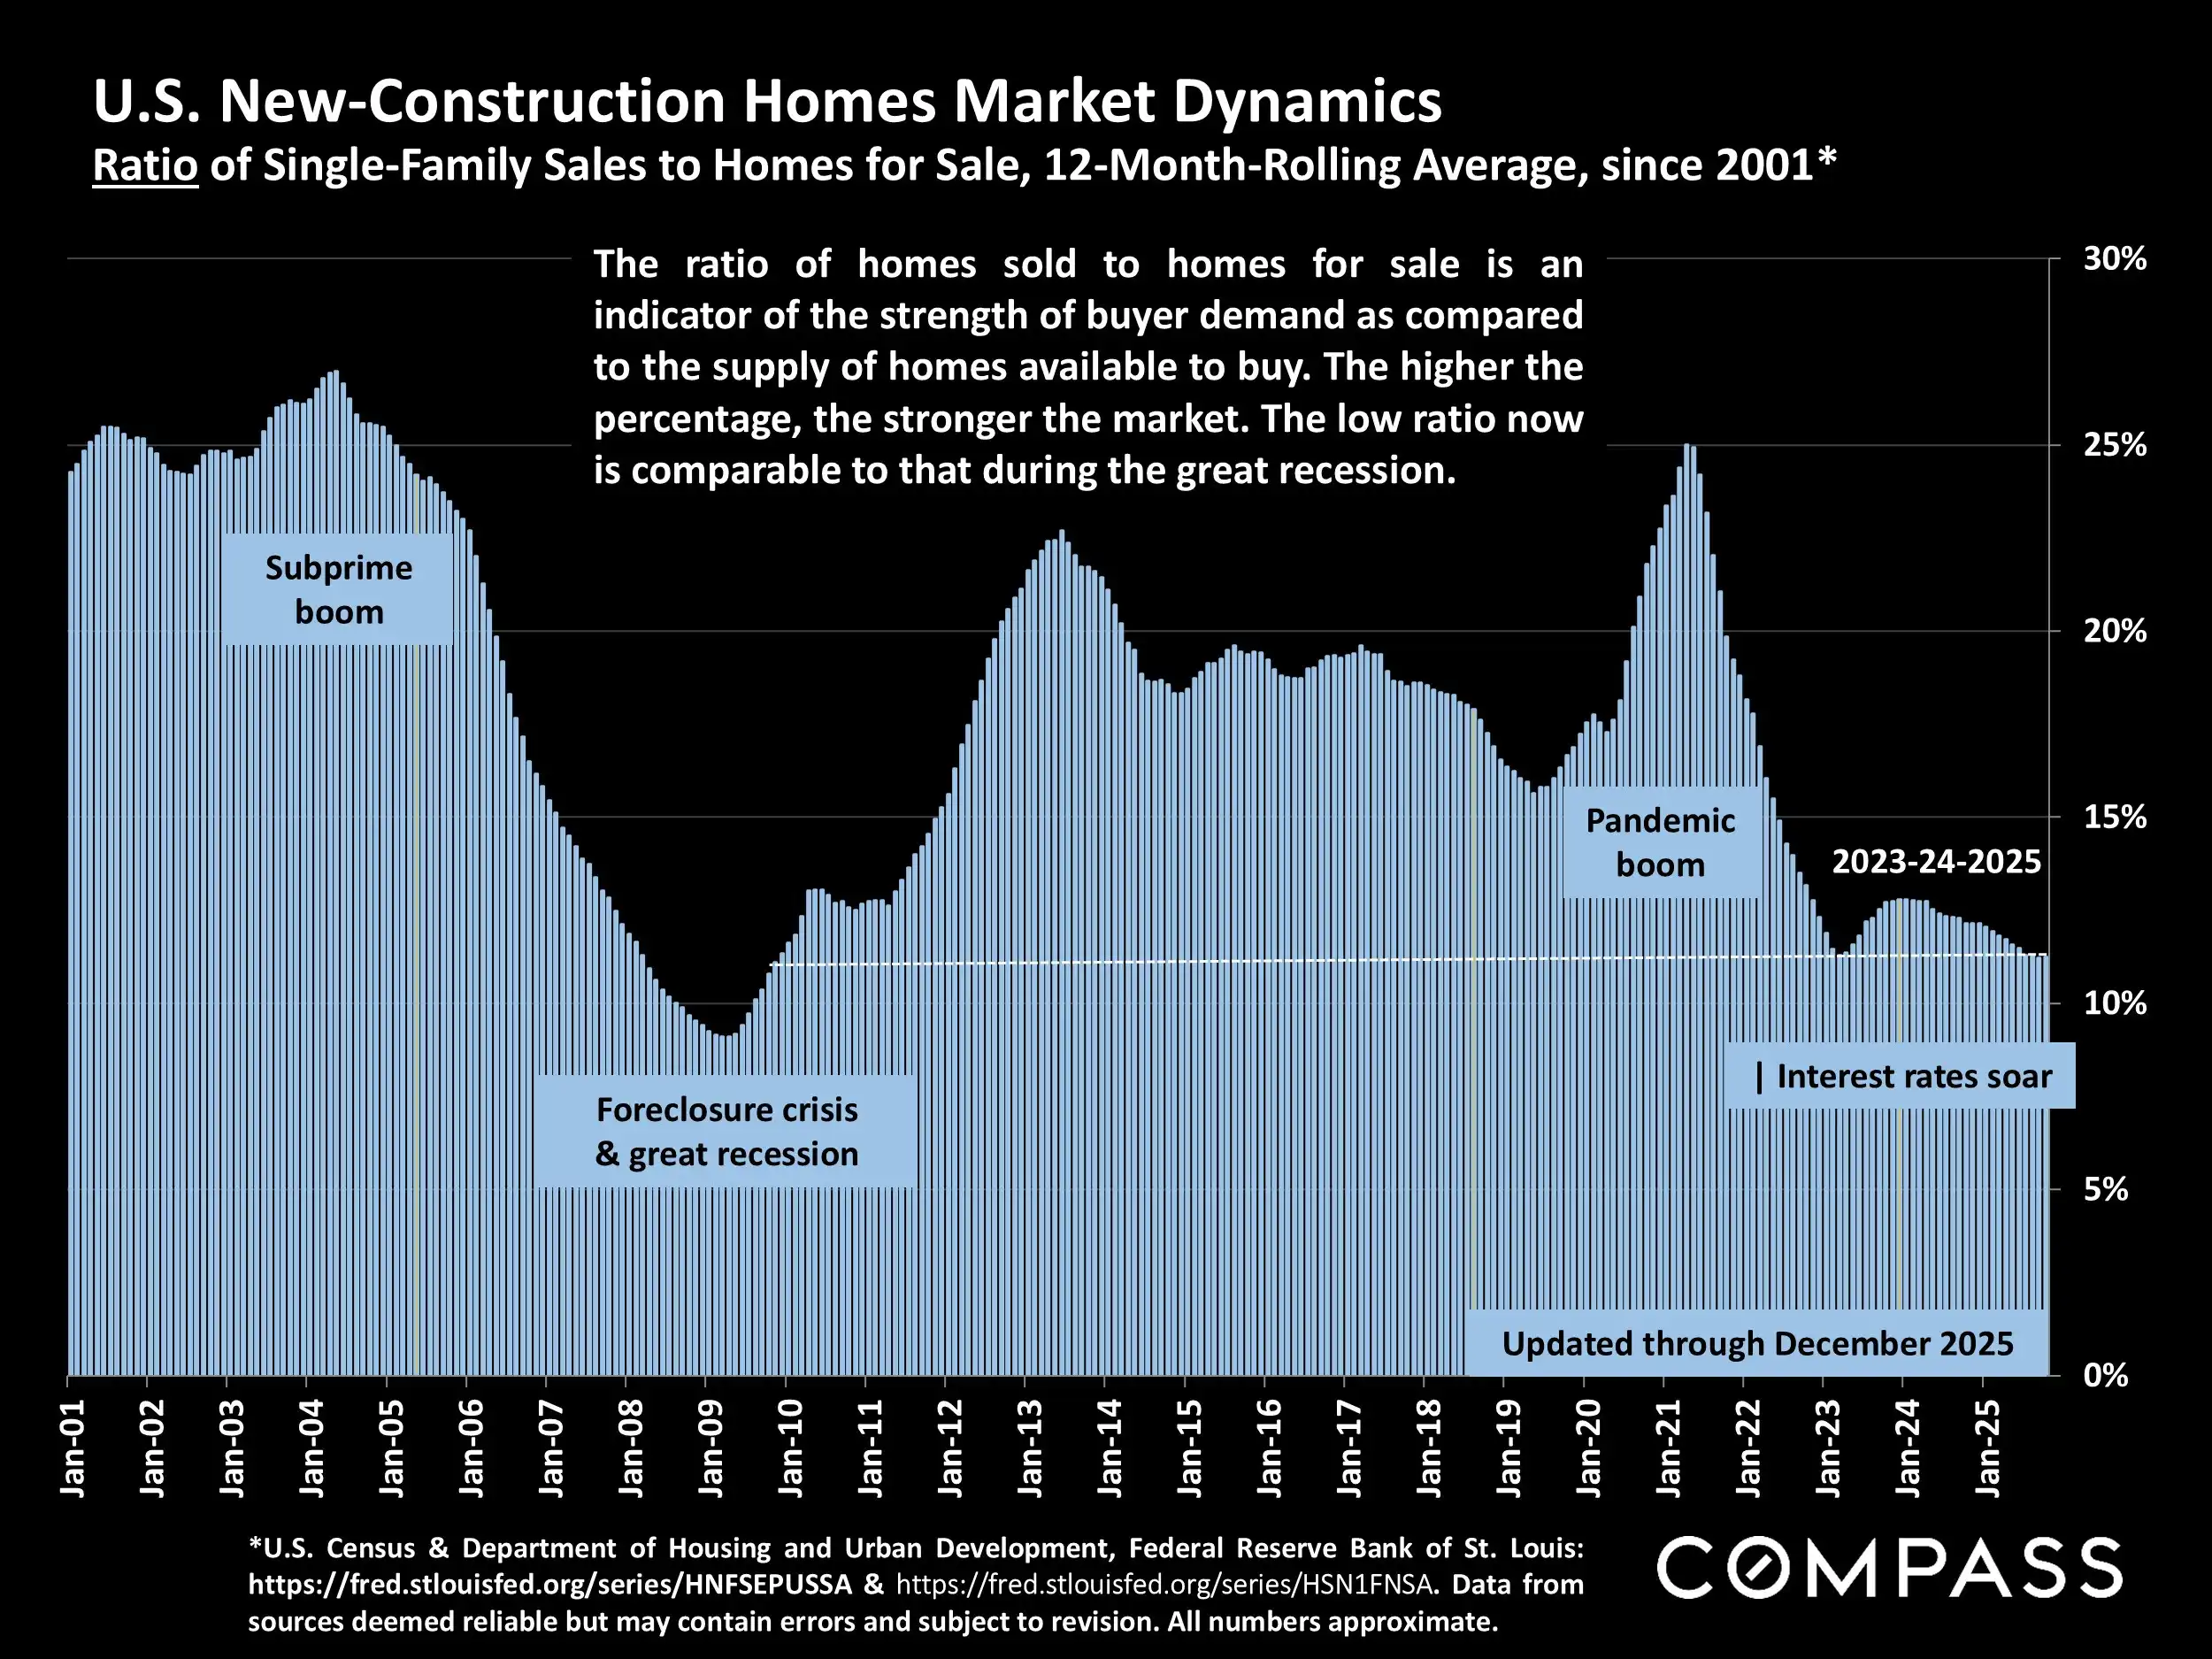
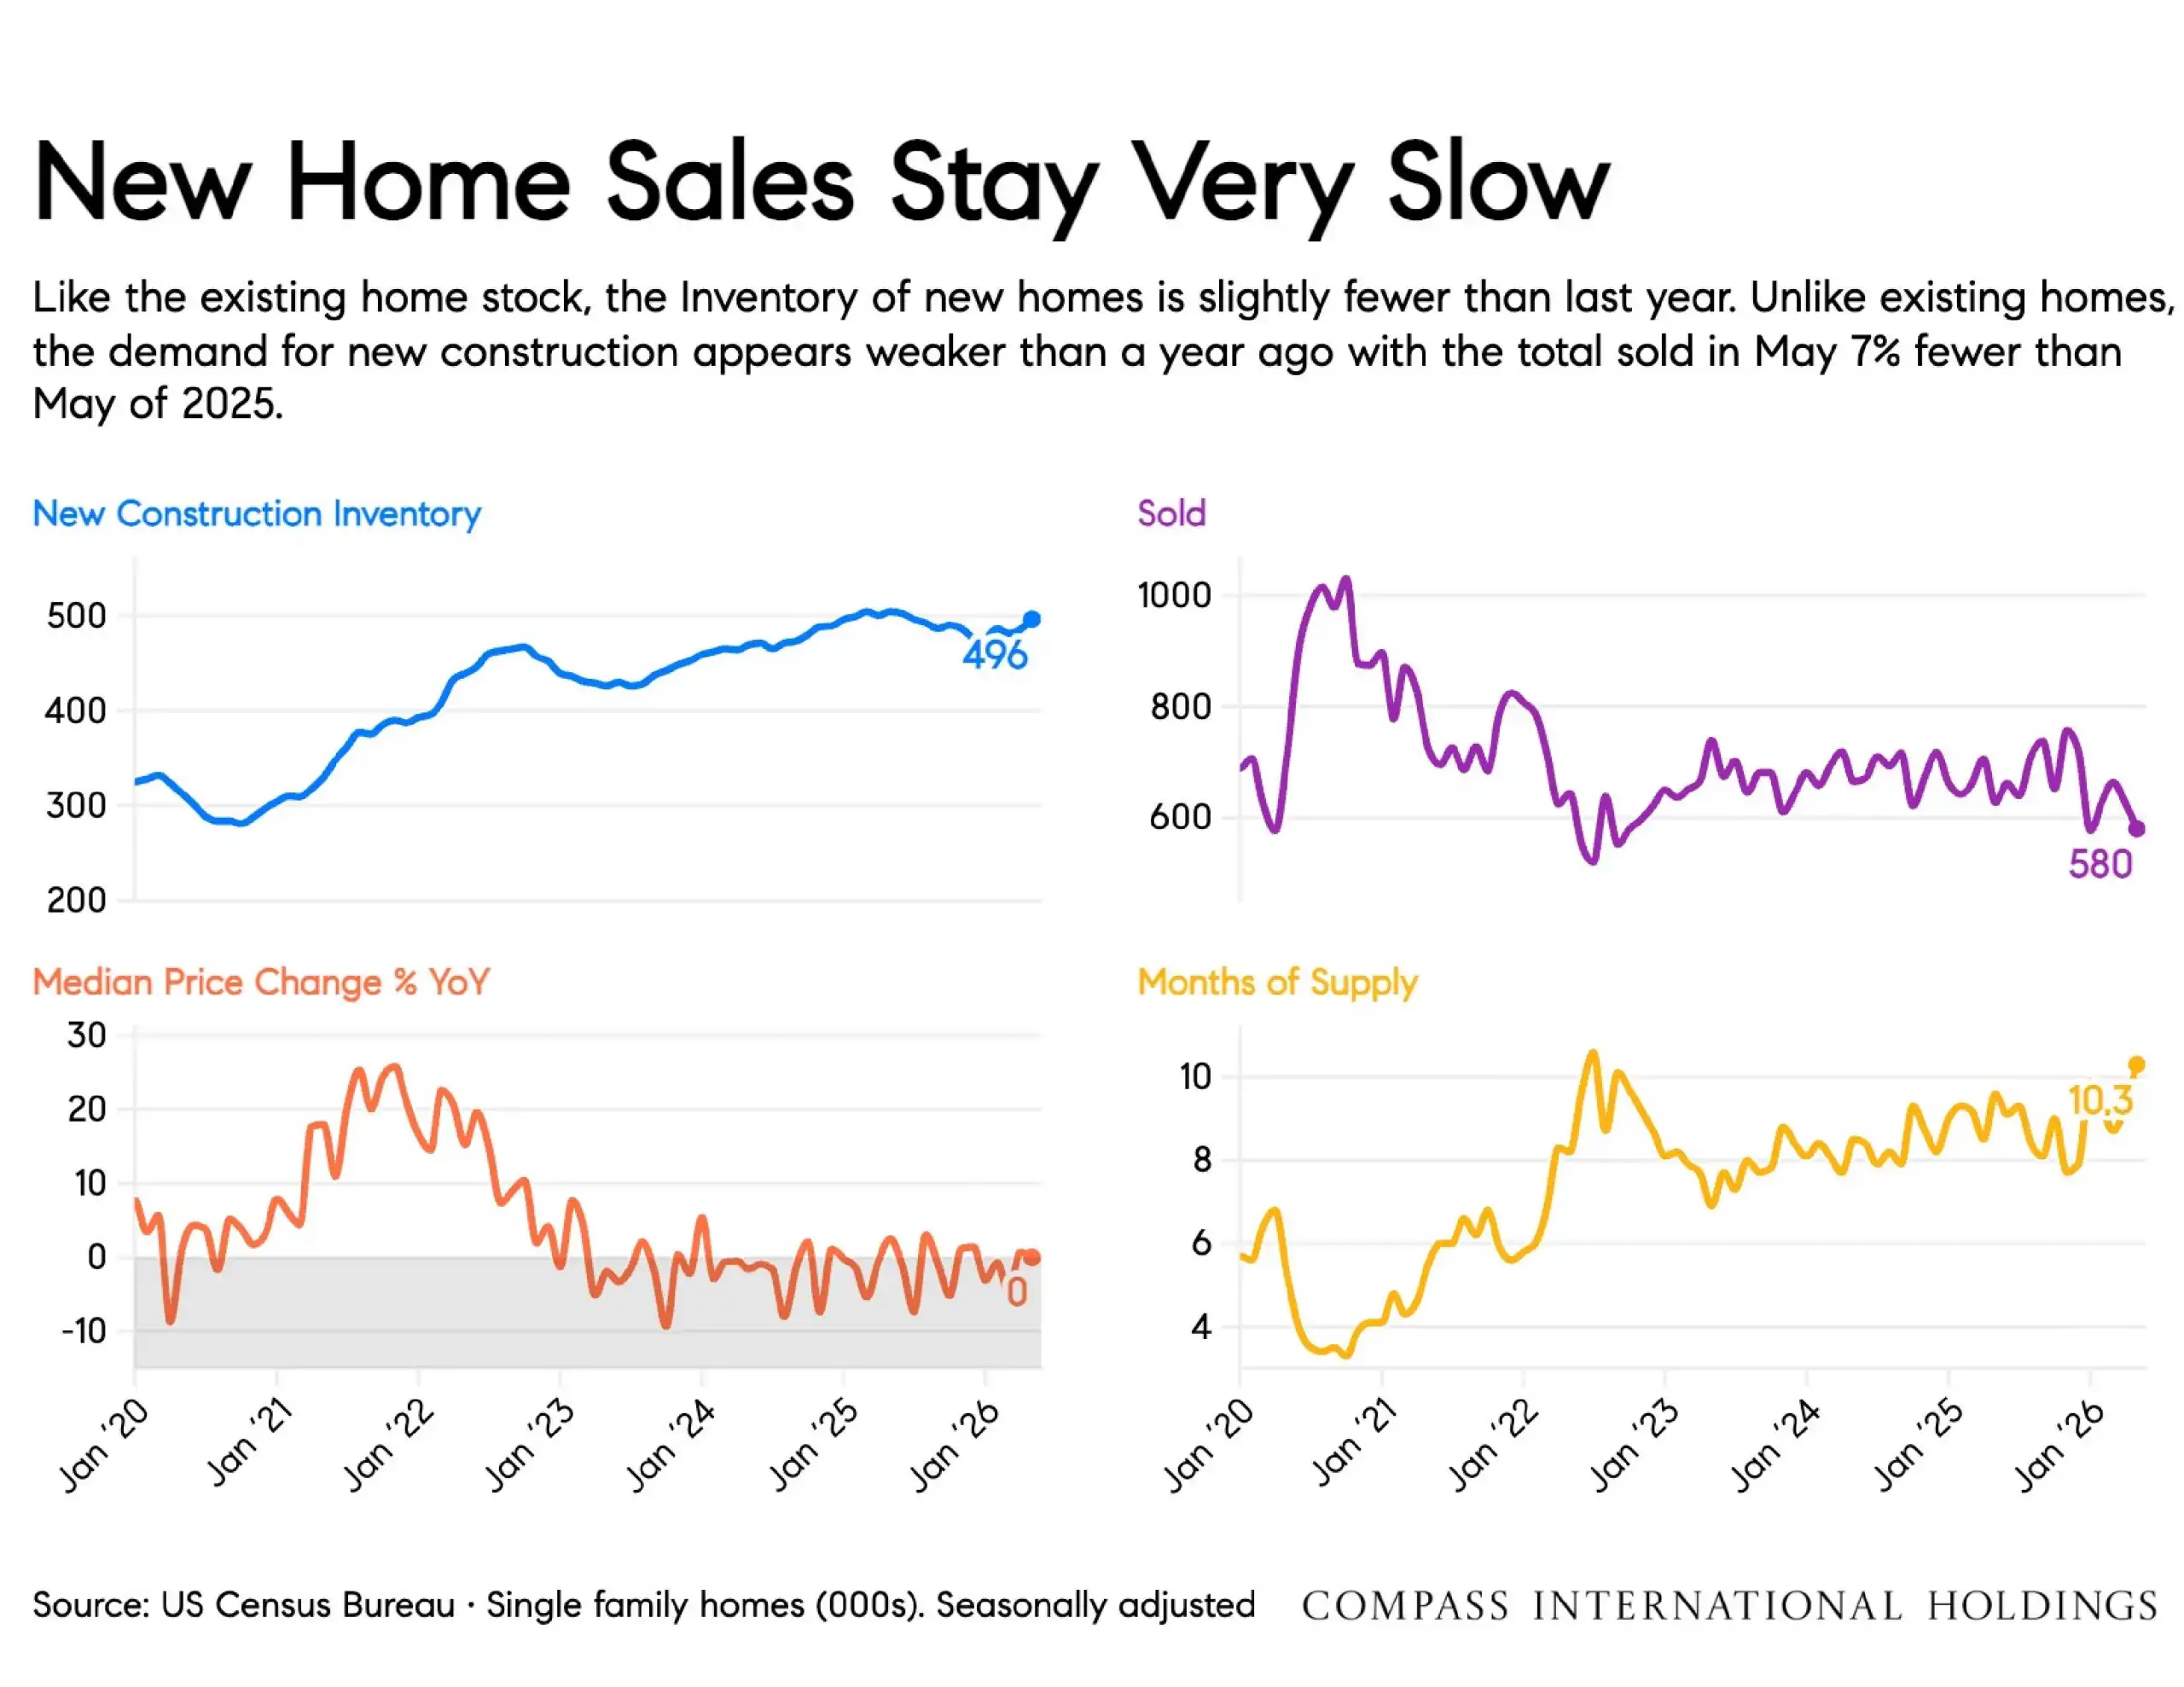
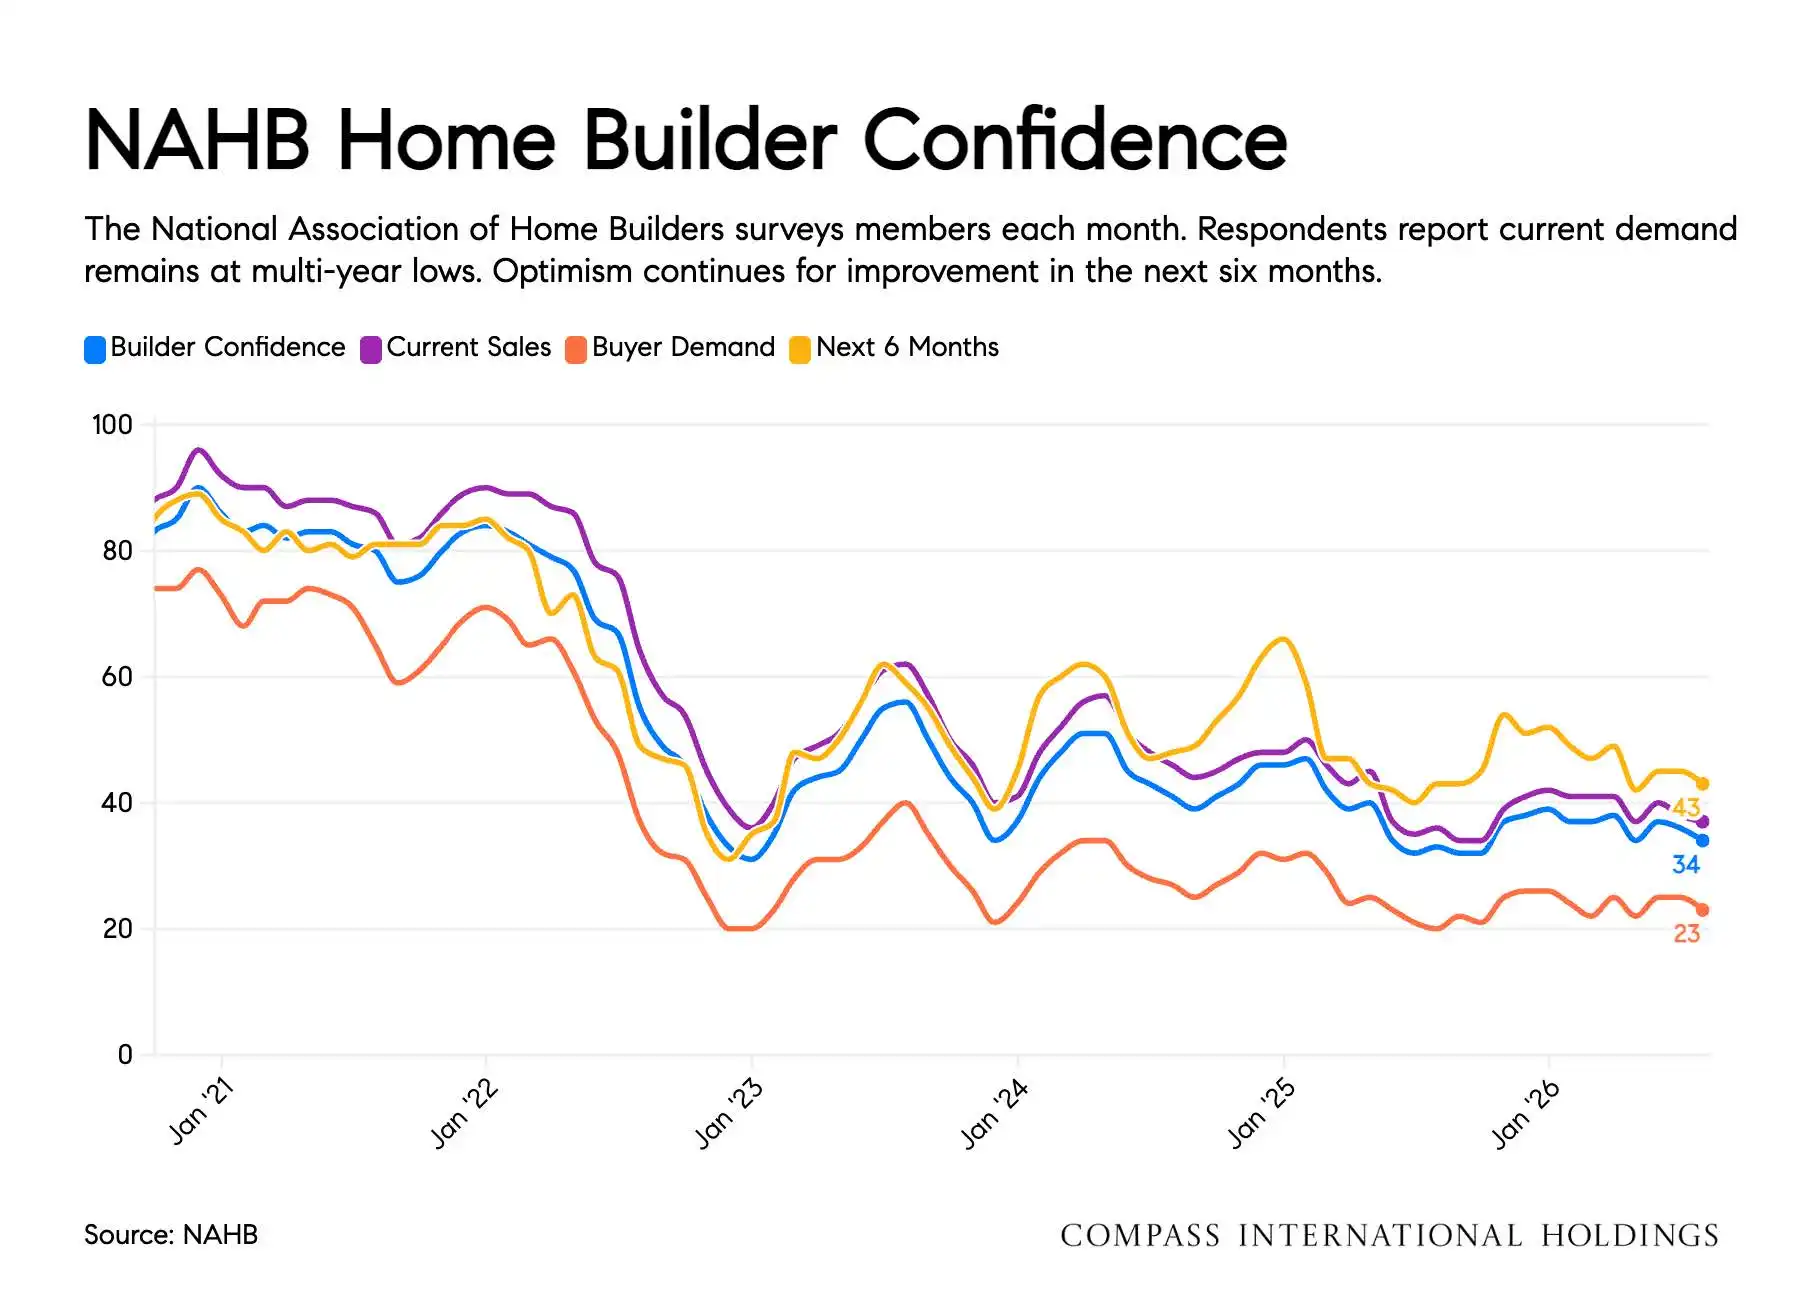
New Construction: New home sales and construction activity remained slow, with elevated months of supply.
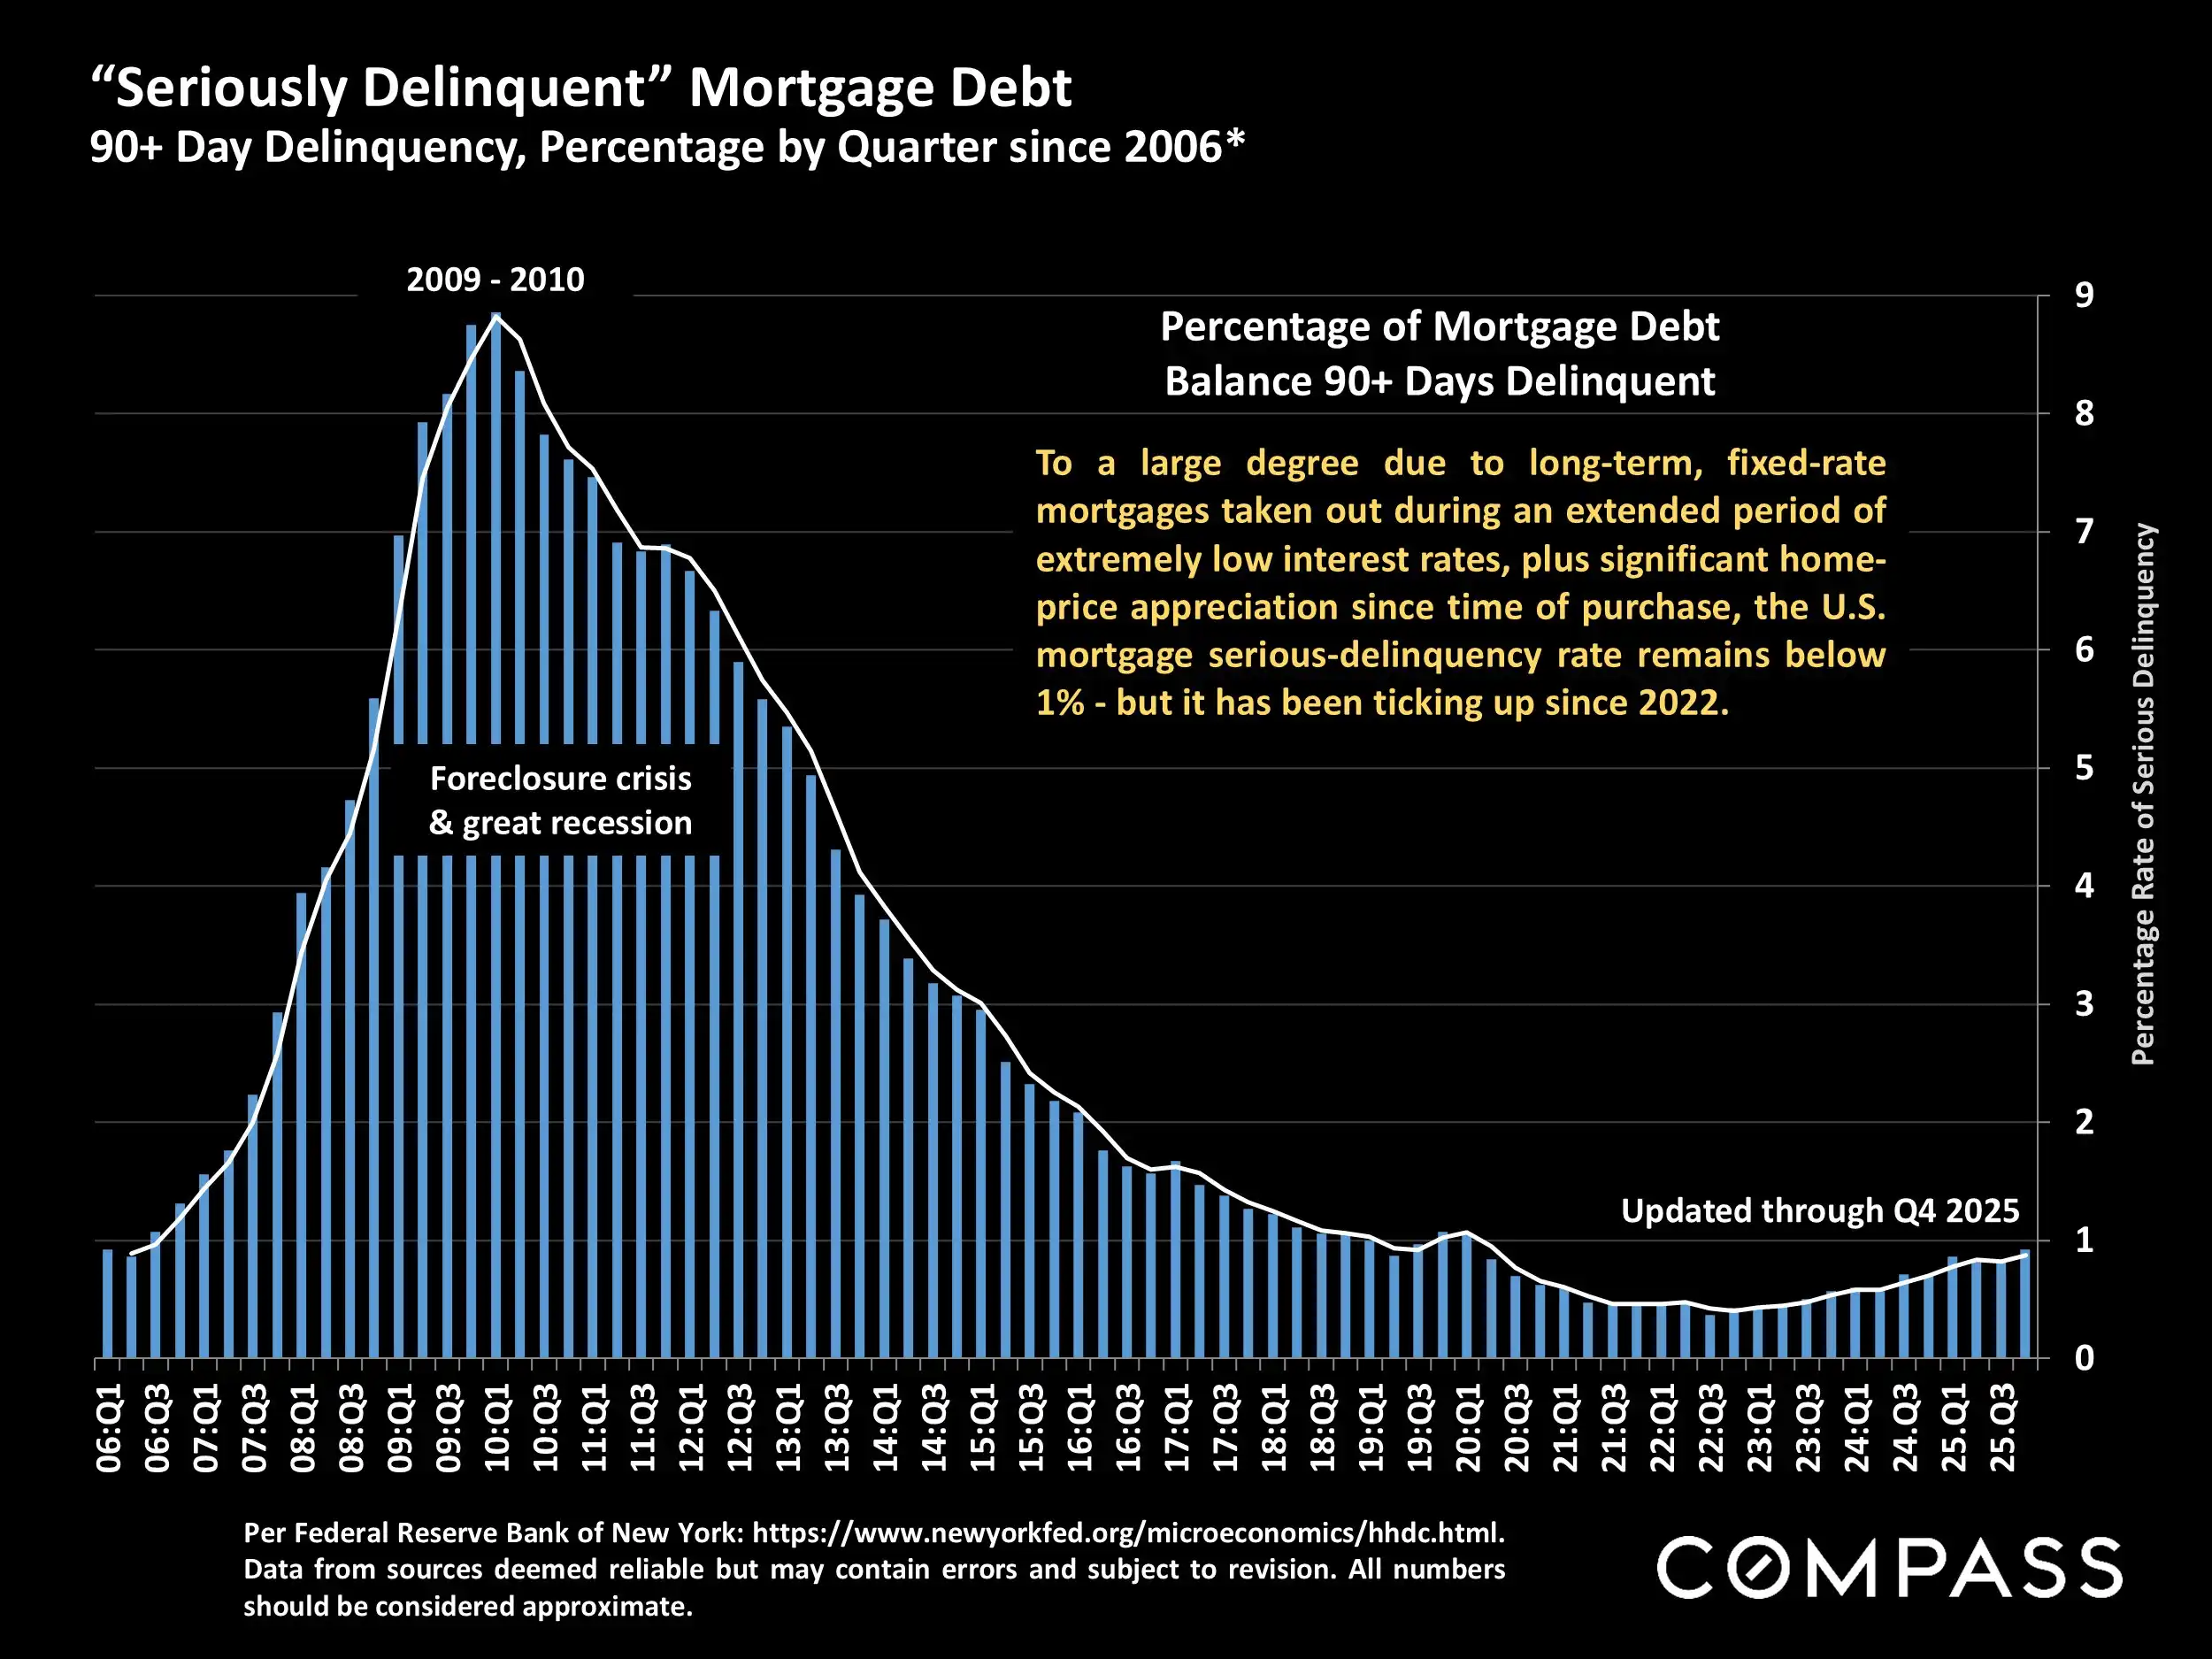
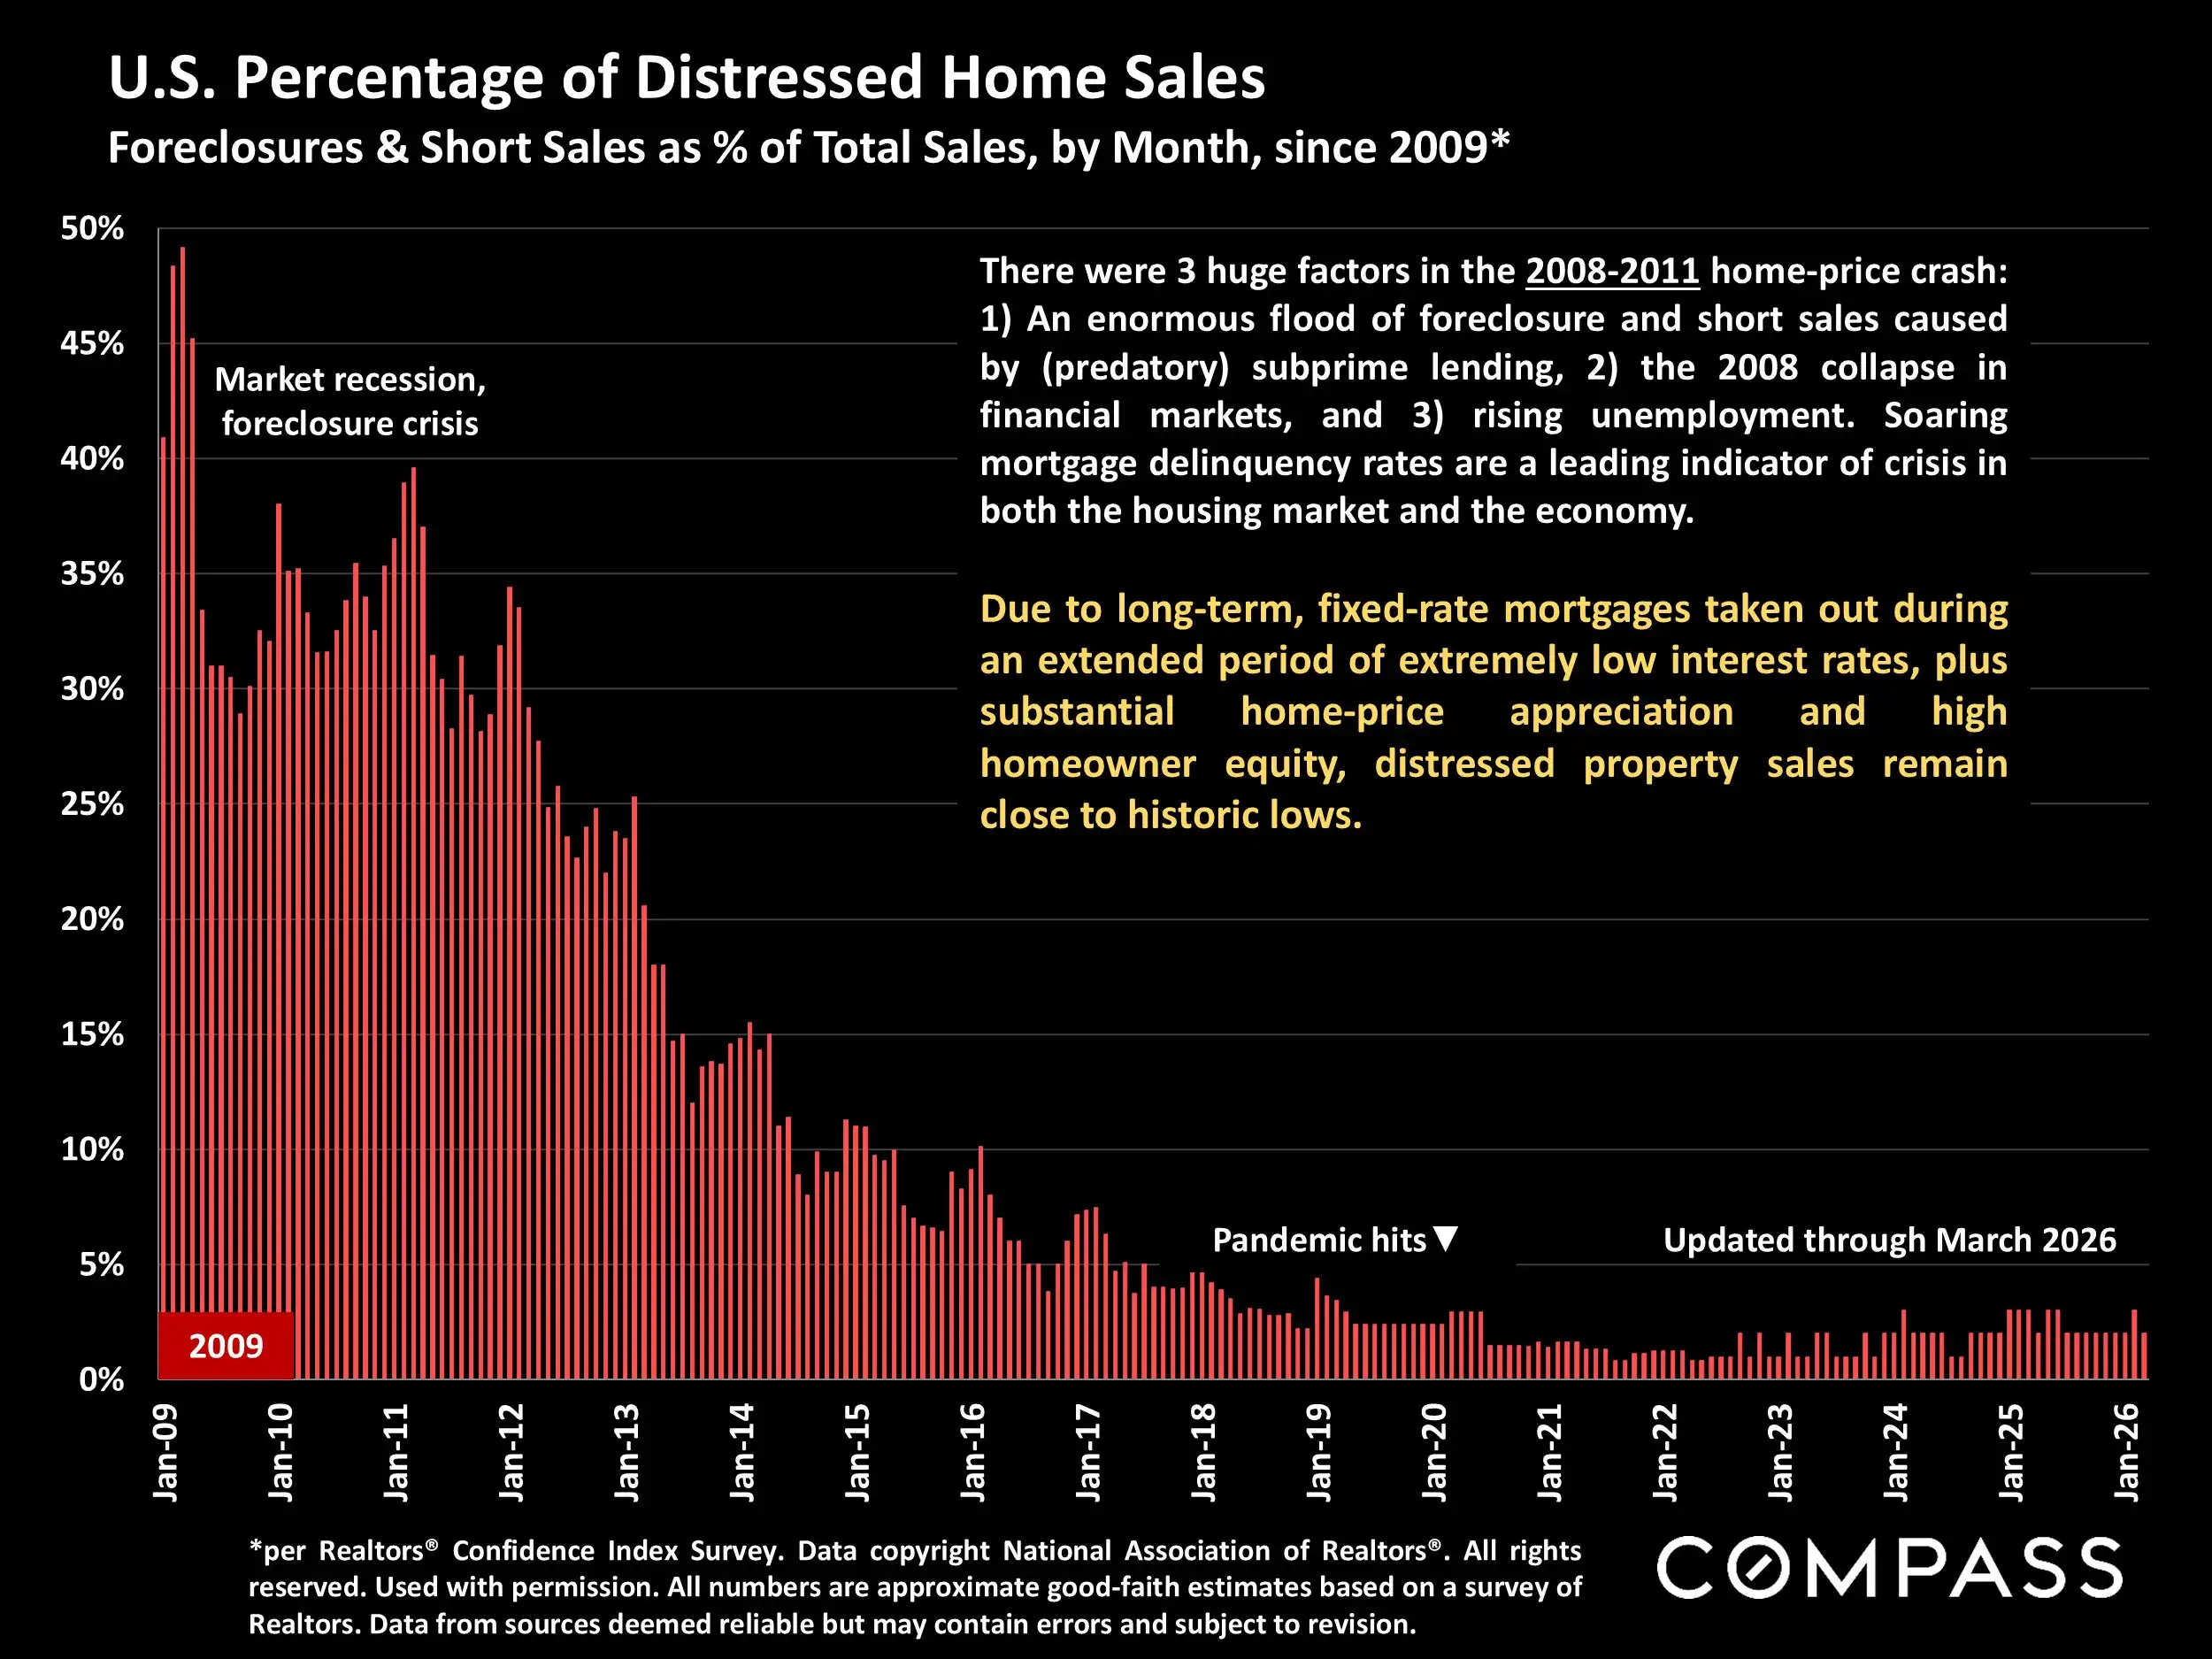
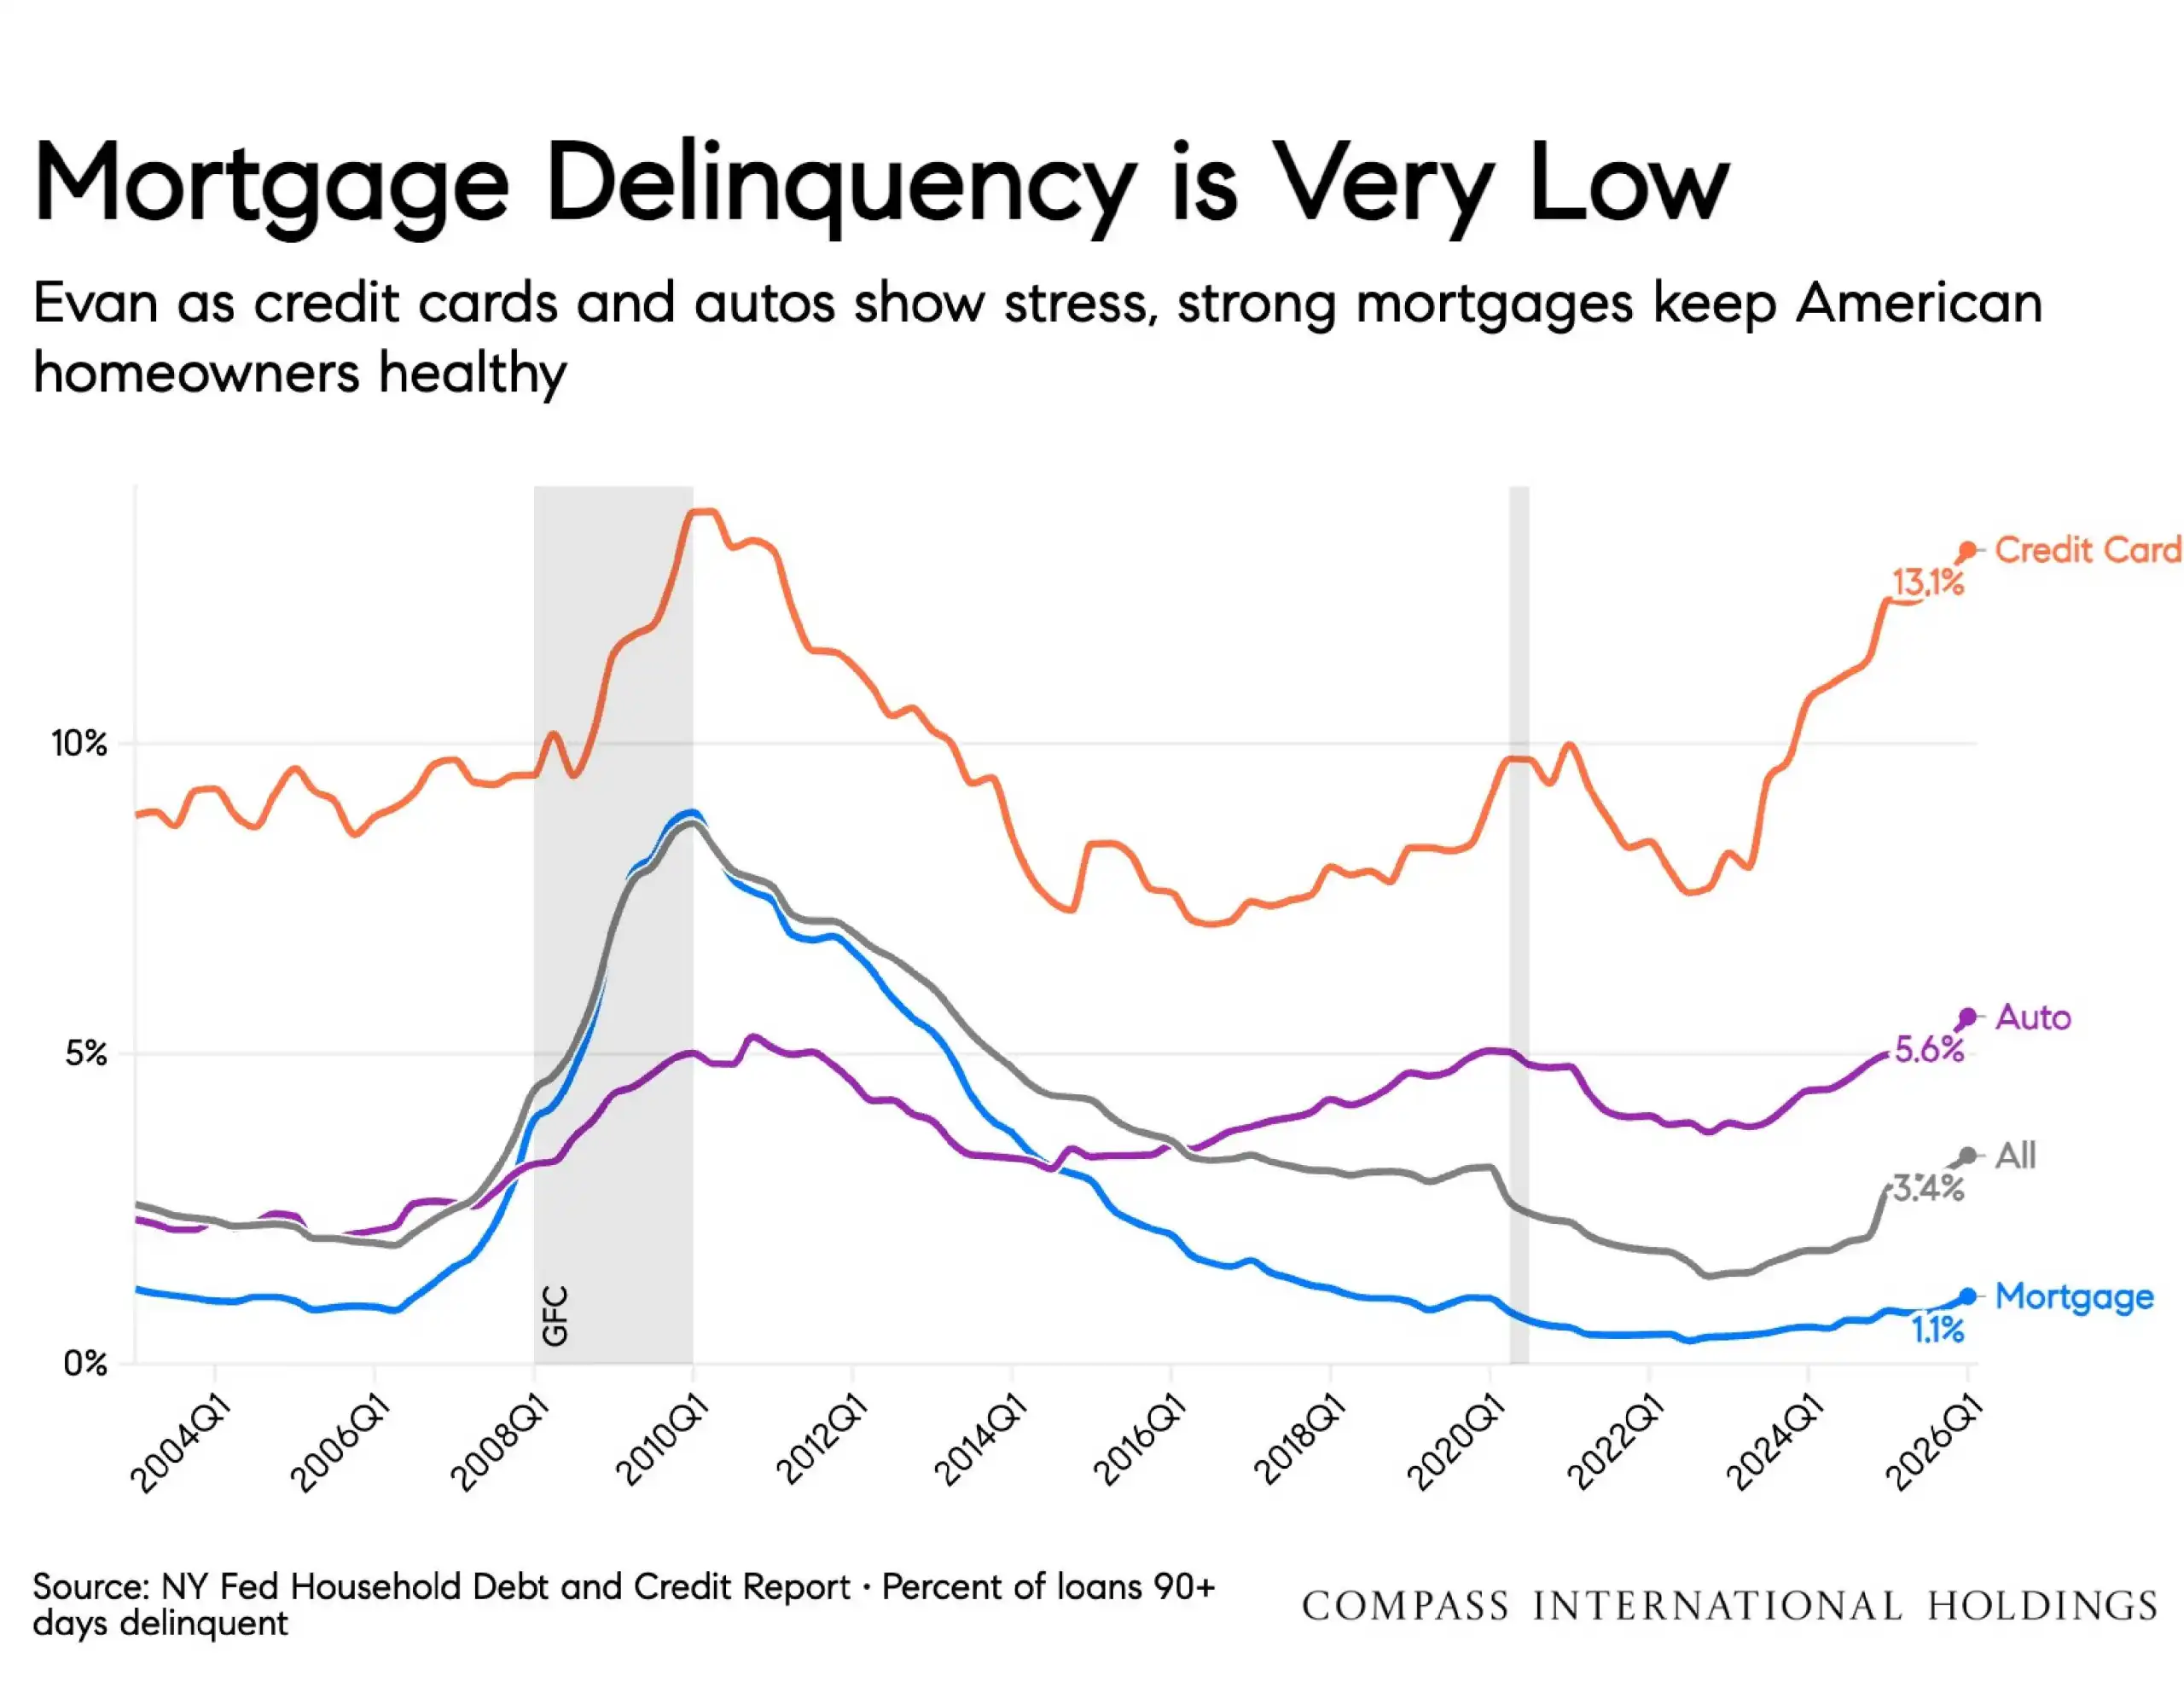
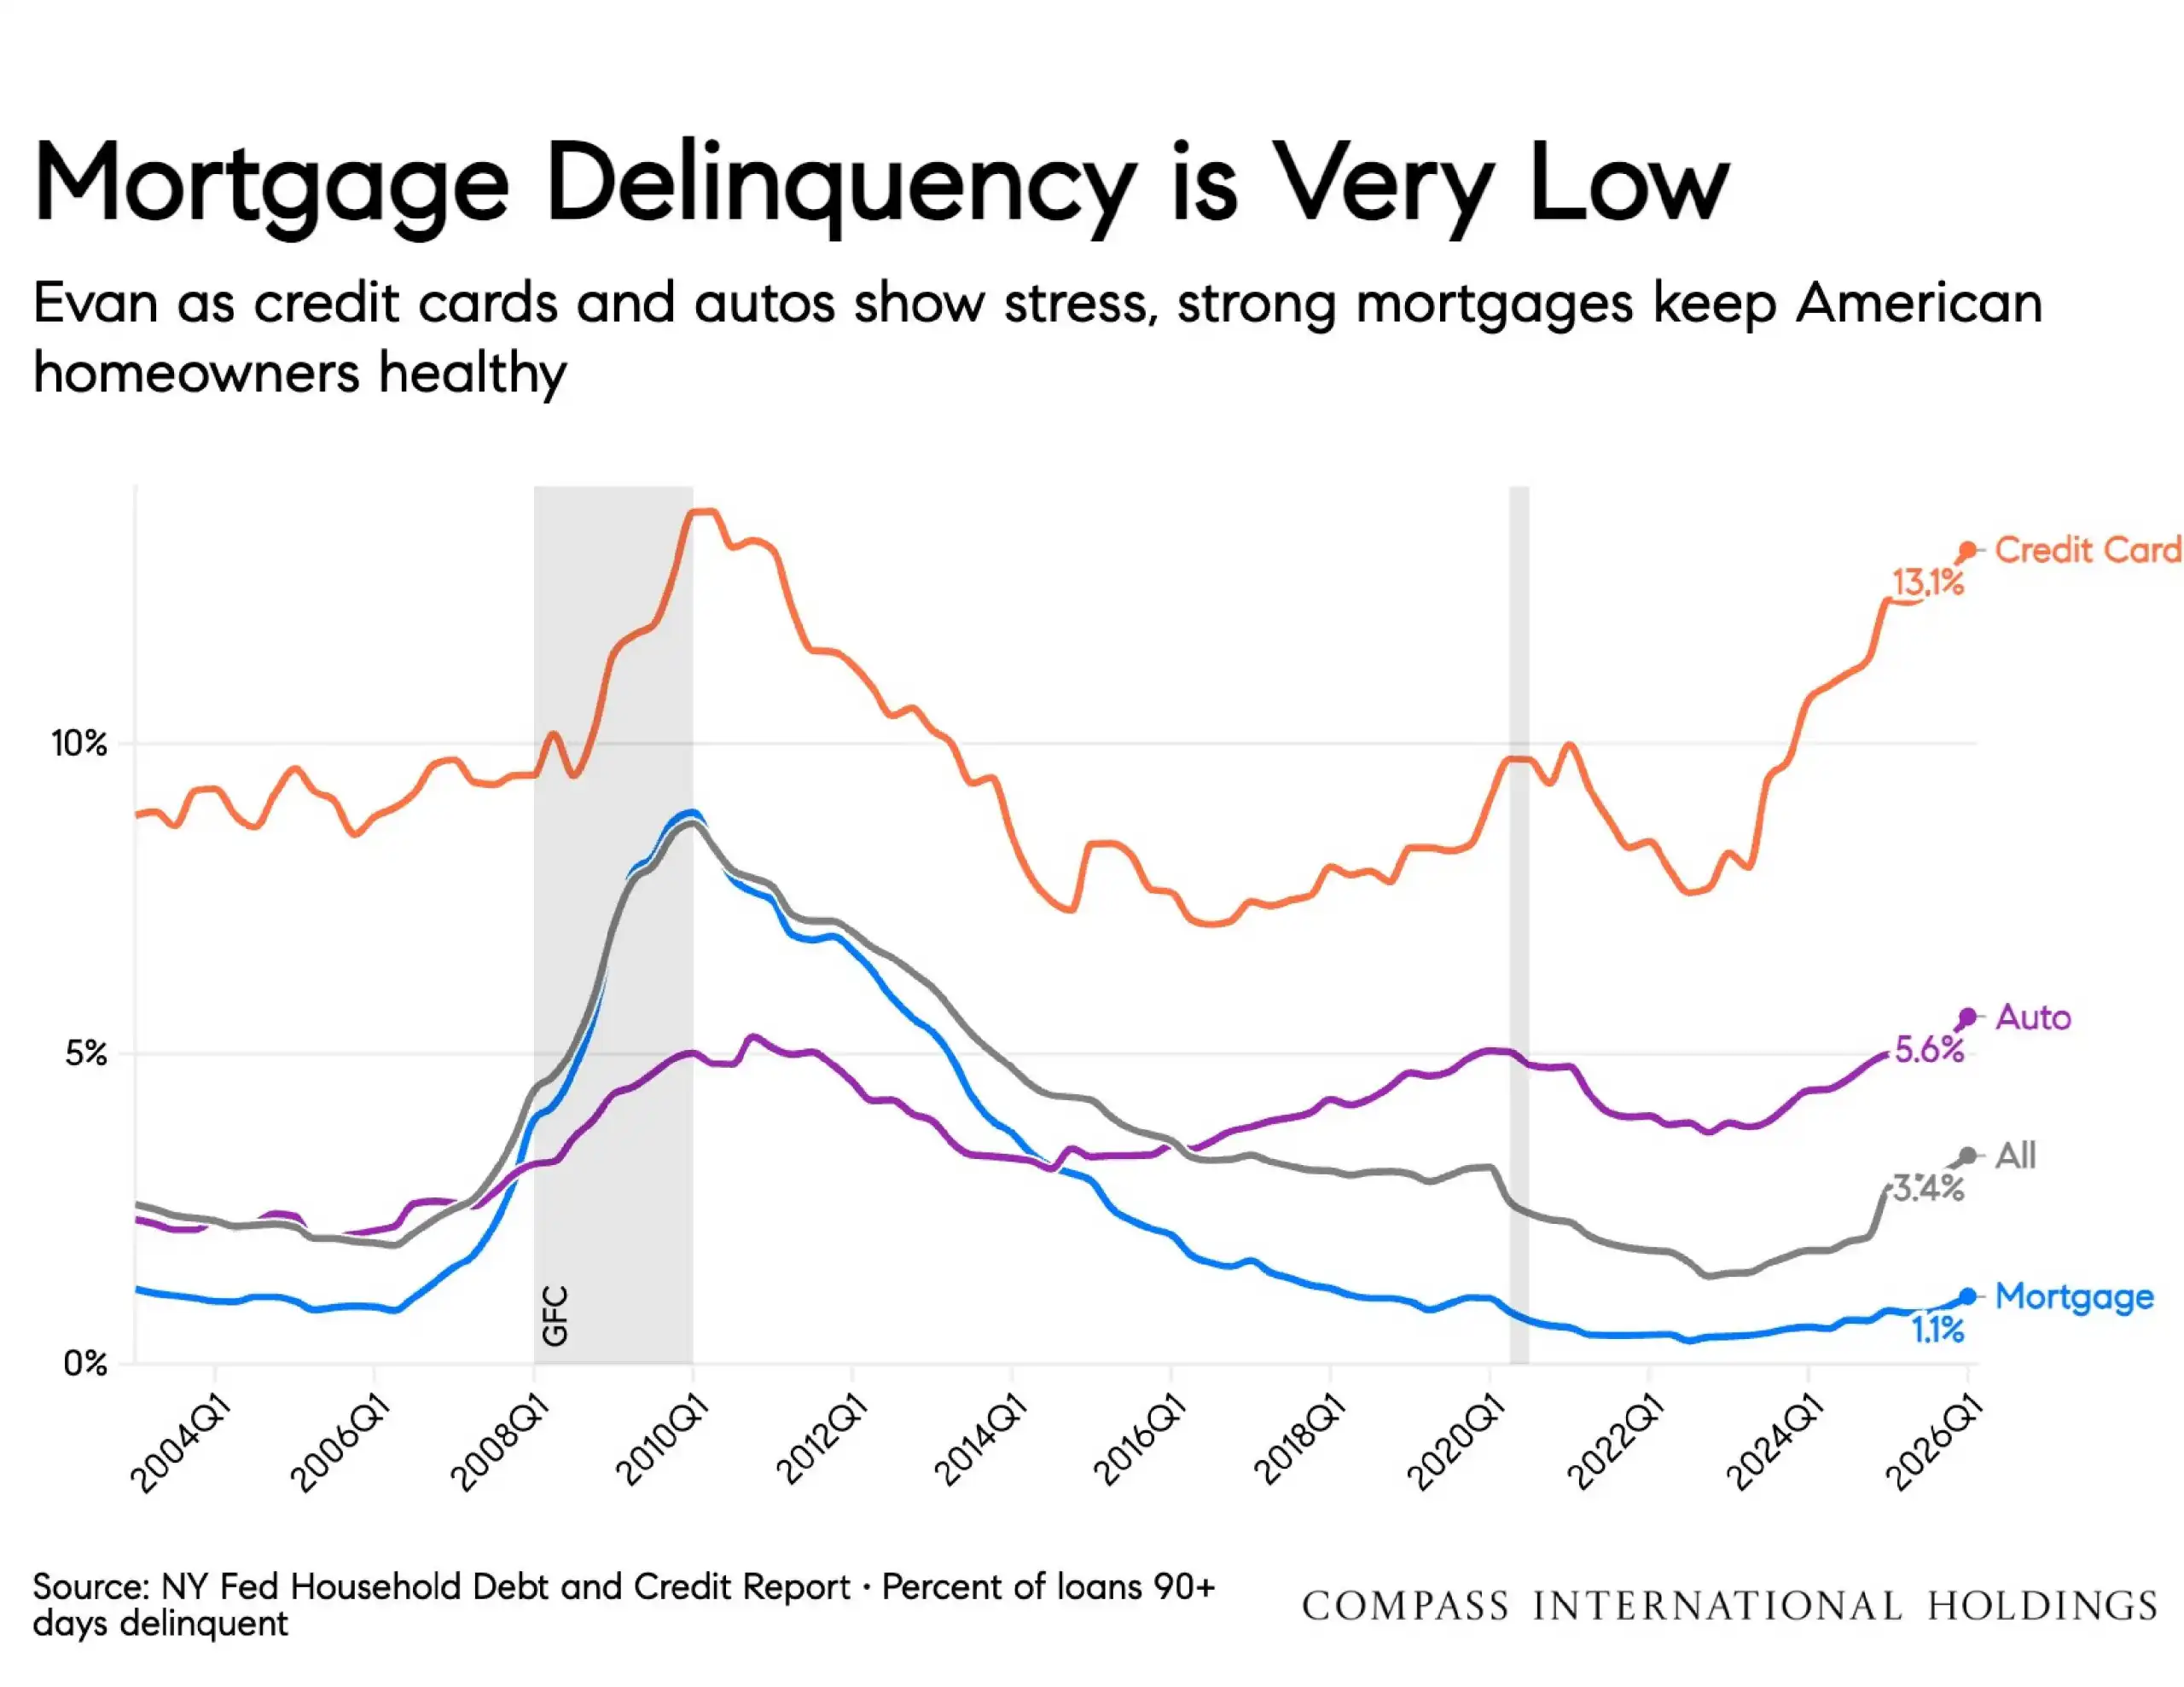
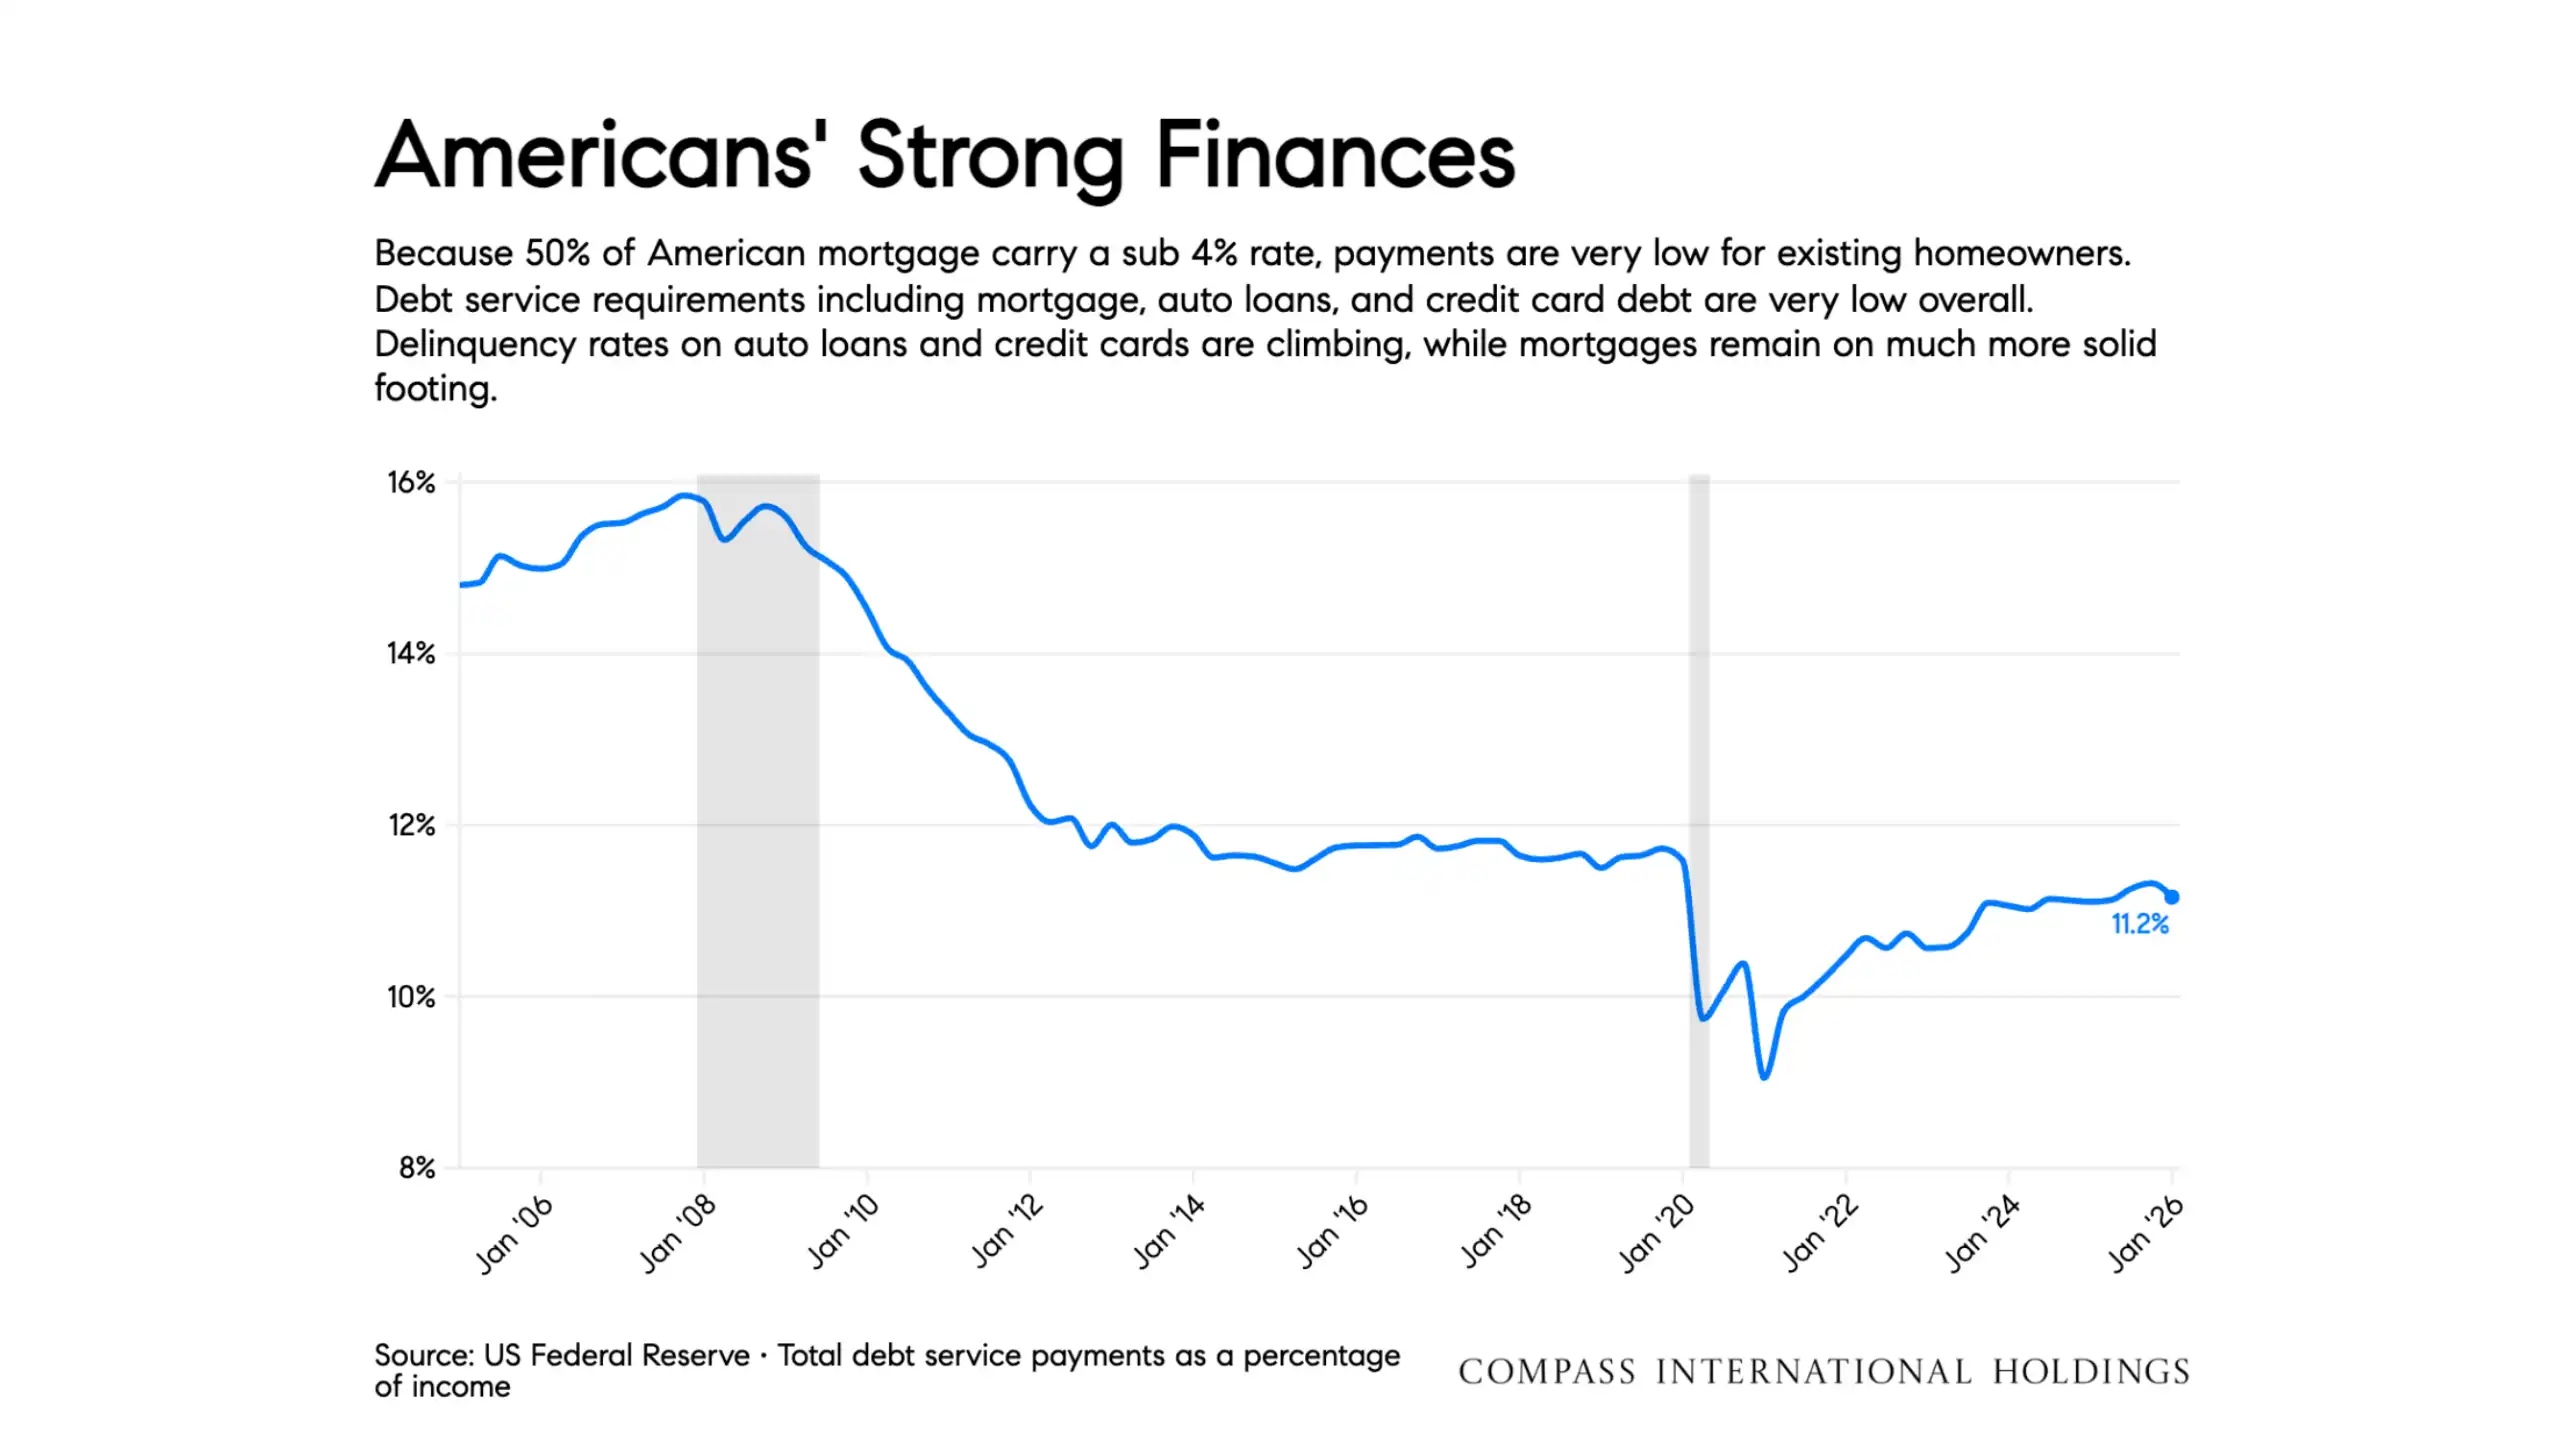
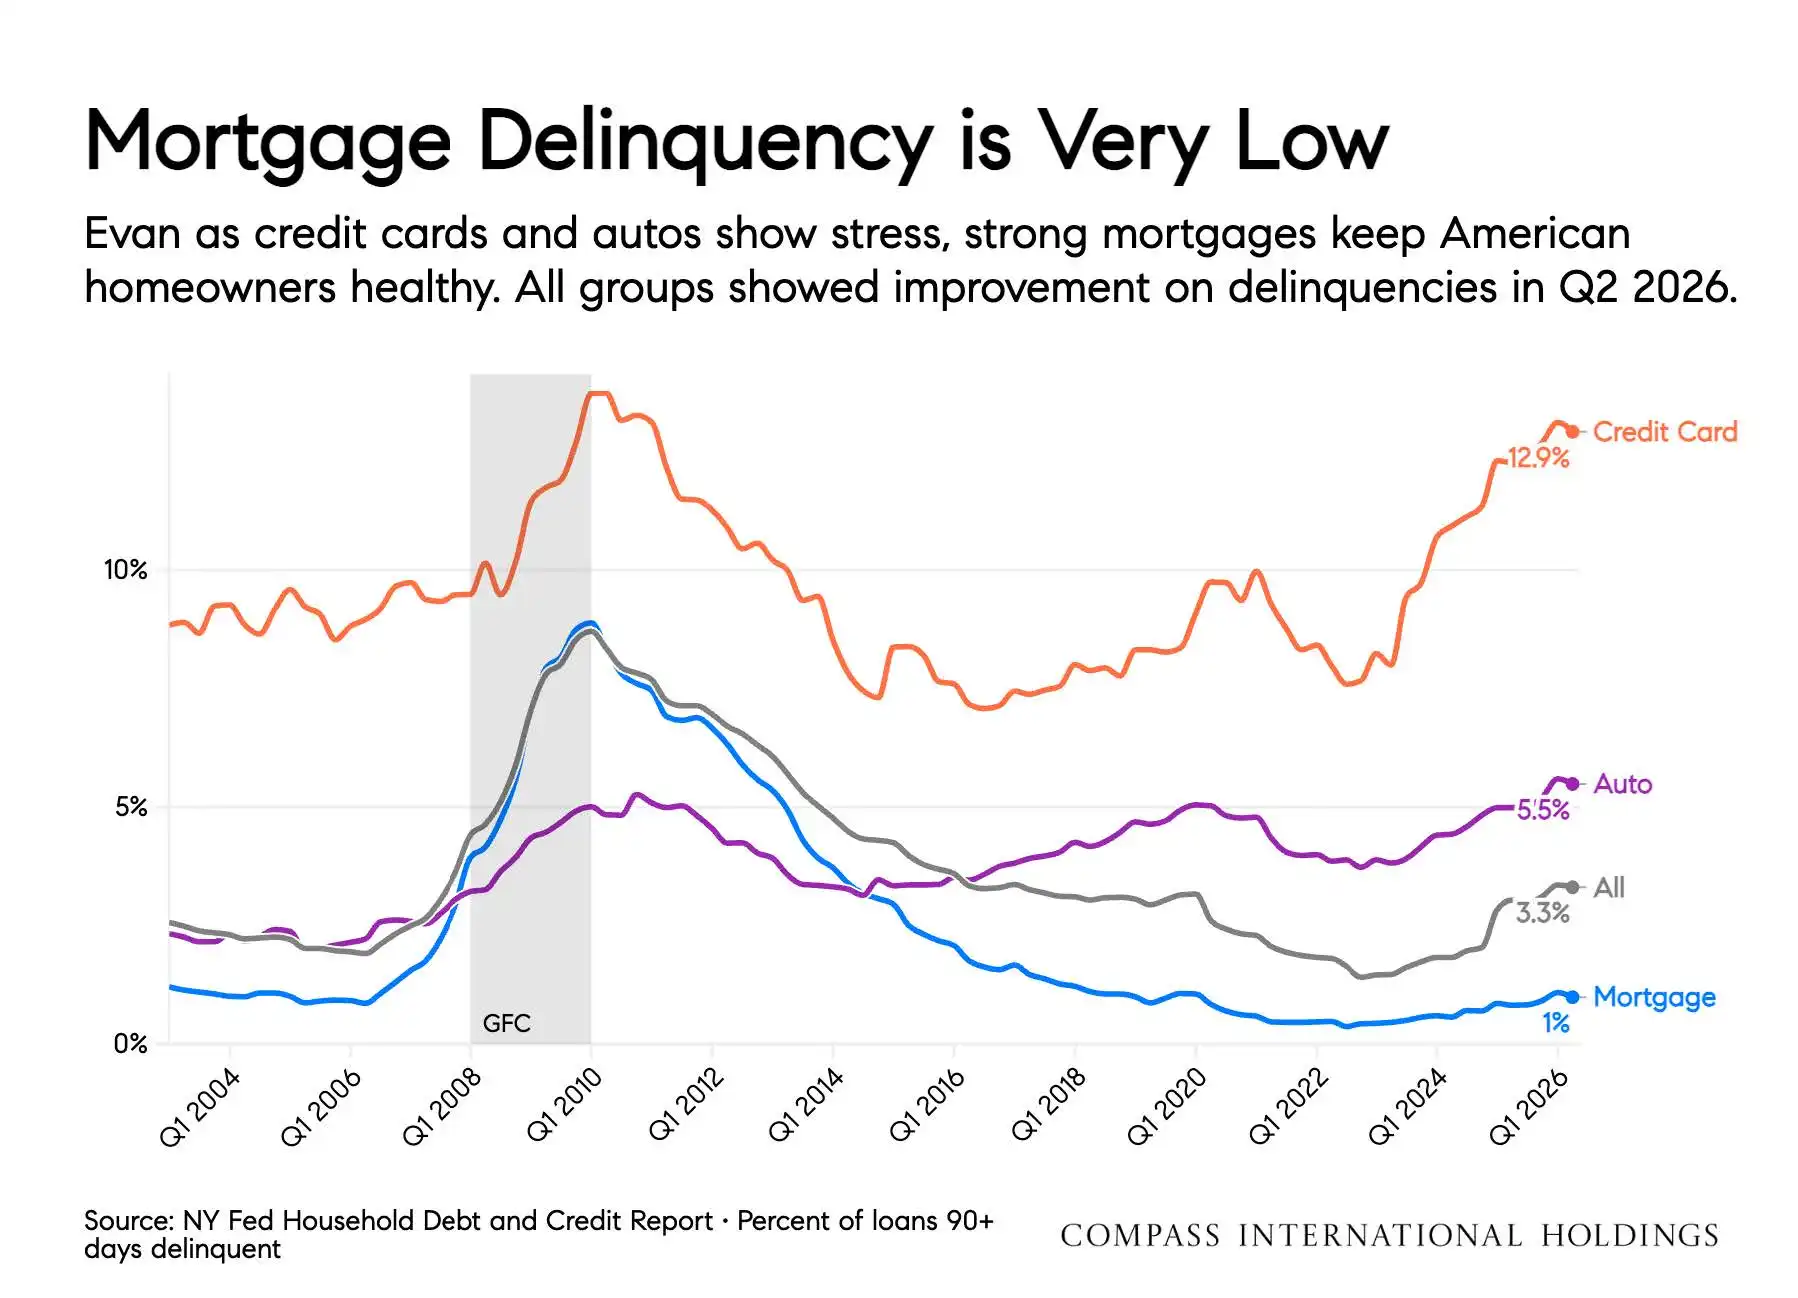
Mortgage Delinquency: Mortgage delinquency remained very low, suggesting most homeowners are still financially stable.
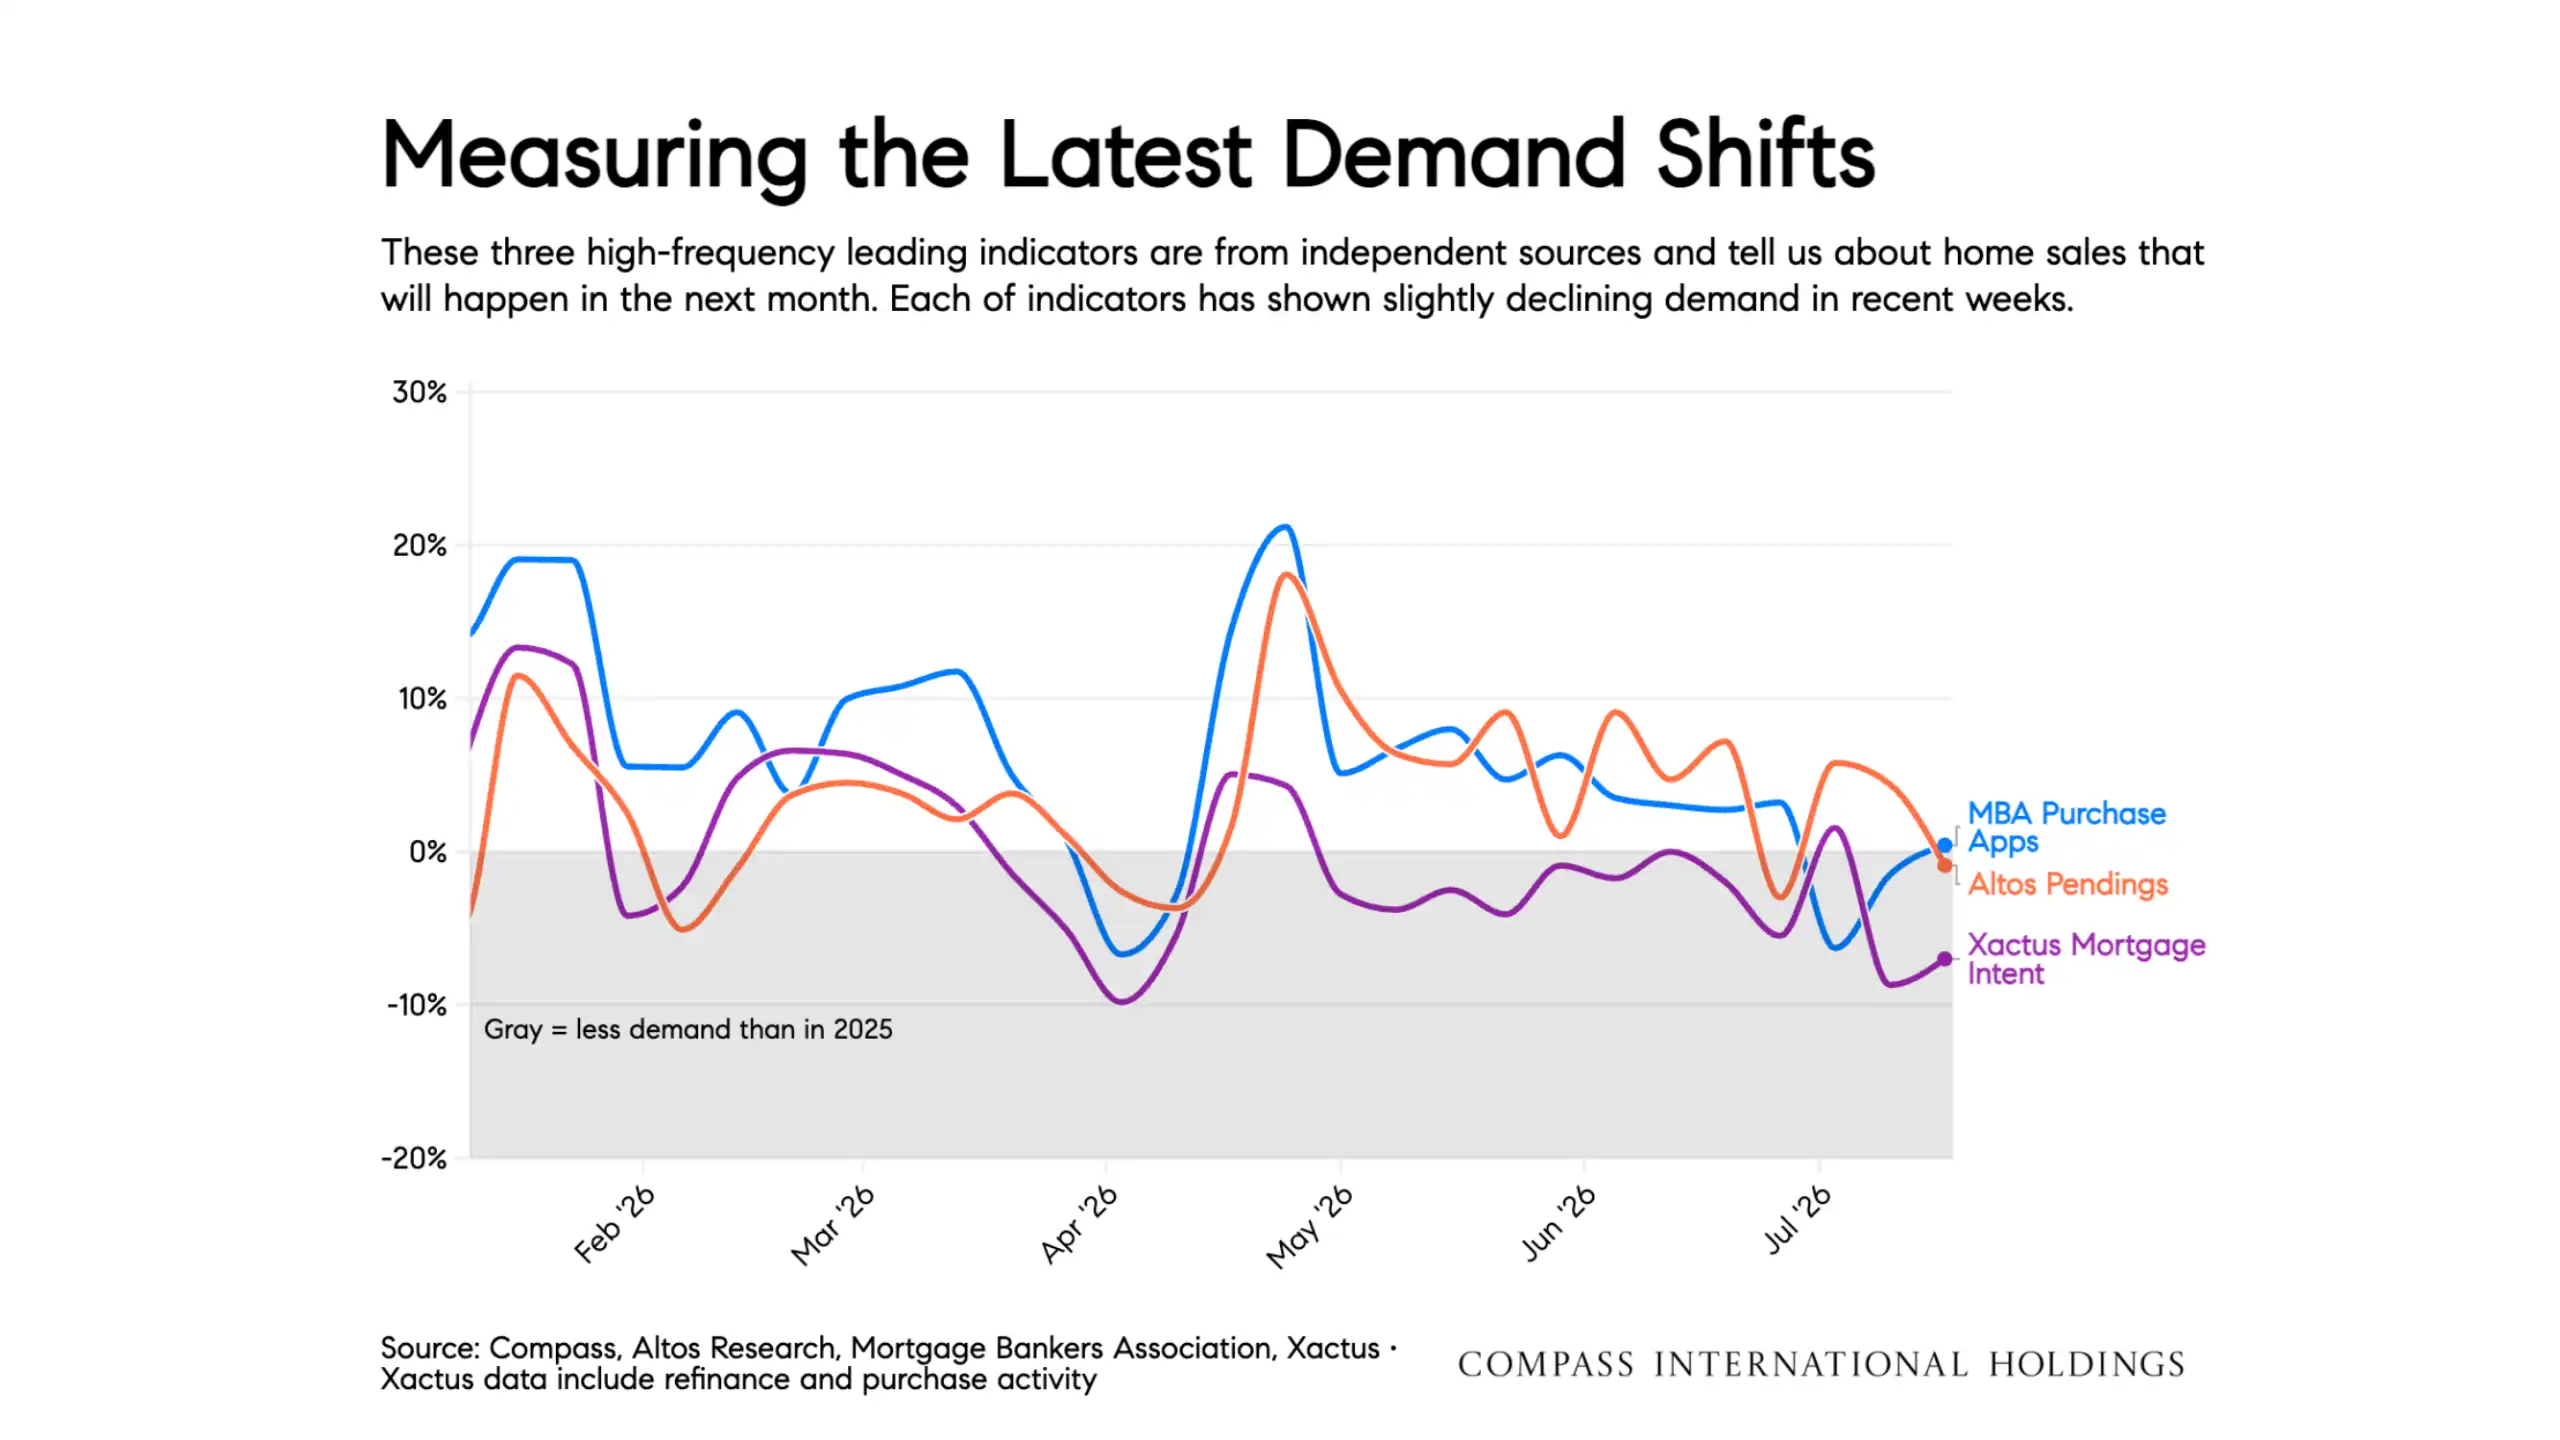
The national housing market entered the second half of 2026 with more cautious momentum as higher mortgage rates began to weigh on buyer activity. Through the end of June, home sales were still running approximately 4% ahead of 2025, but mortgage rates had moved back into the upper 6% range by July. That shift appears to be slowing demand after a somewhat more favorable first half of the year.
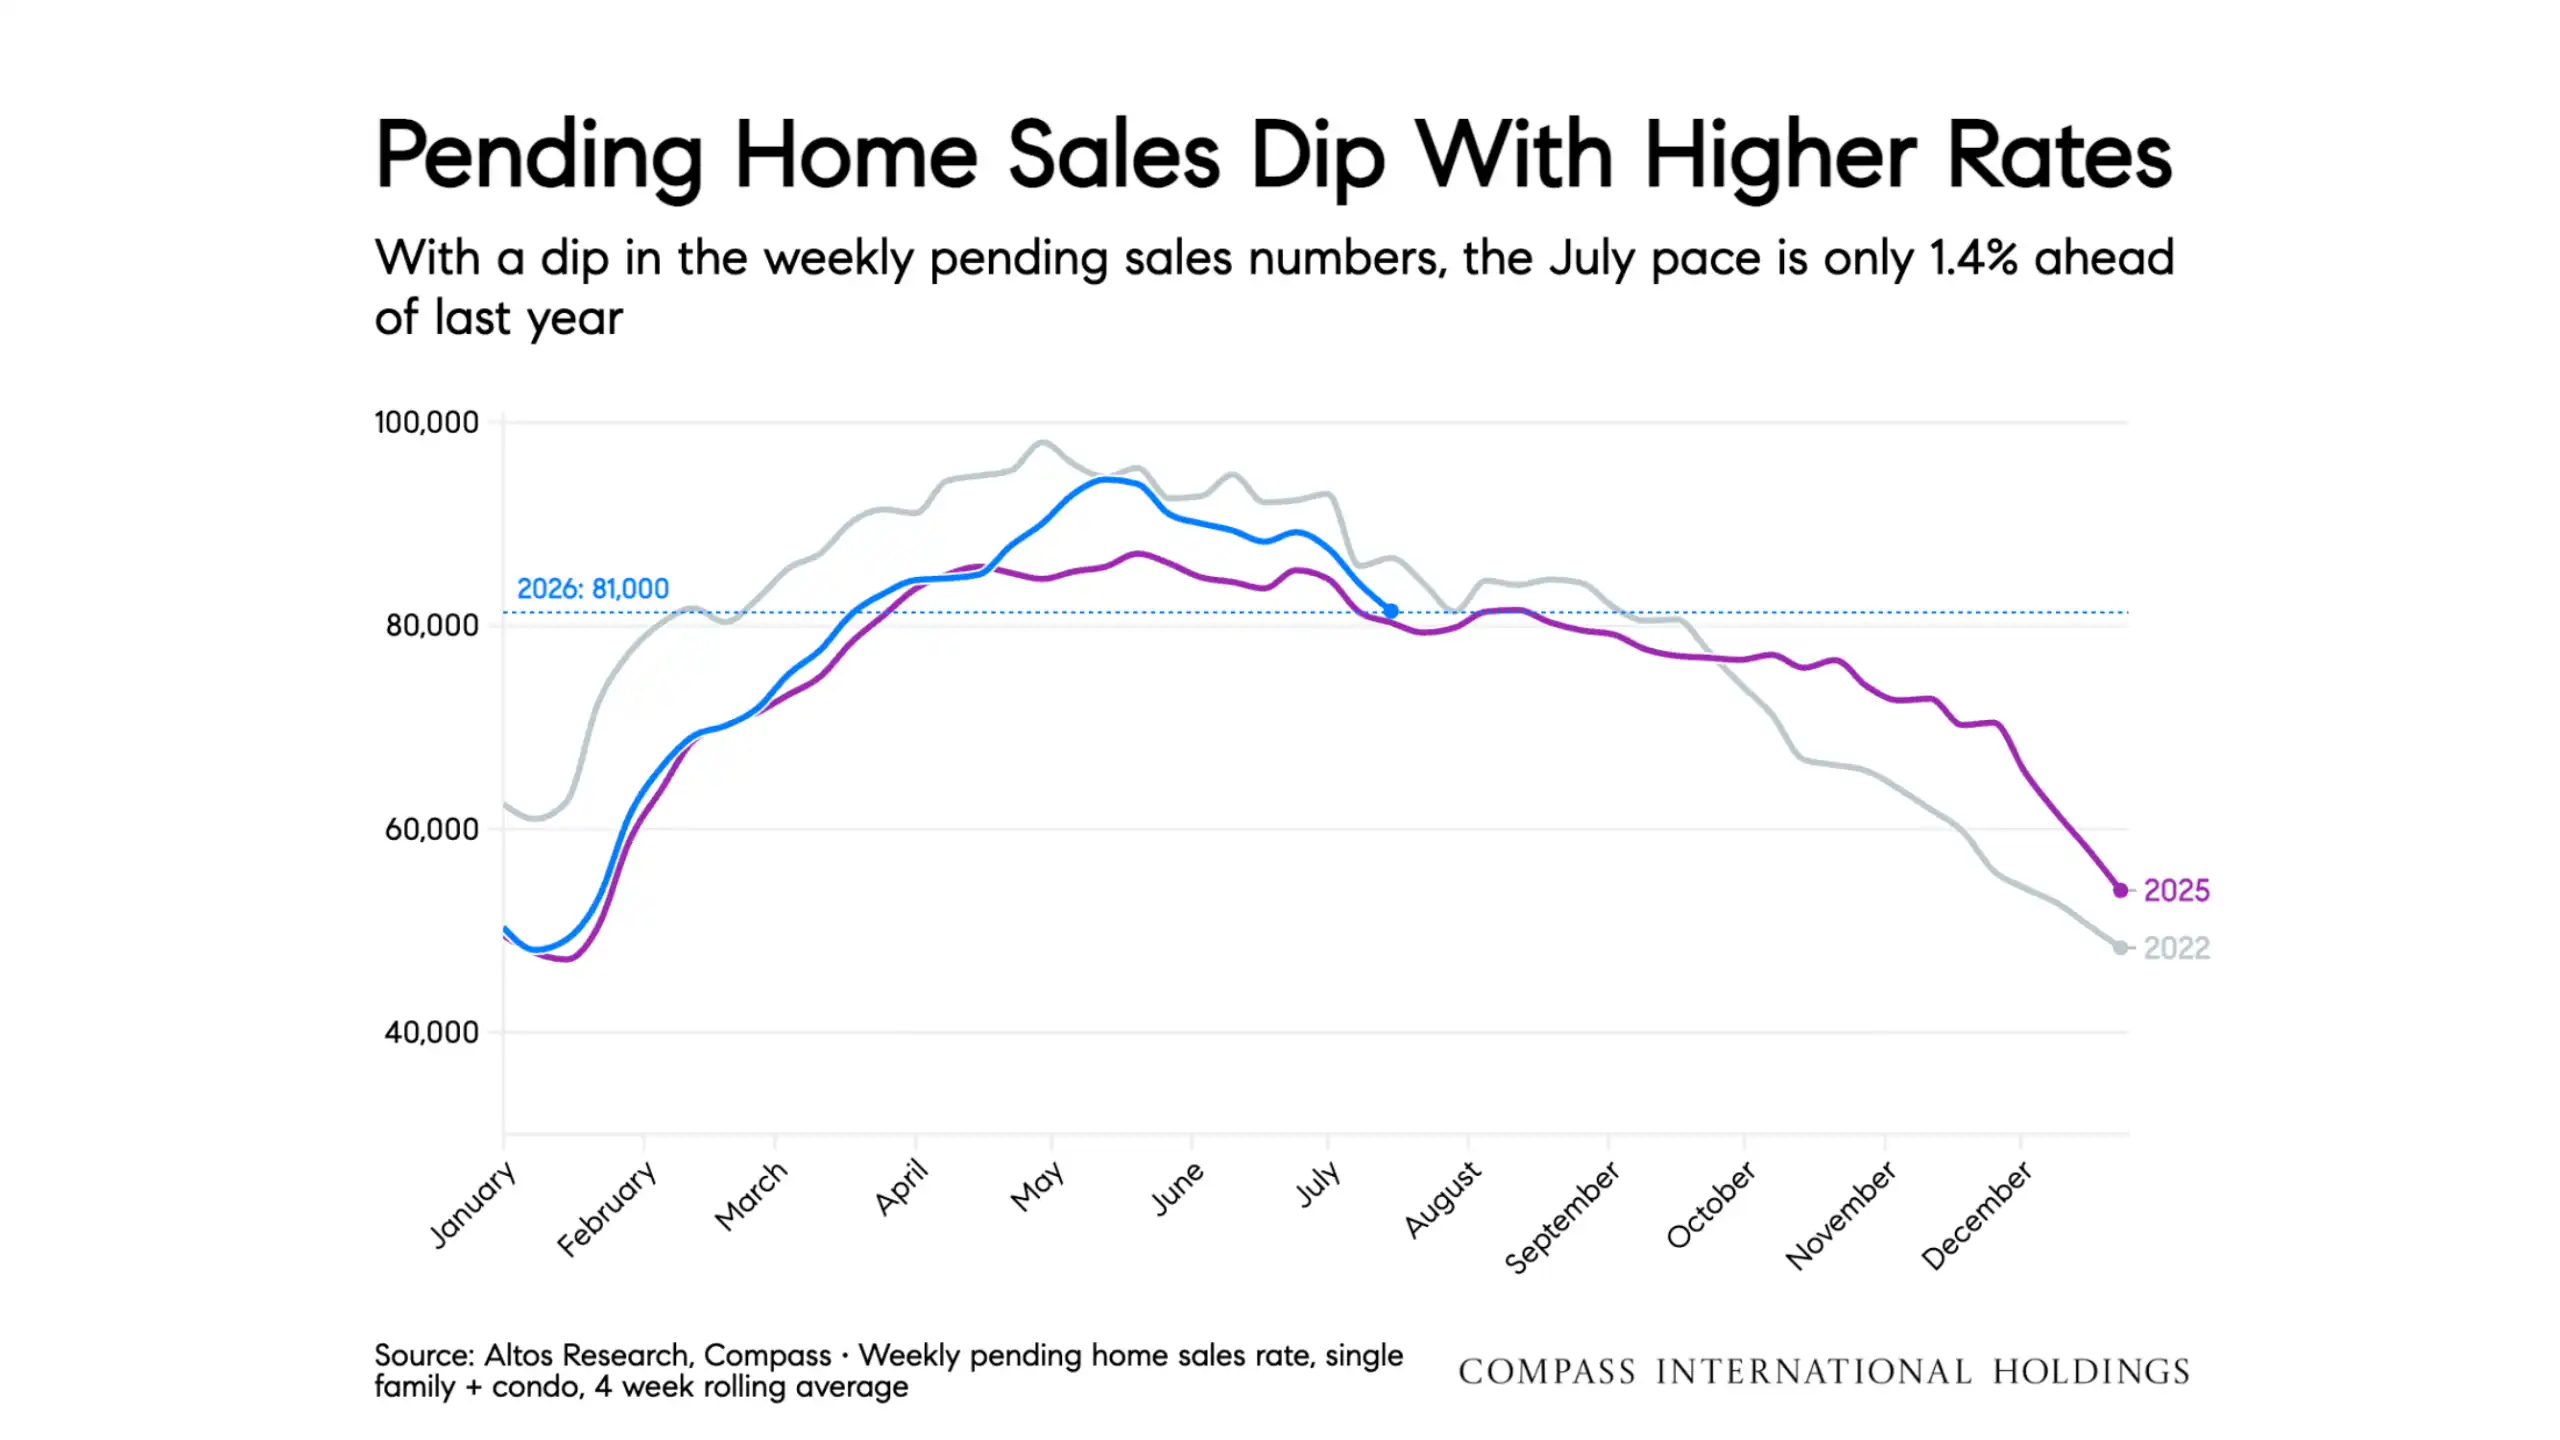
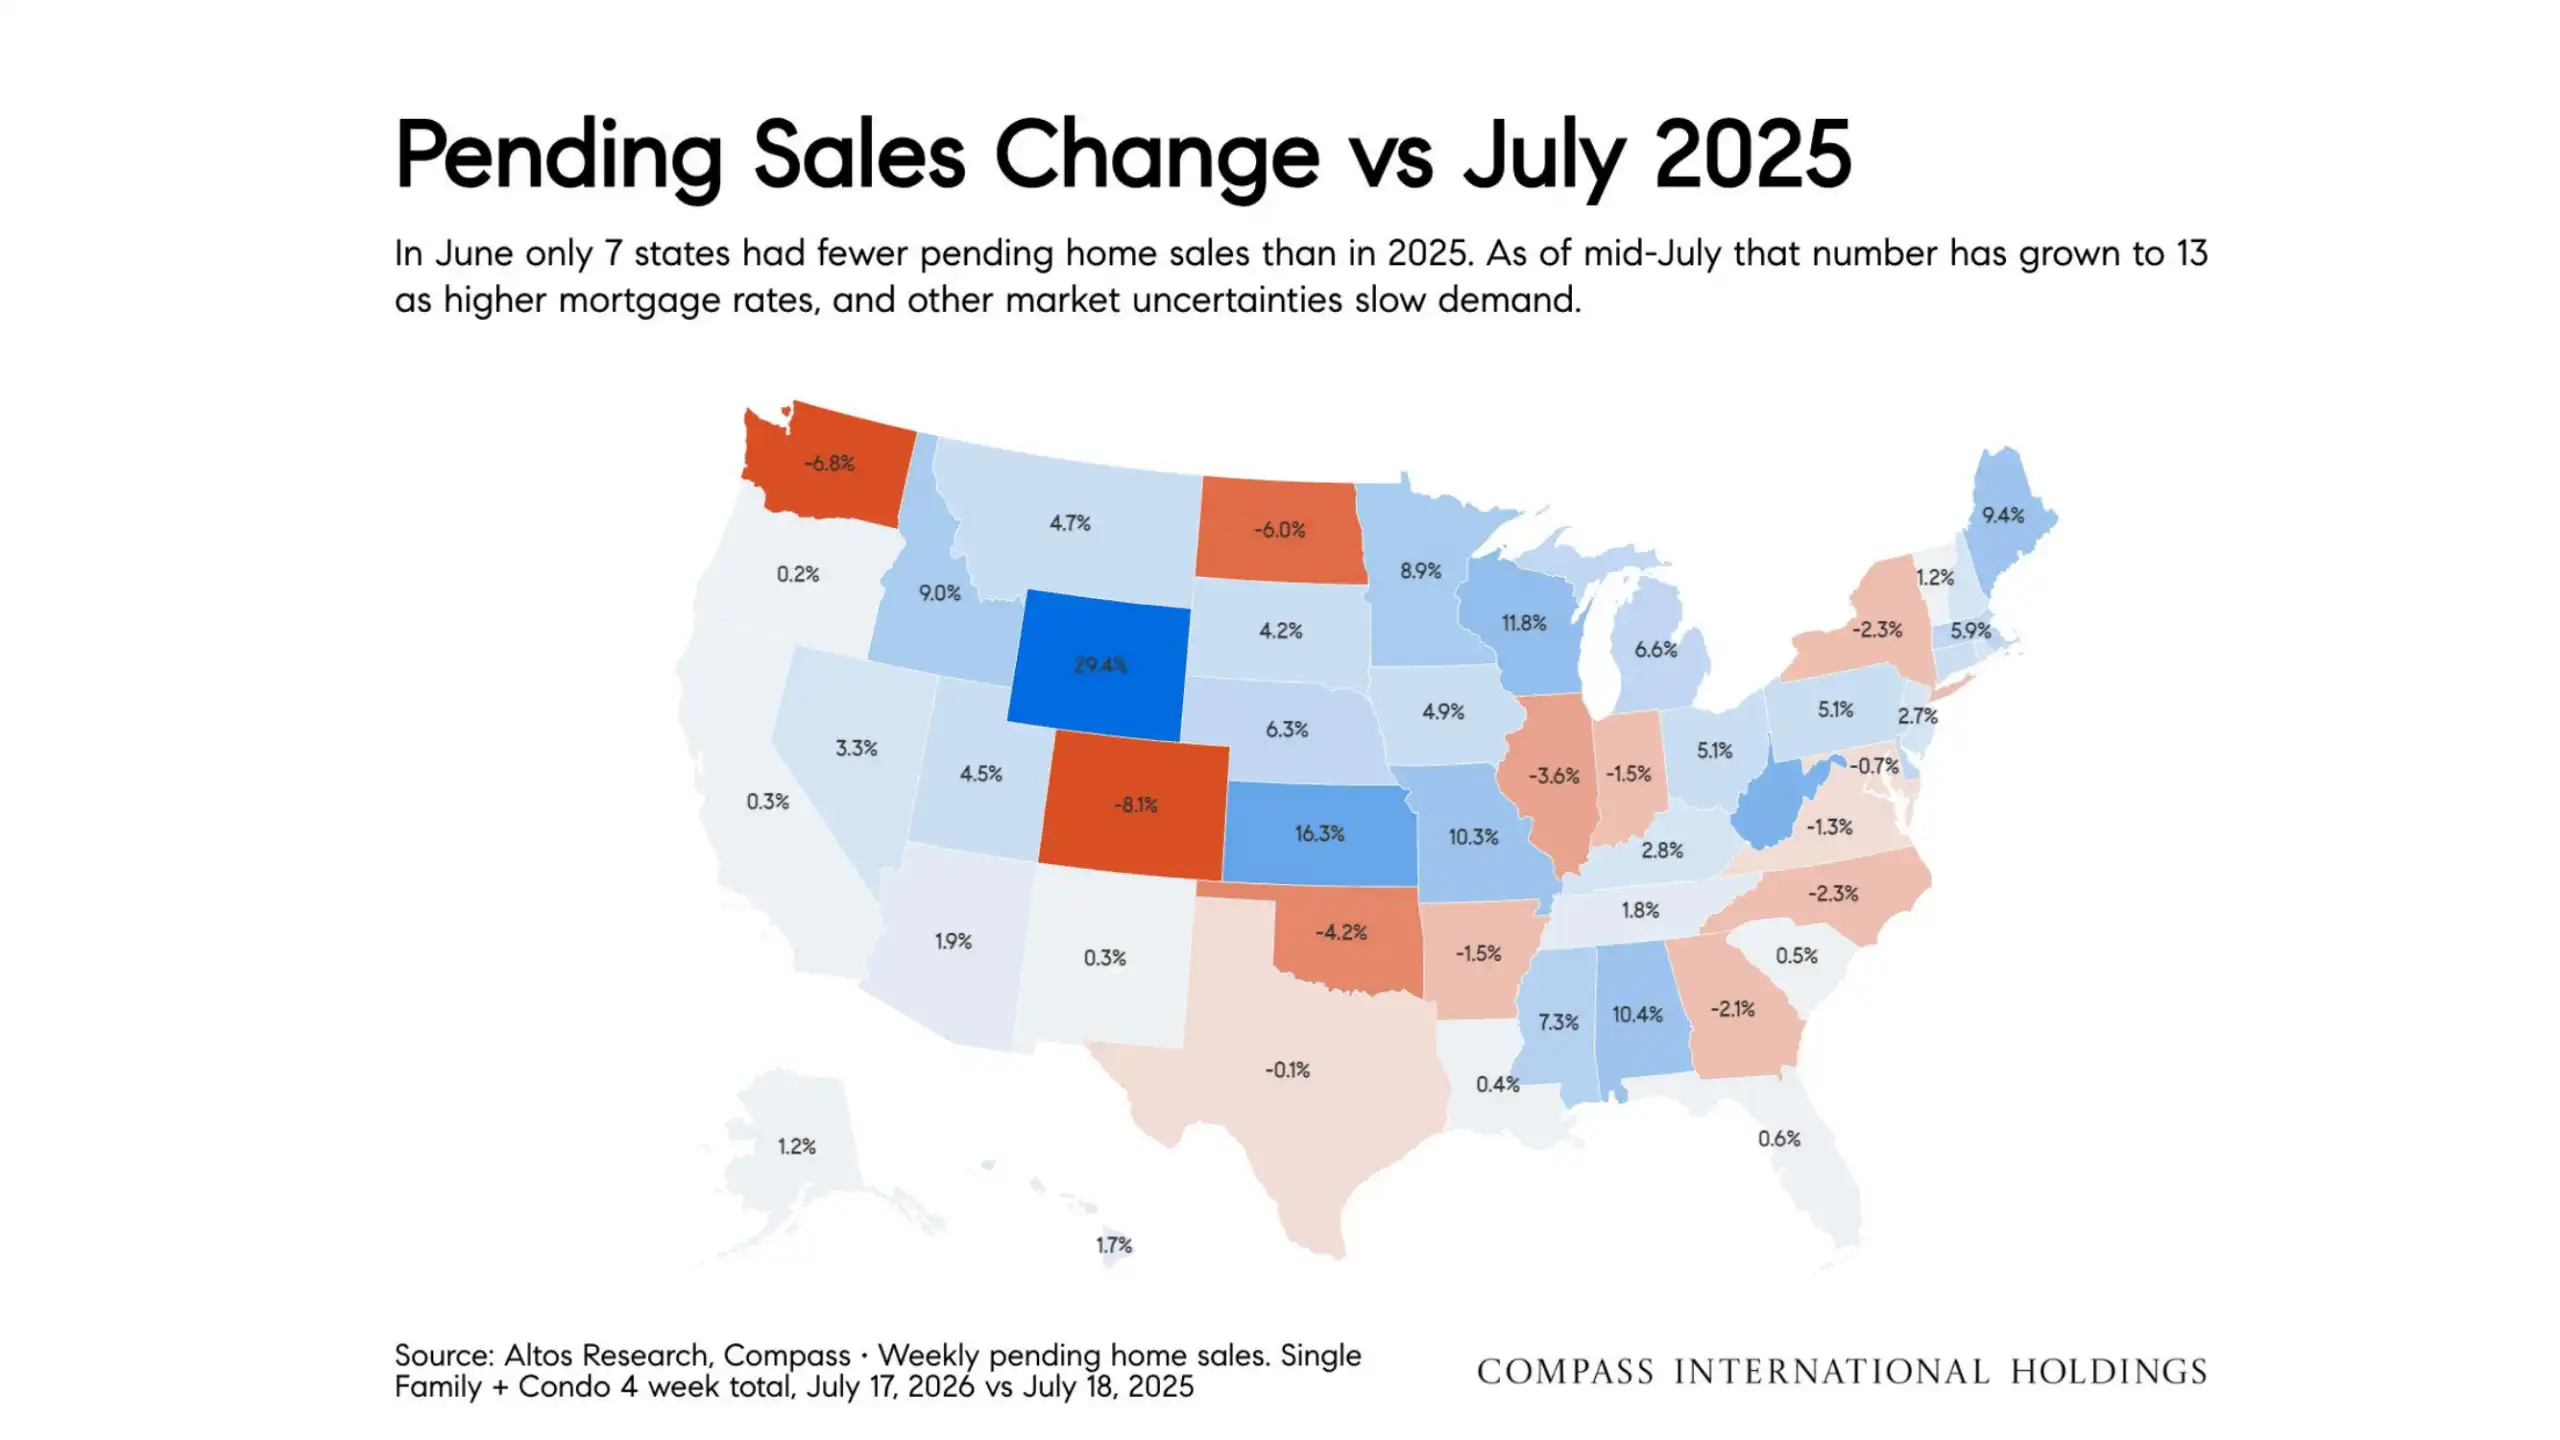
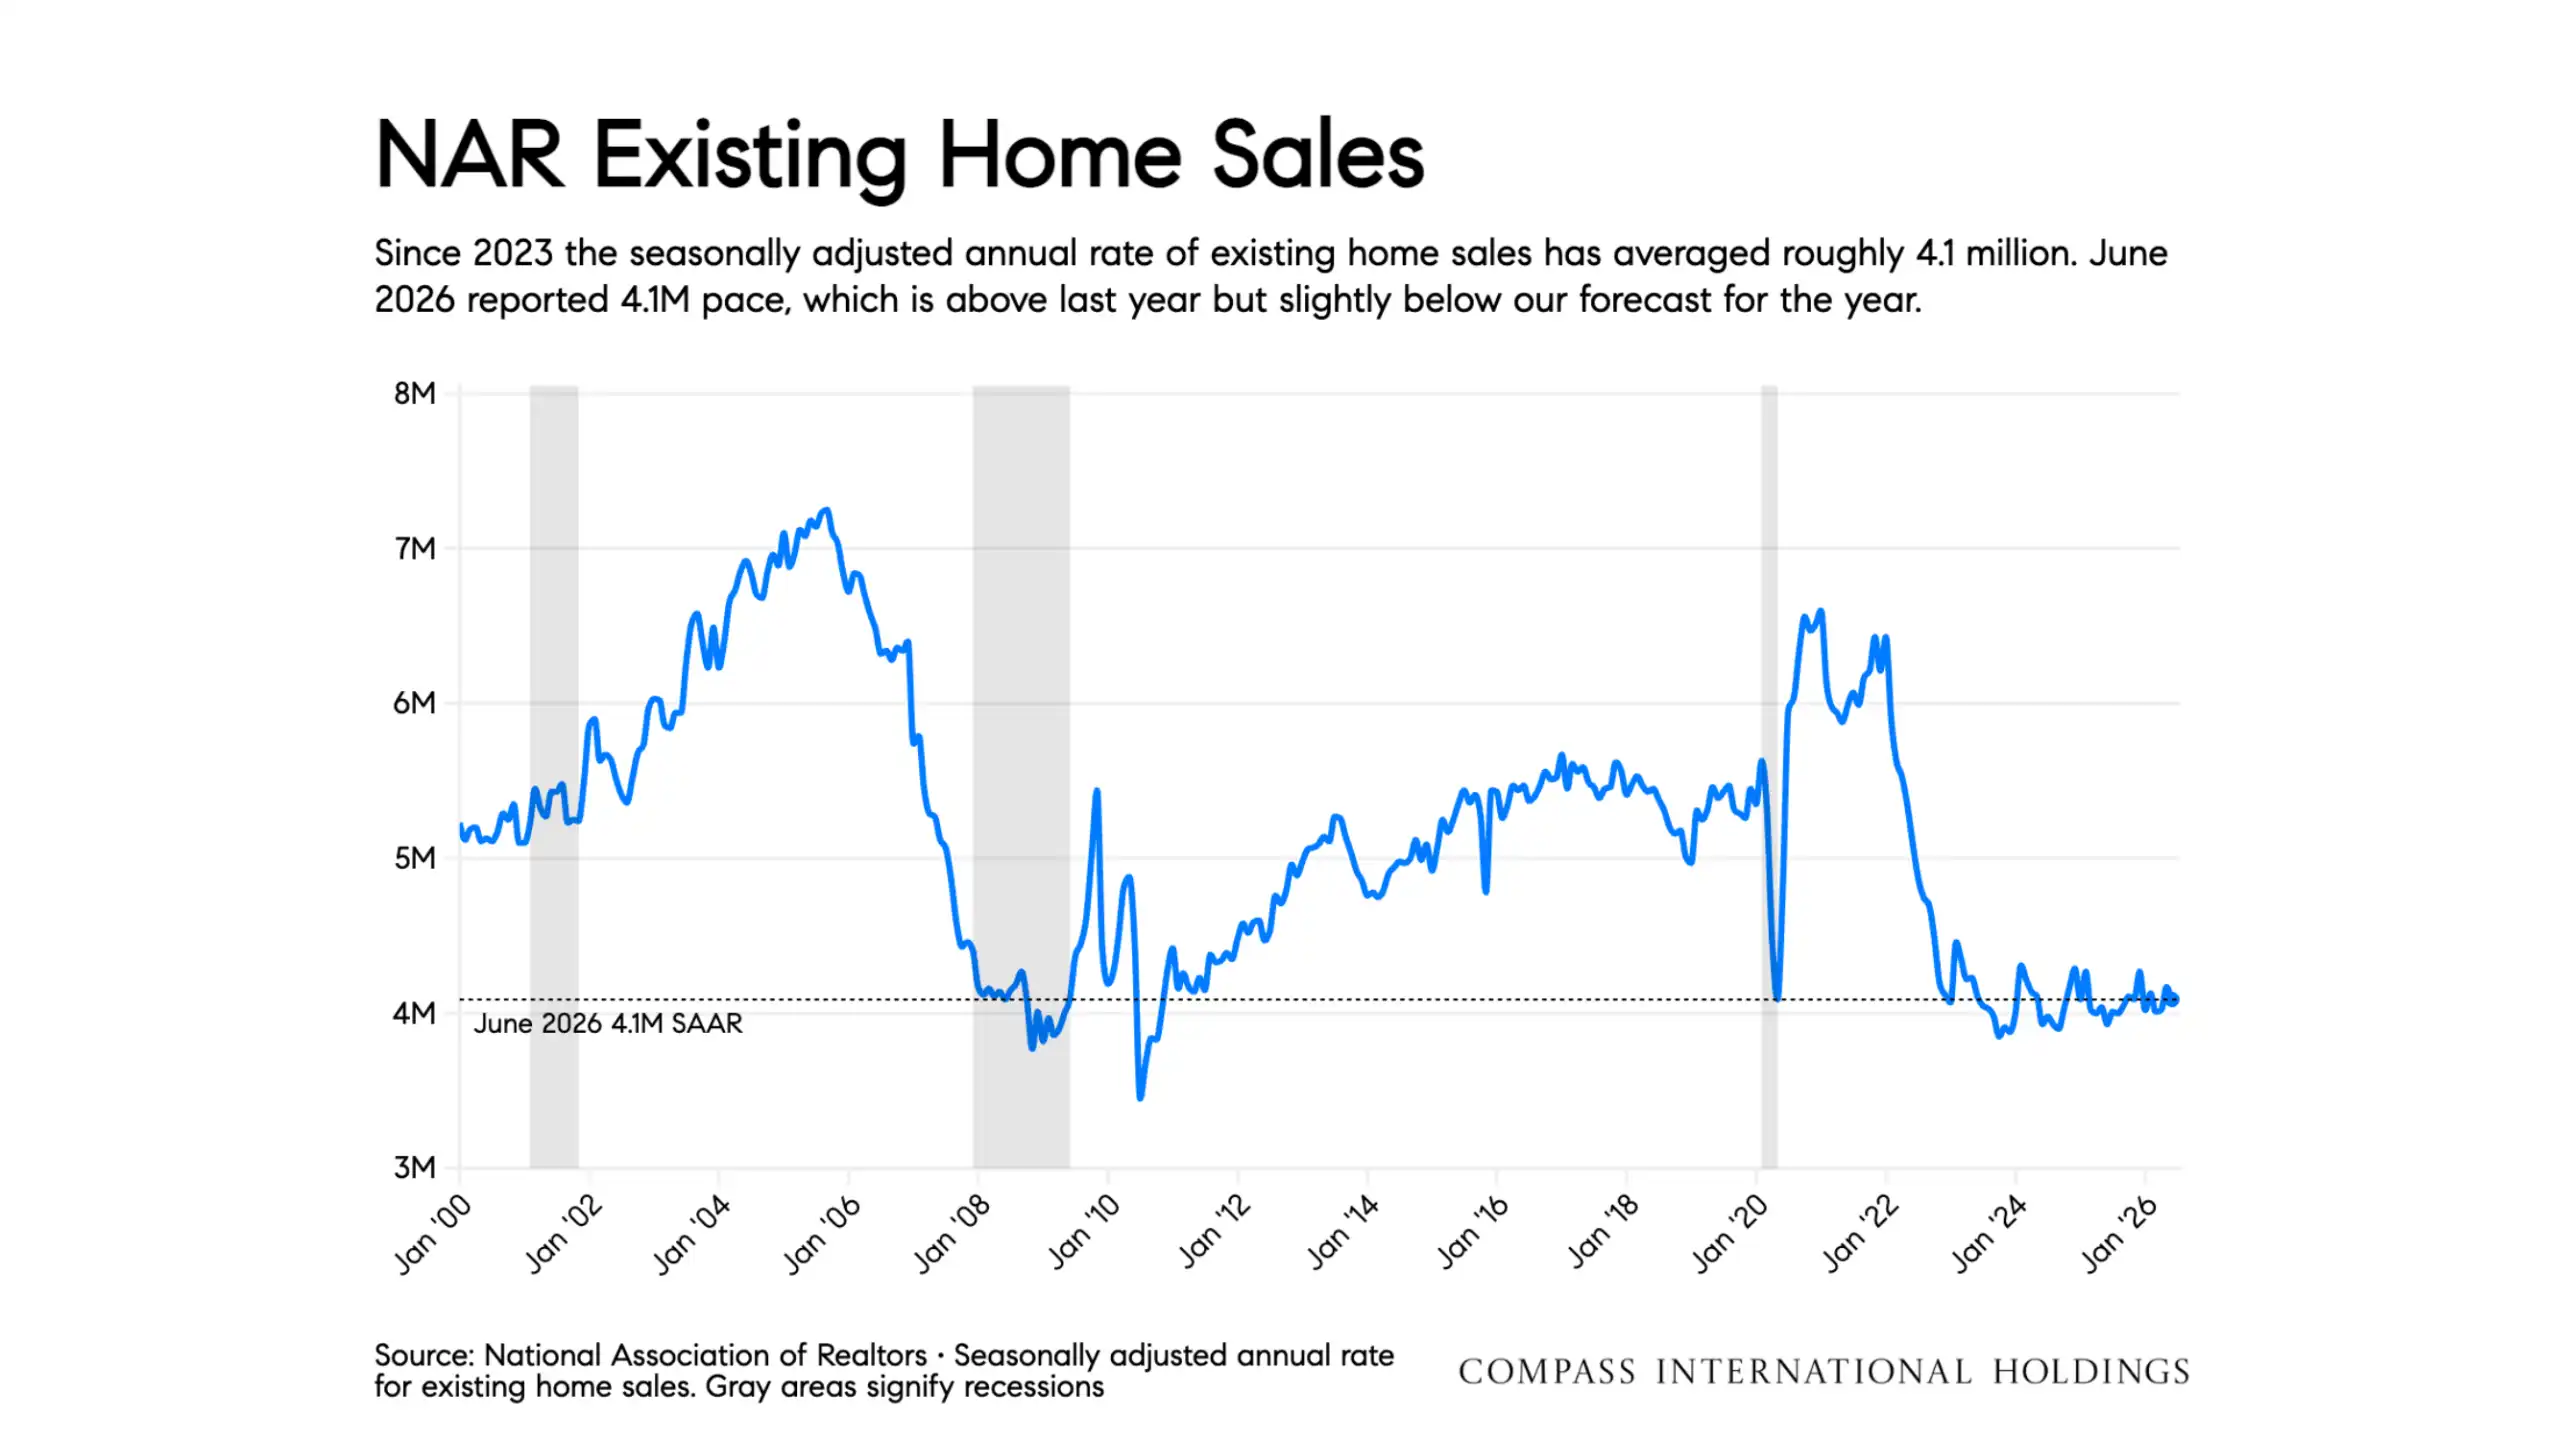
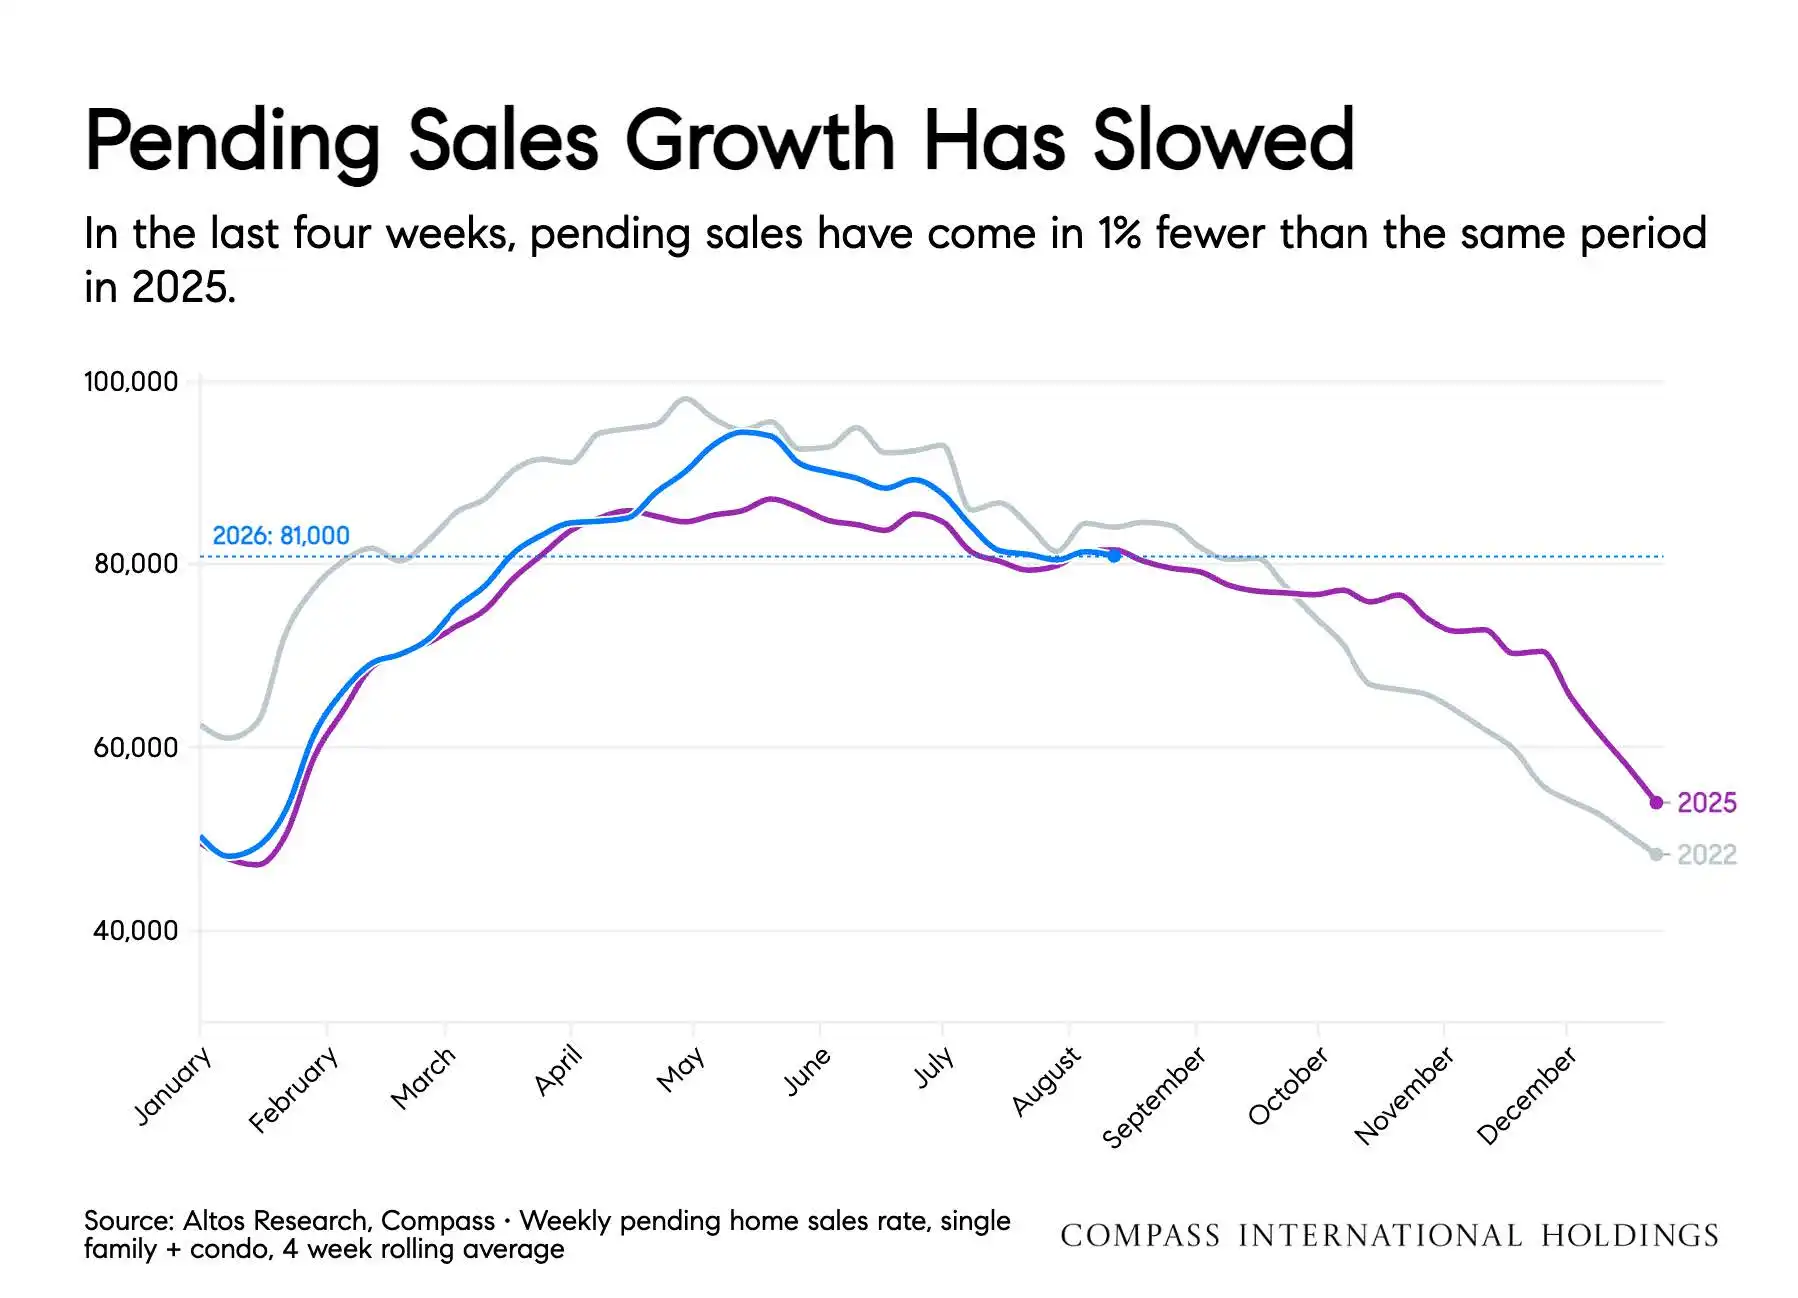
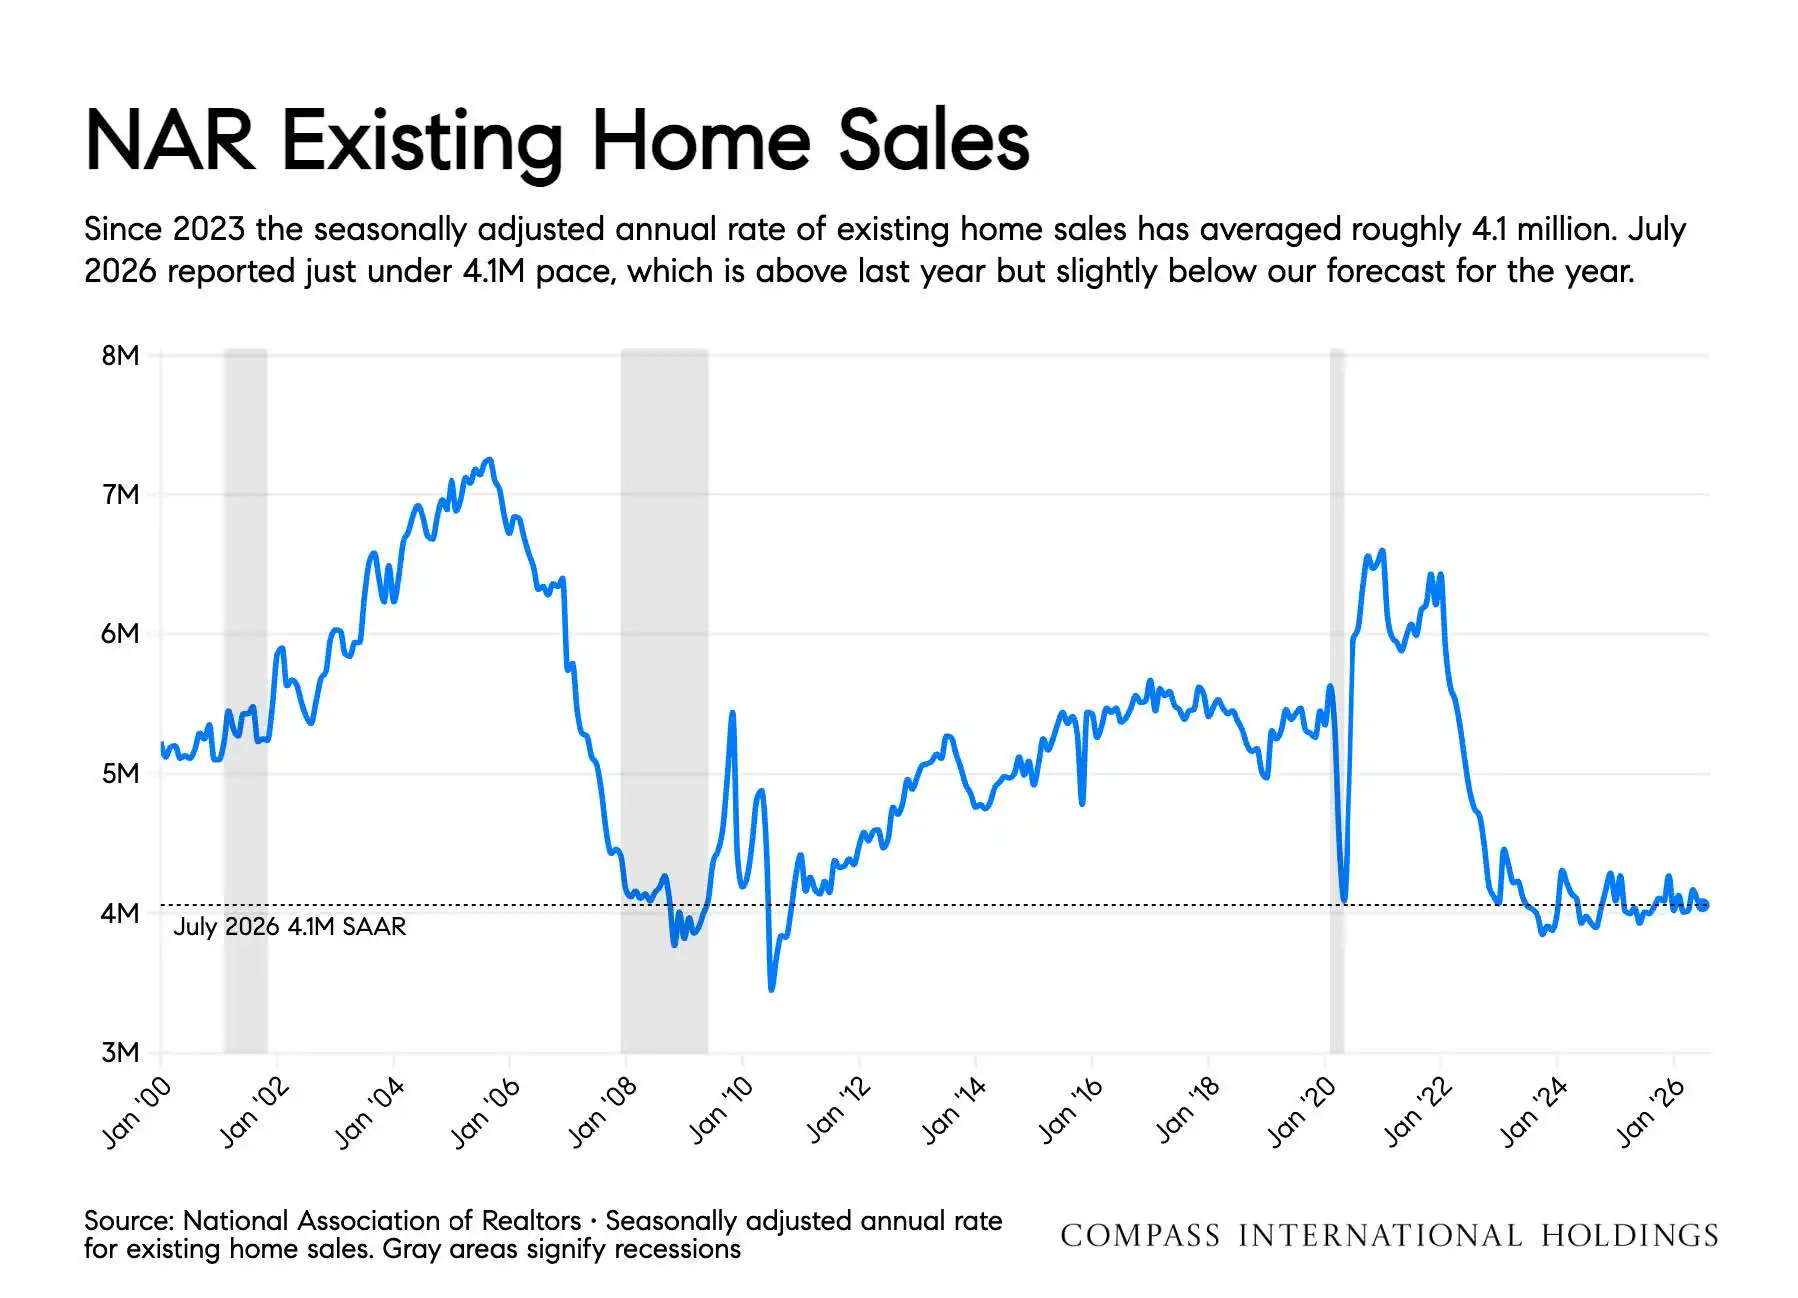
Pending home sales remained slightly ahead of last year in mid-July, but the advantage had narrowed to approximately 1.4%. The number of states reporting fewer pending sales than the prior year also increased, suggesting that higher borrowing costs and broader economic uncertainty were beginning to affect more markets. Existing-home sales were running at an annualized pace of approximately 4.1 million in June, slightly above the prior year but still below the report's forecast for 2026.
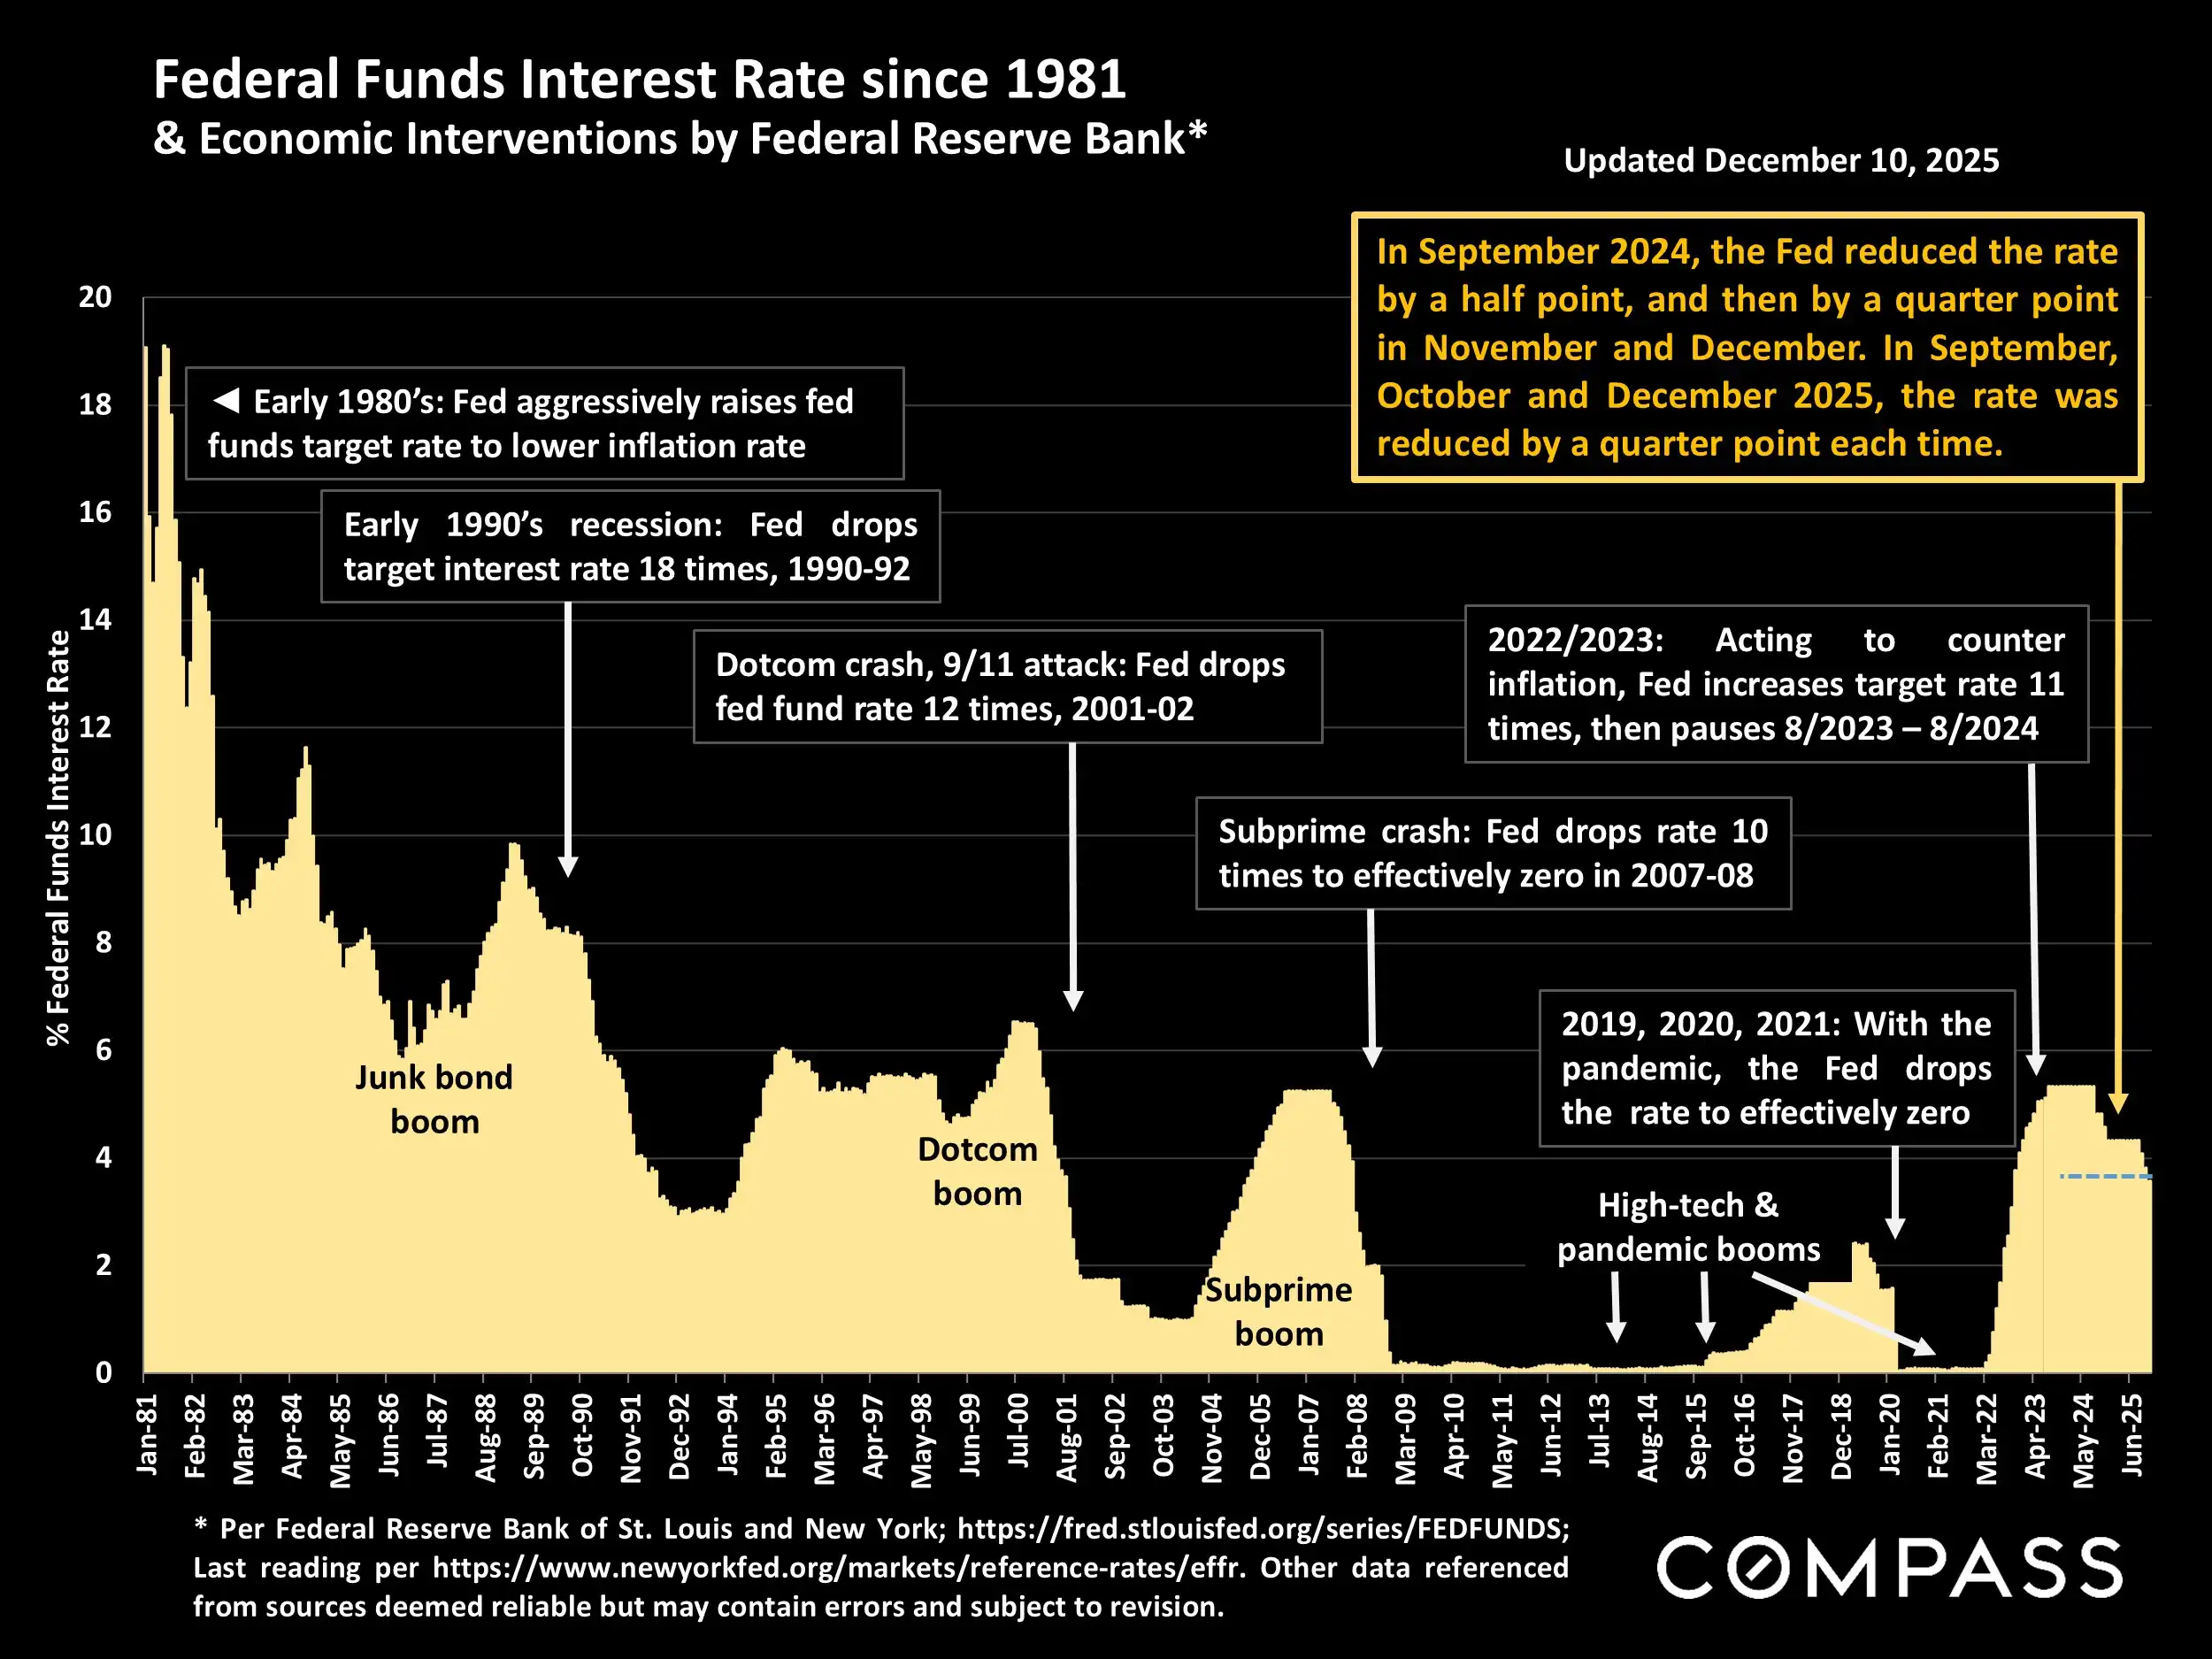
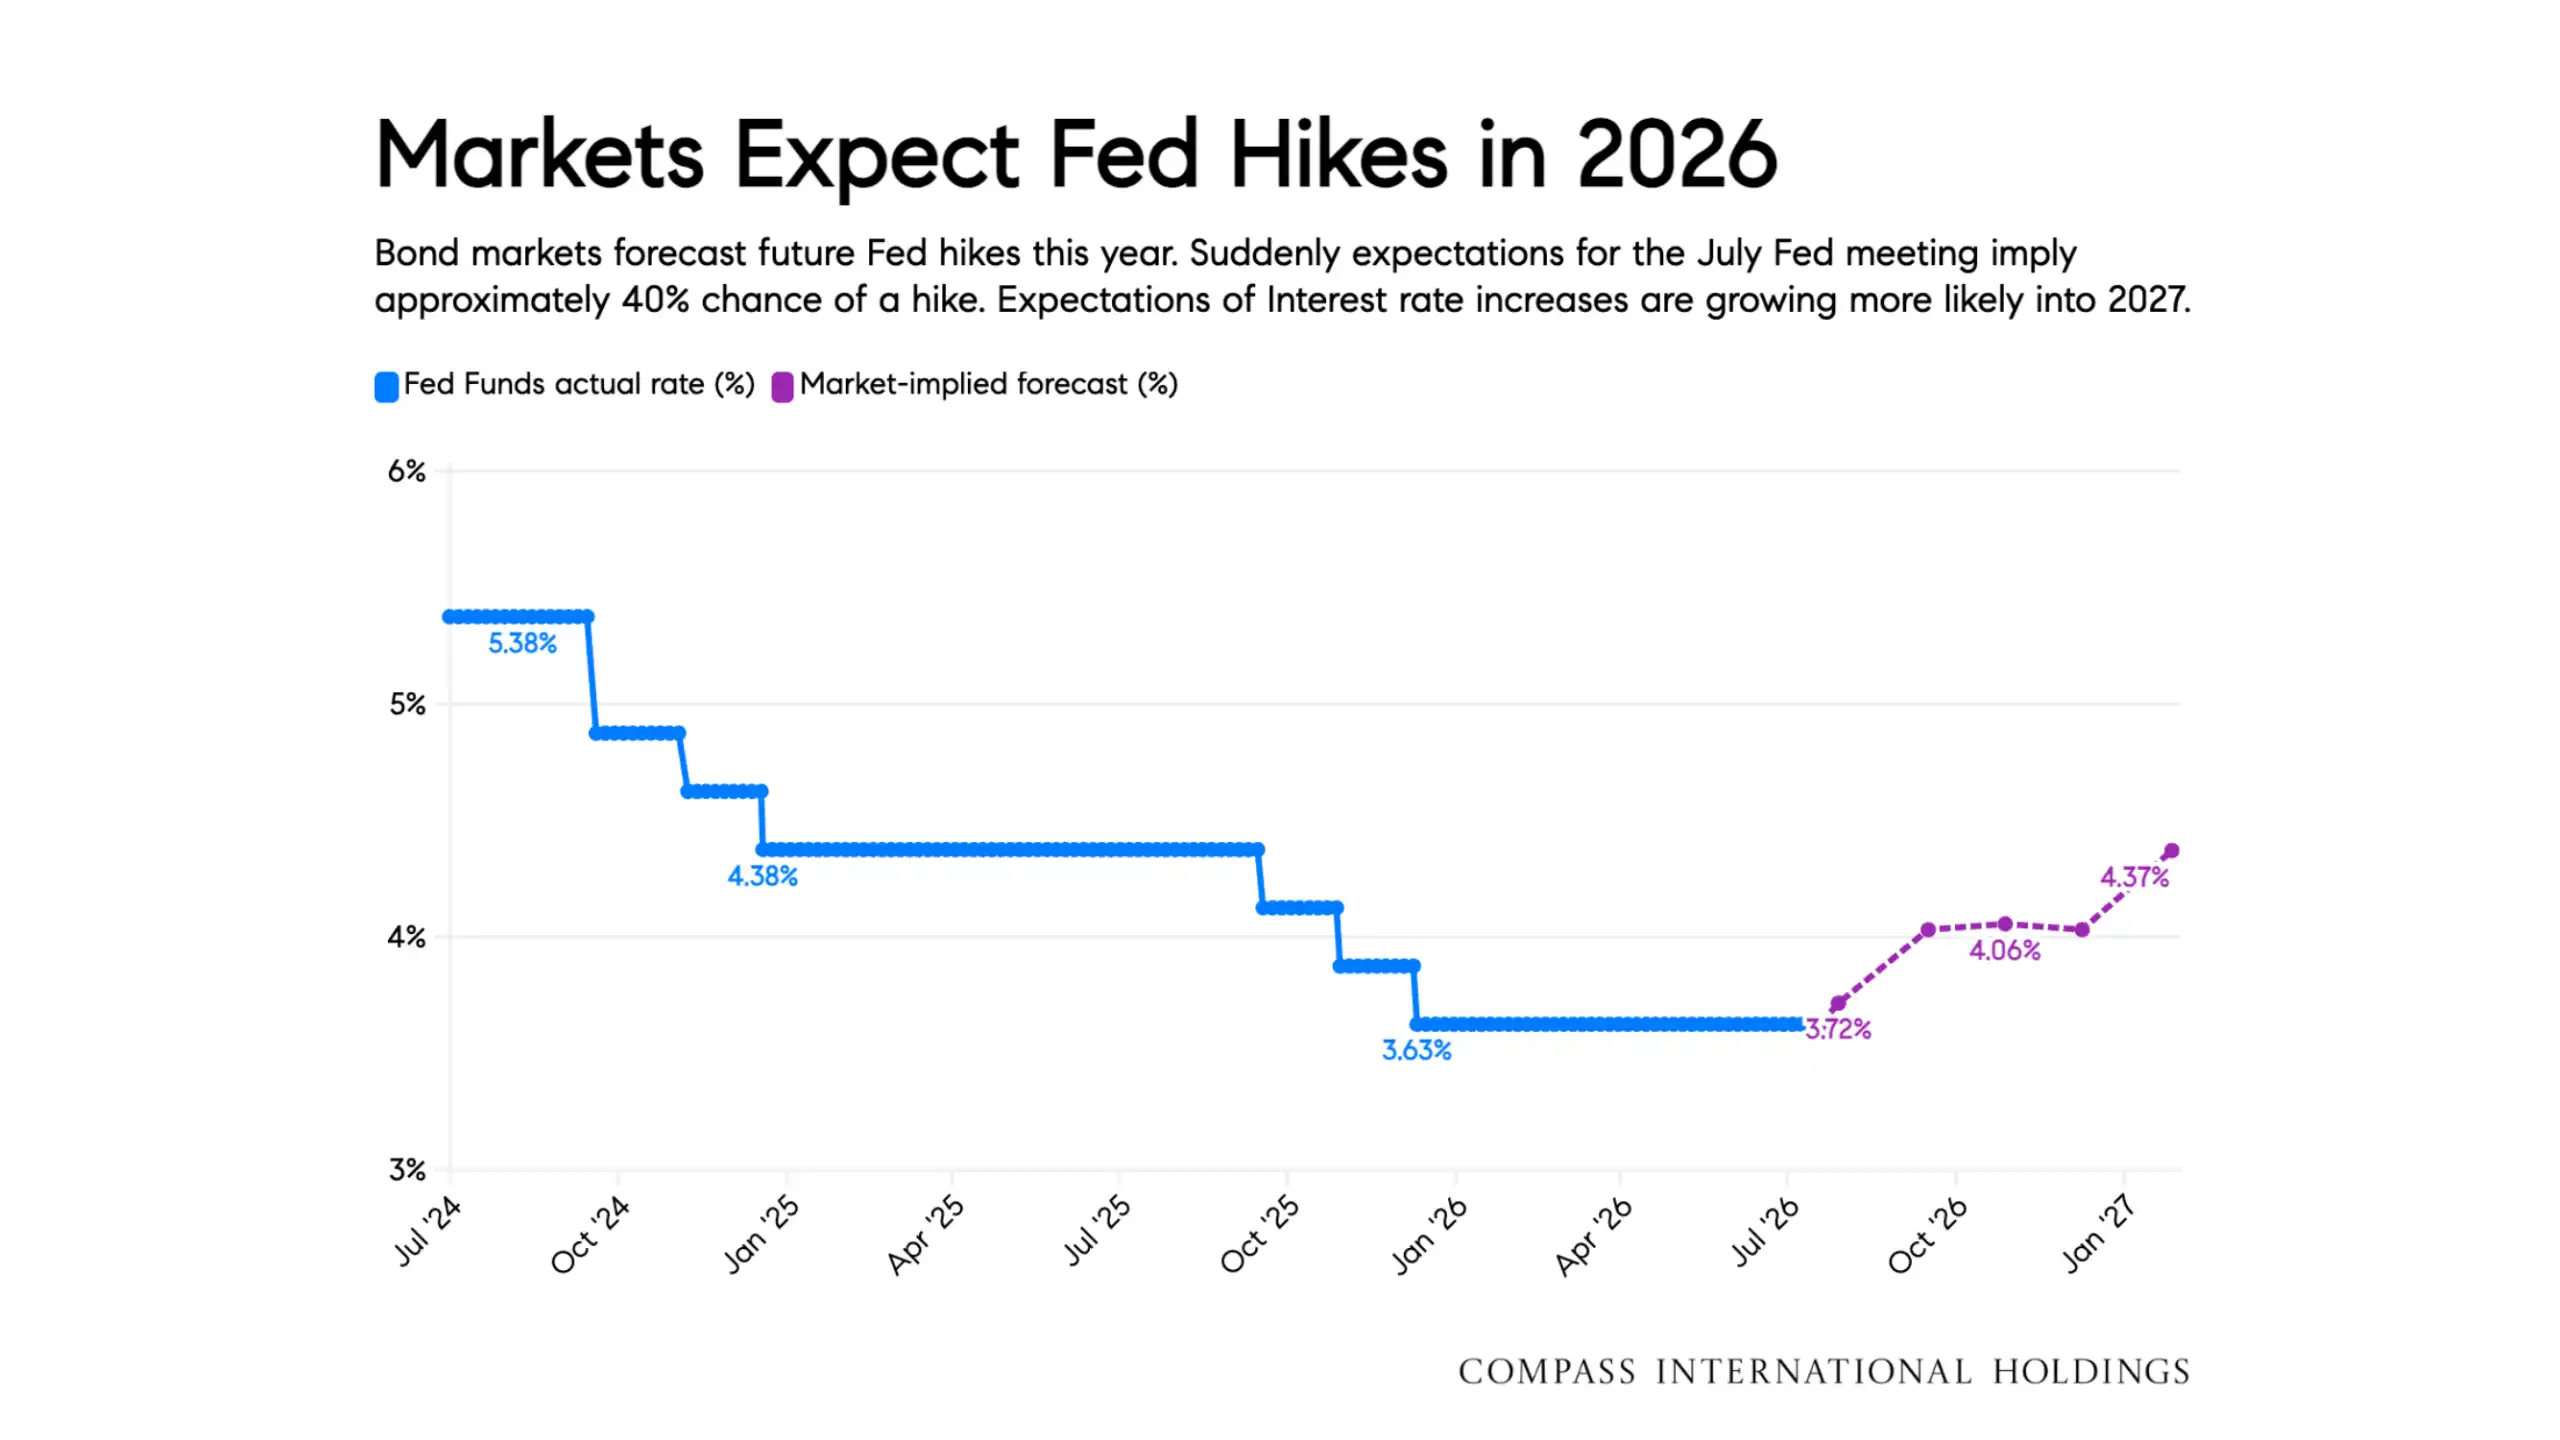
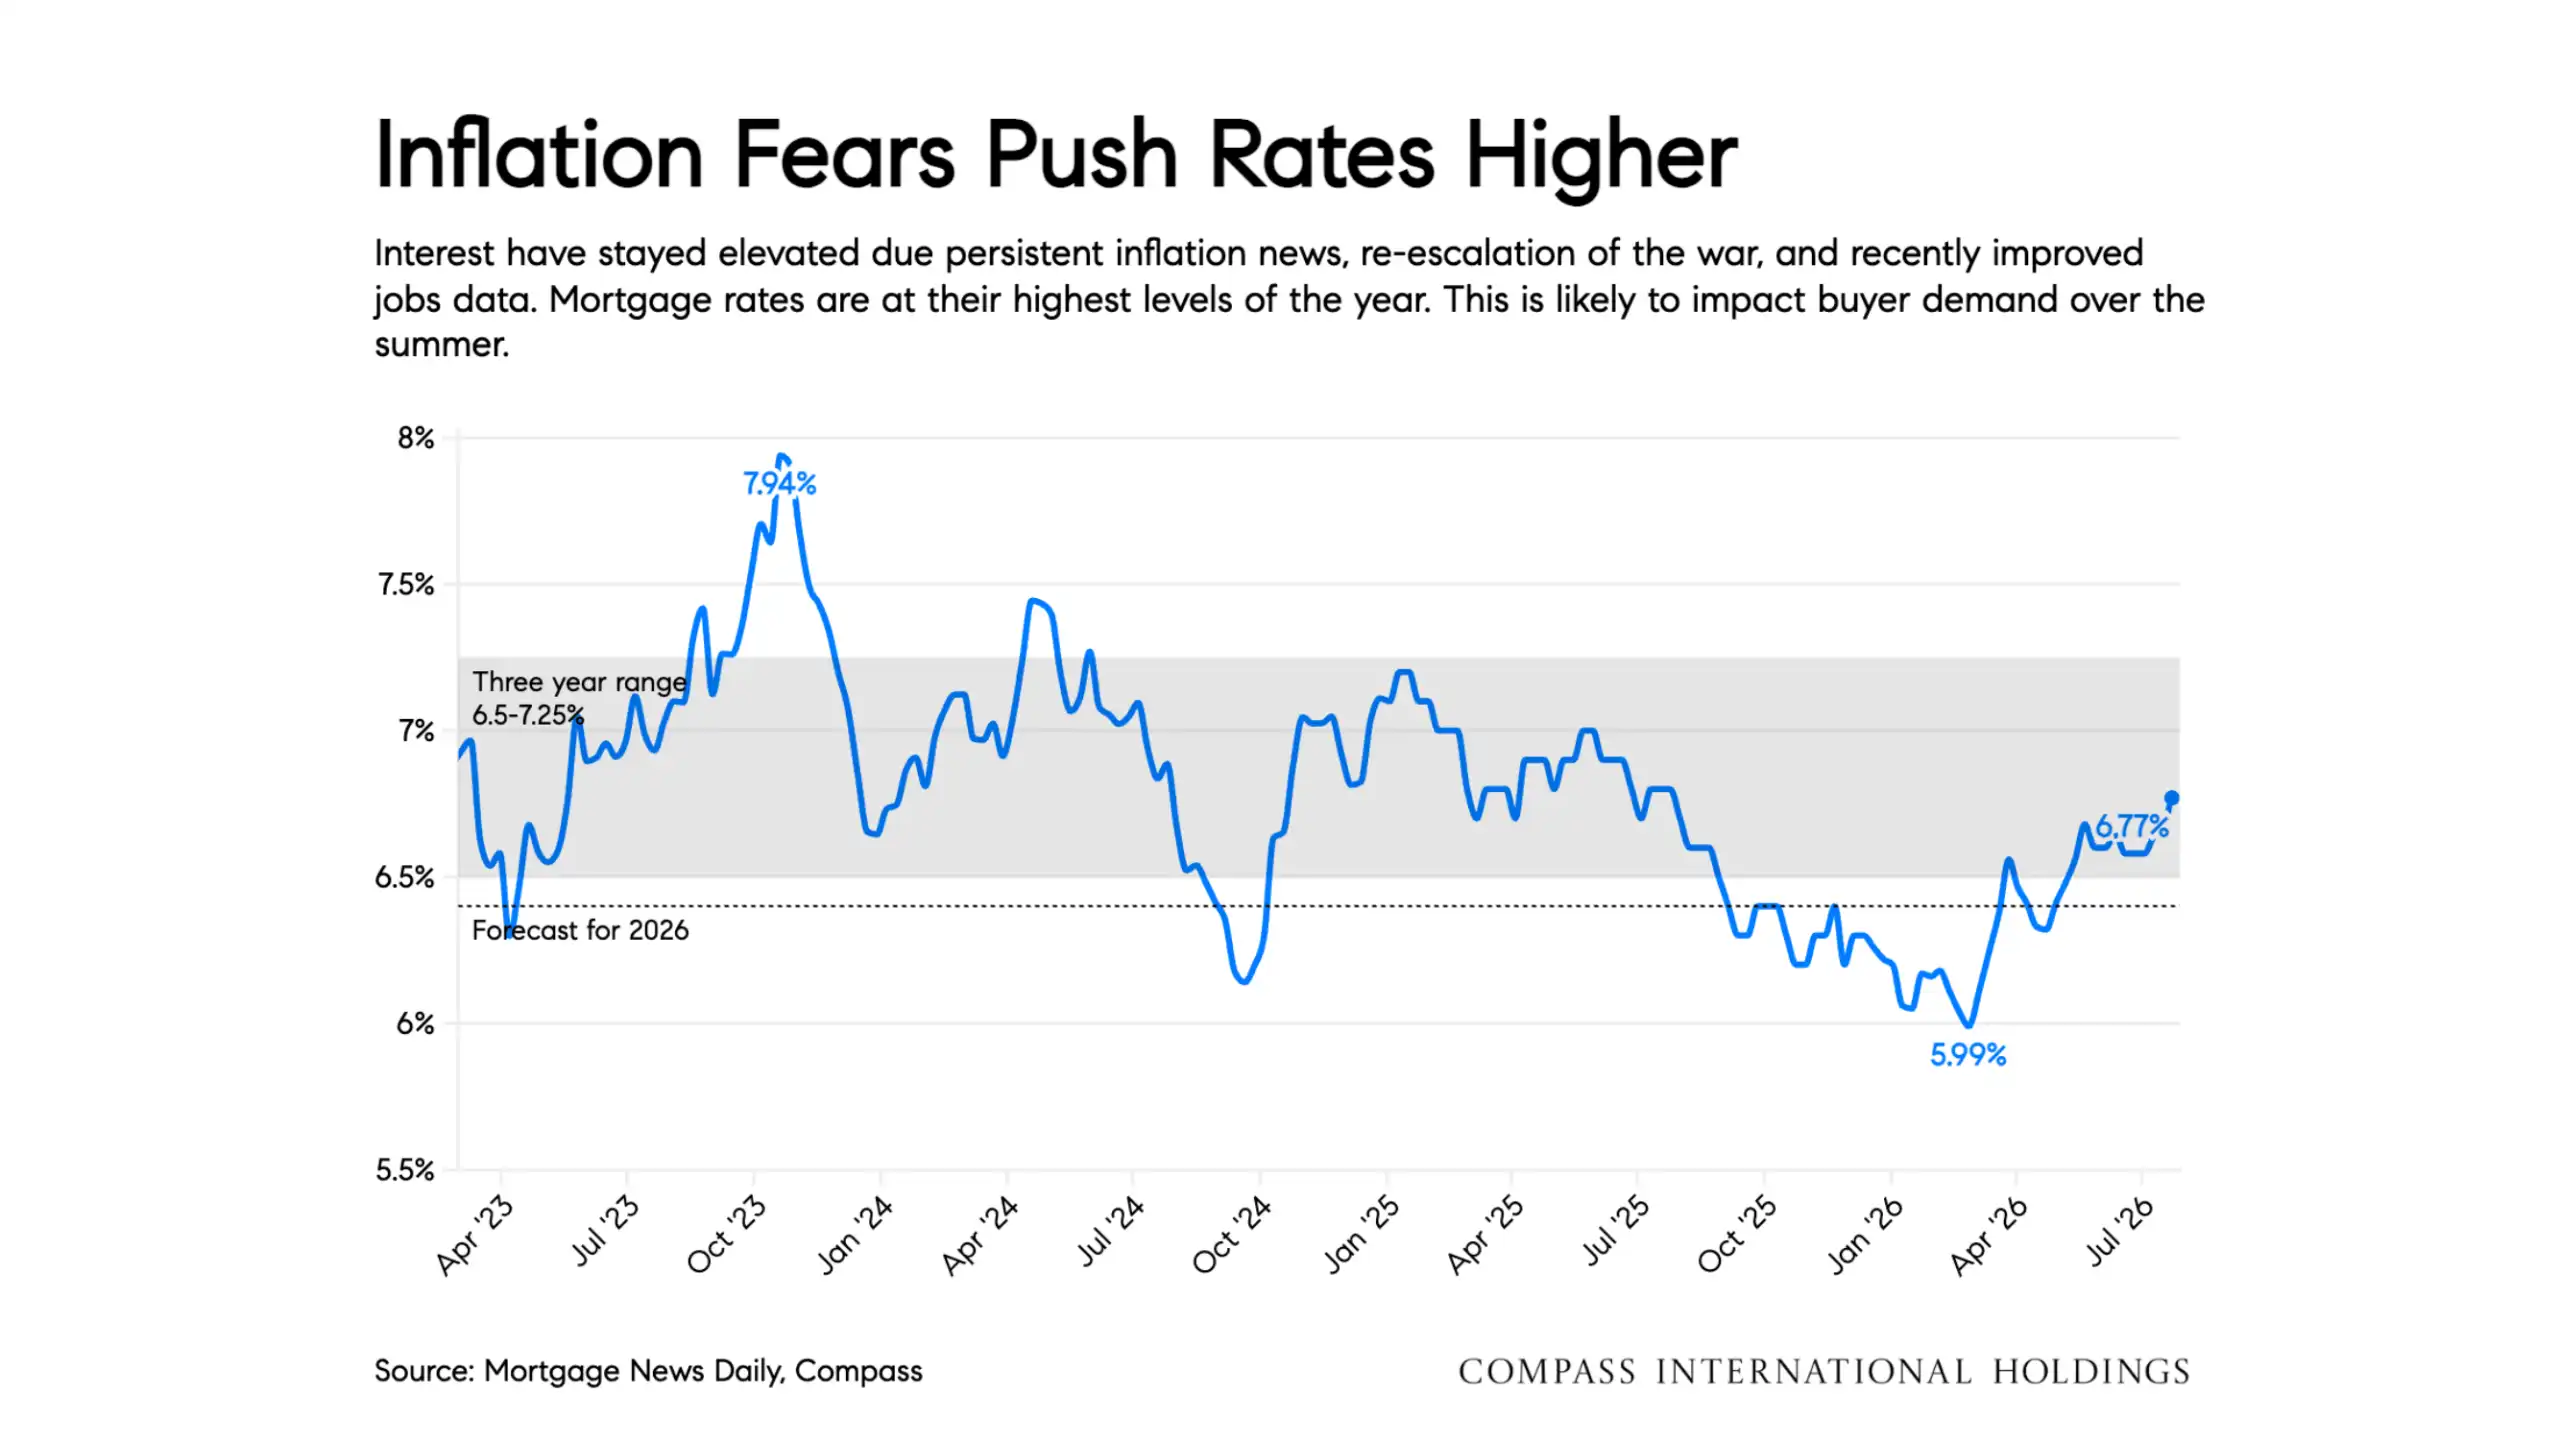
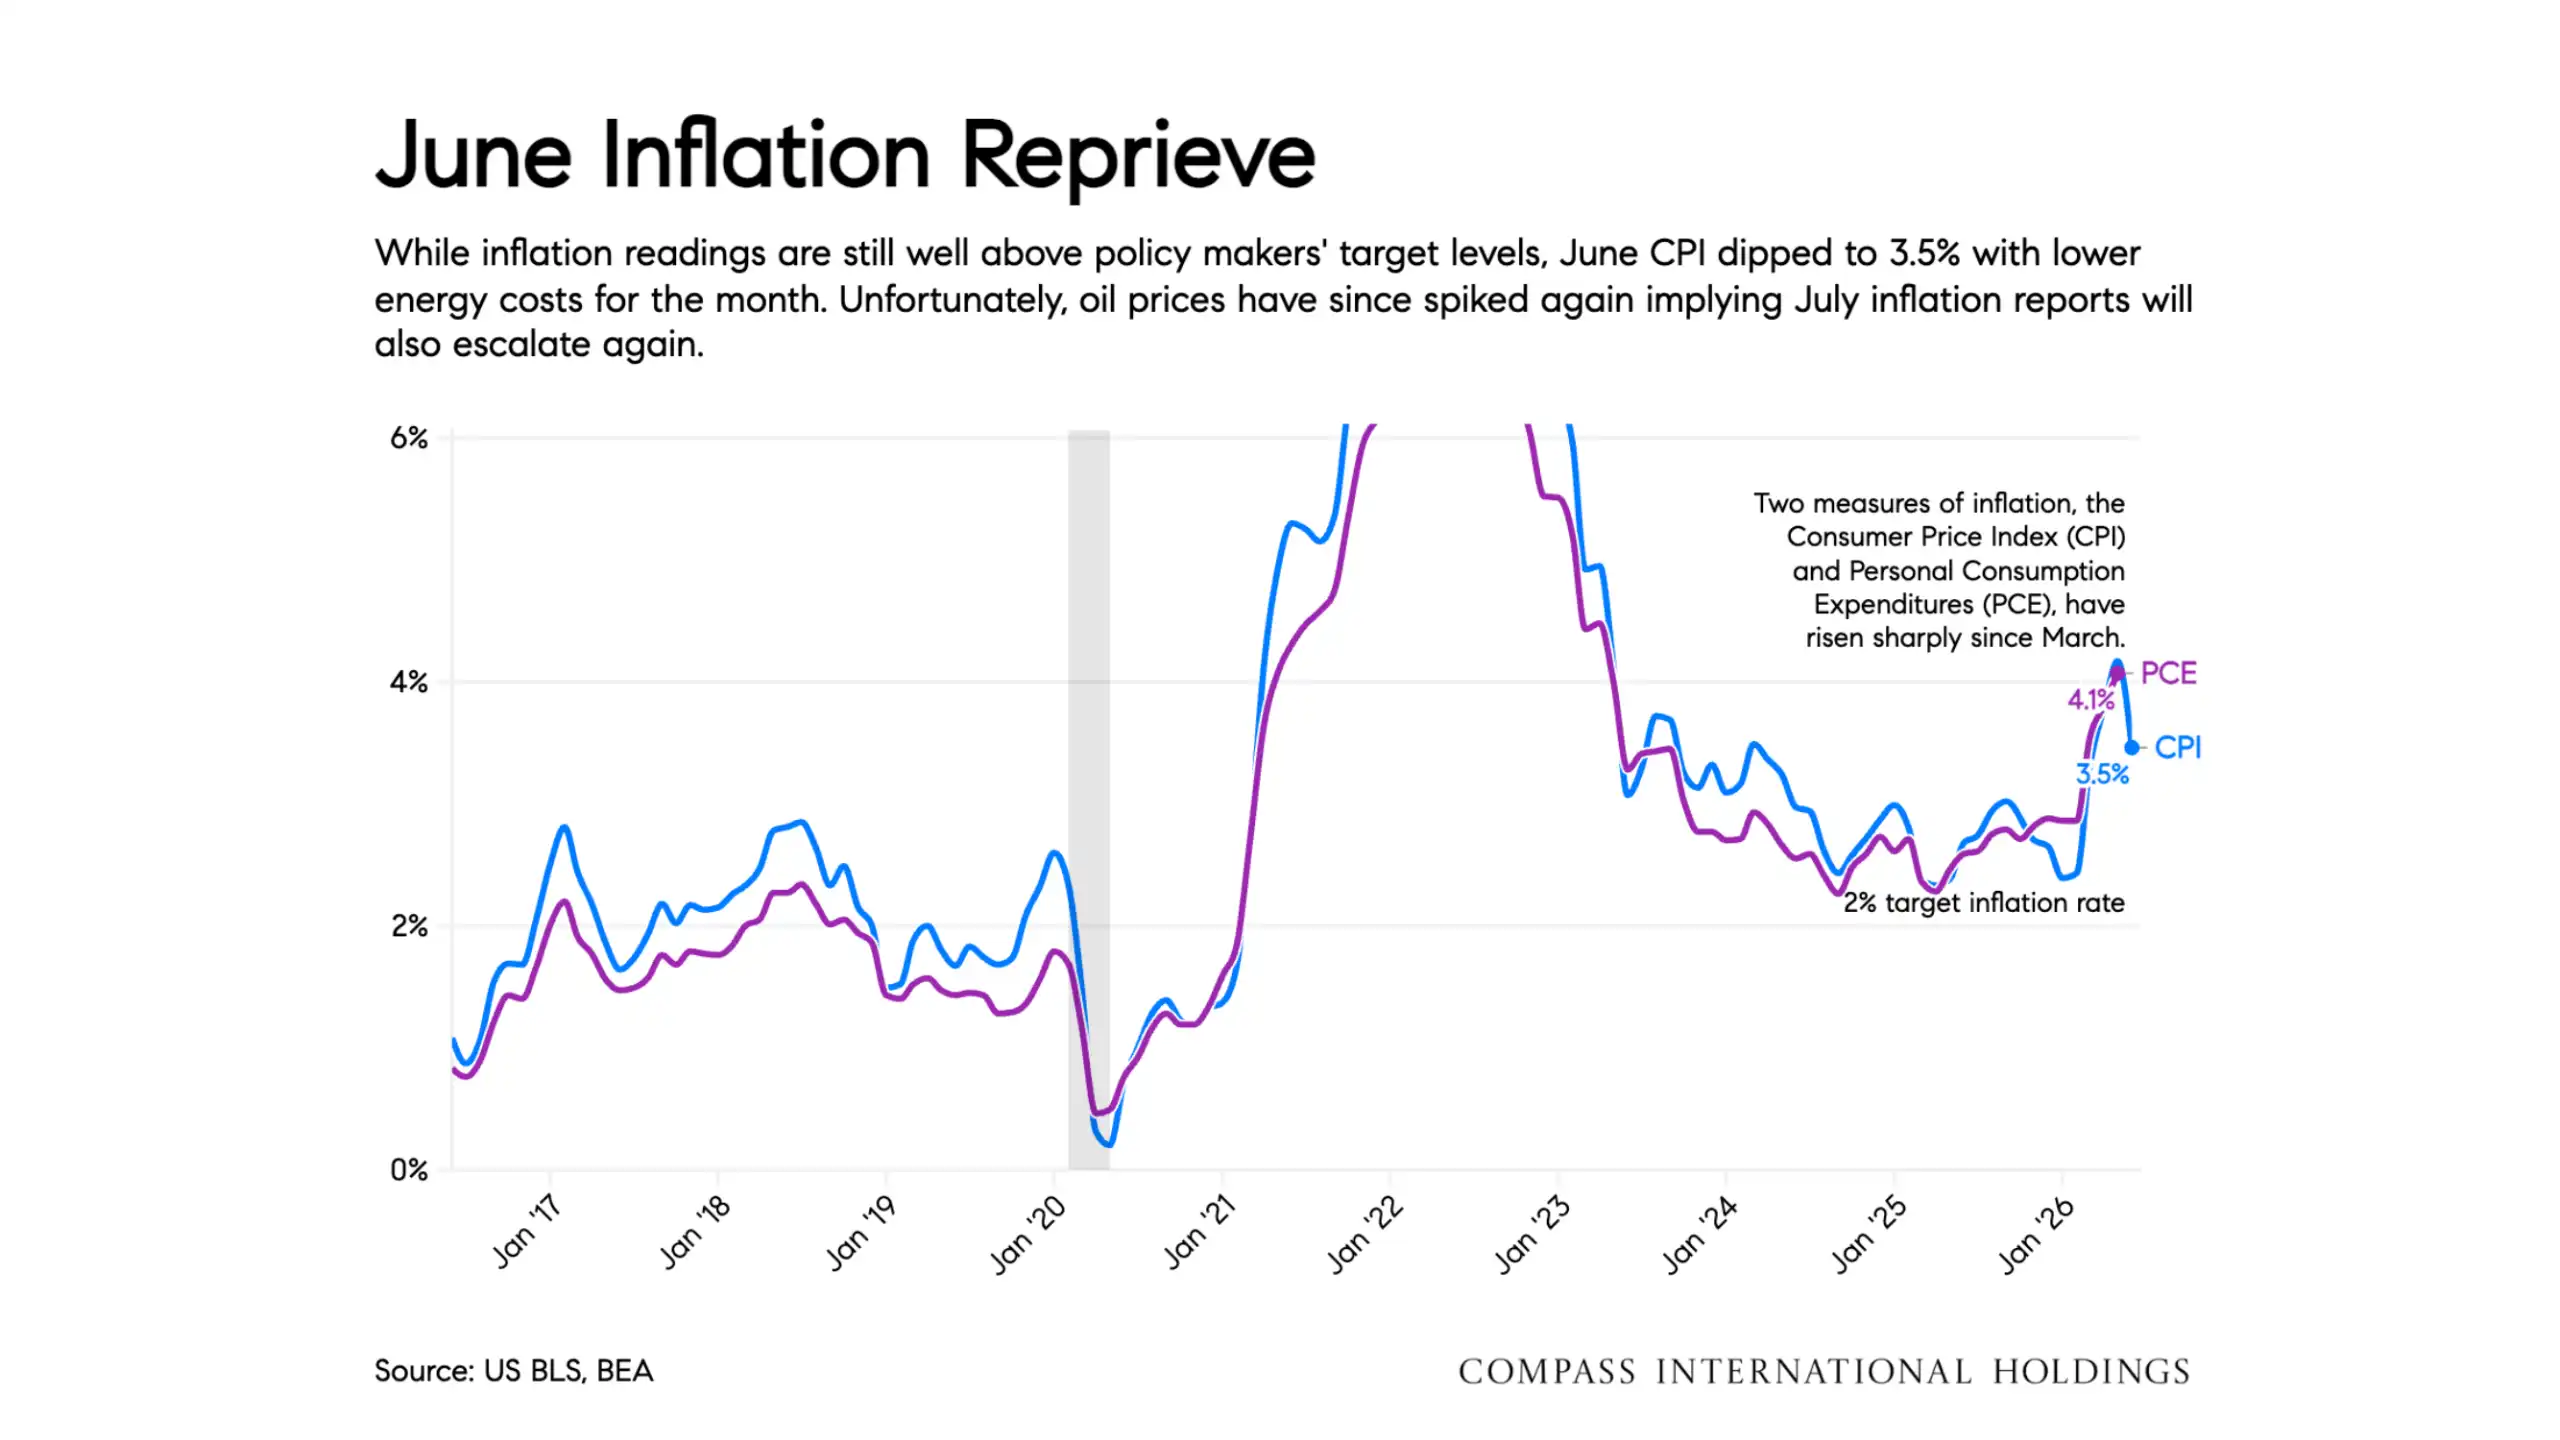
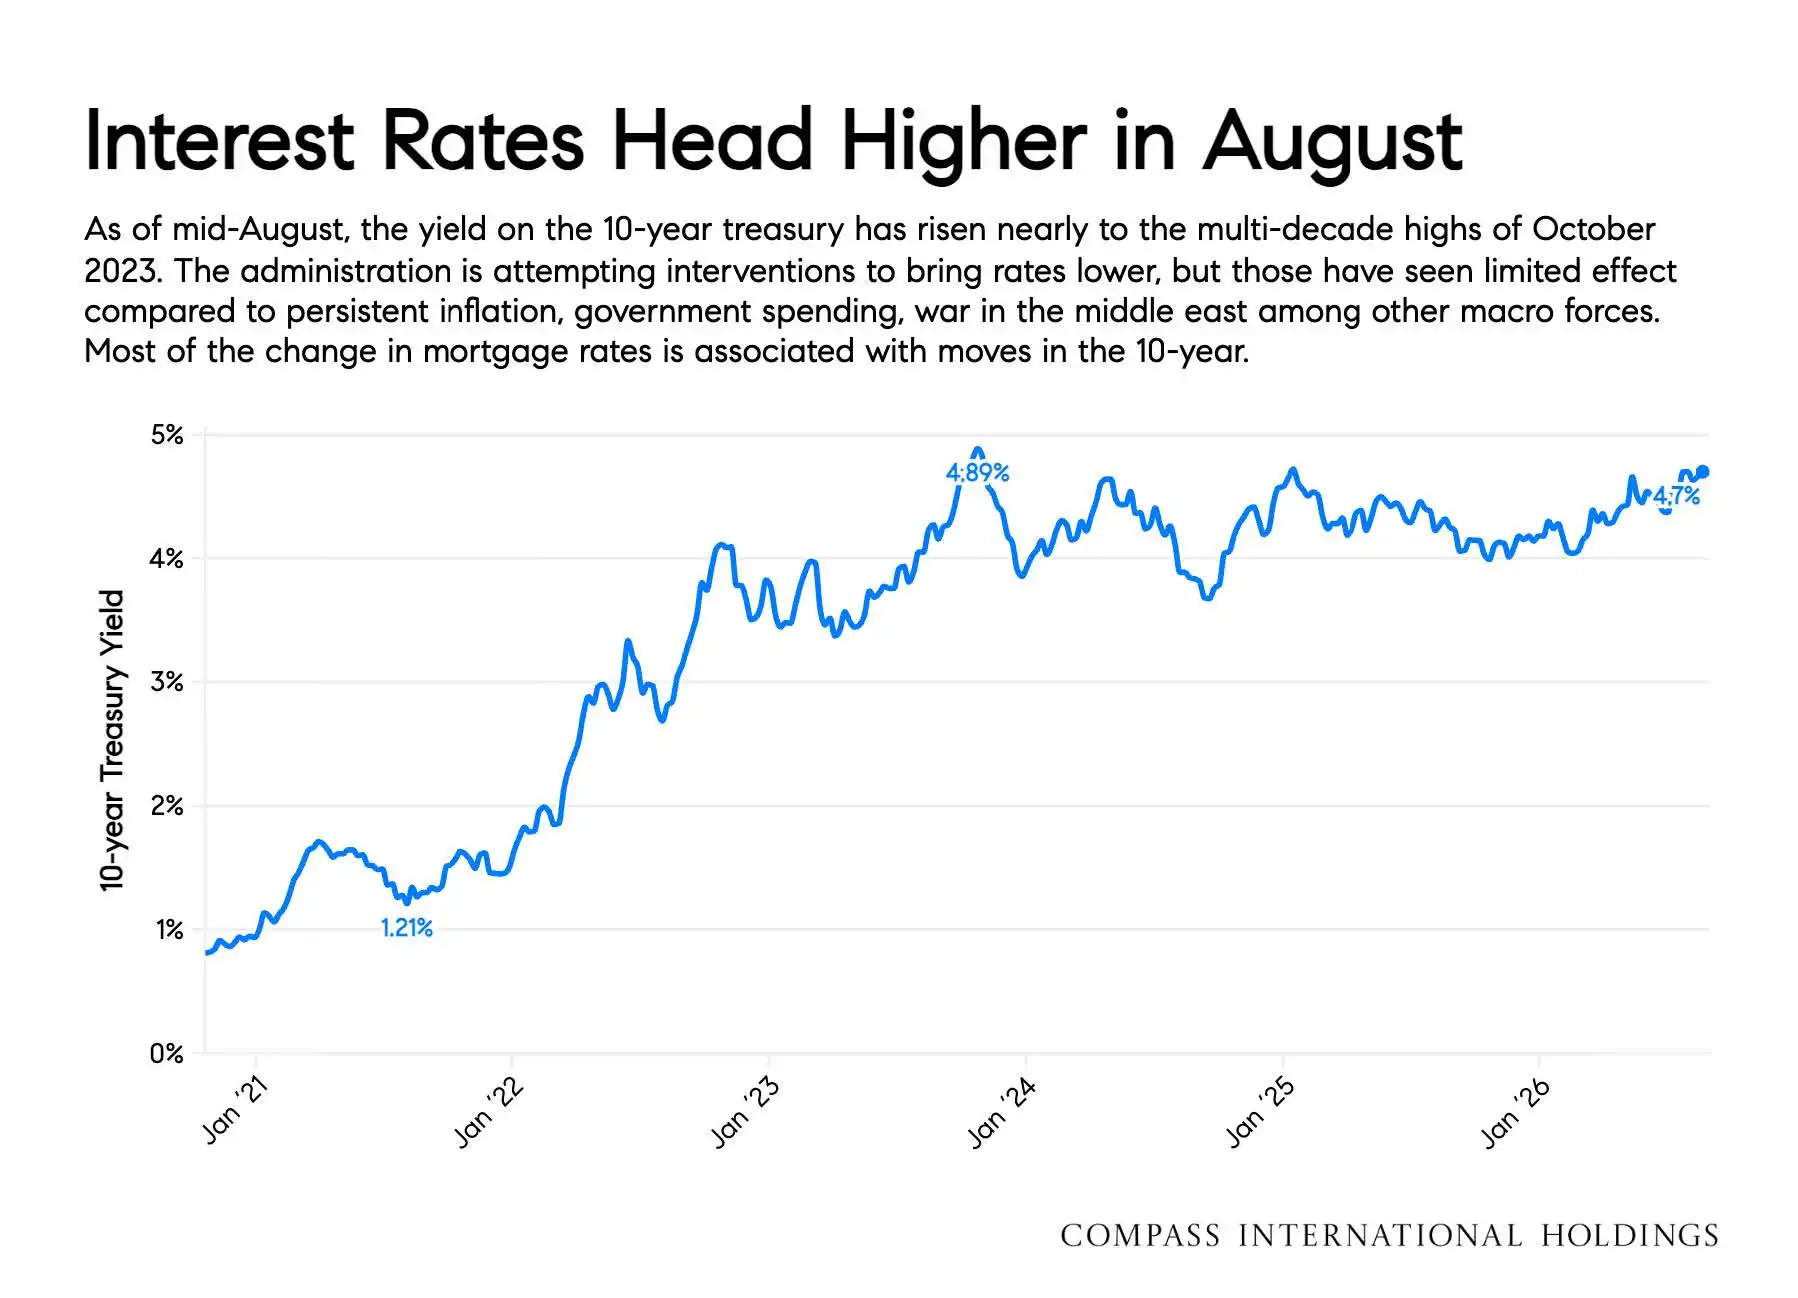
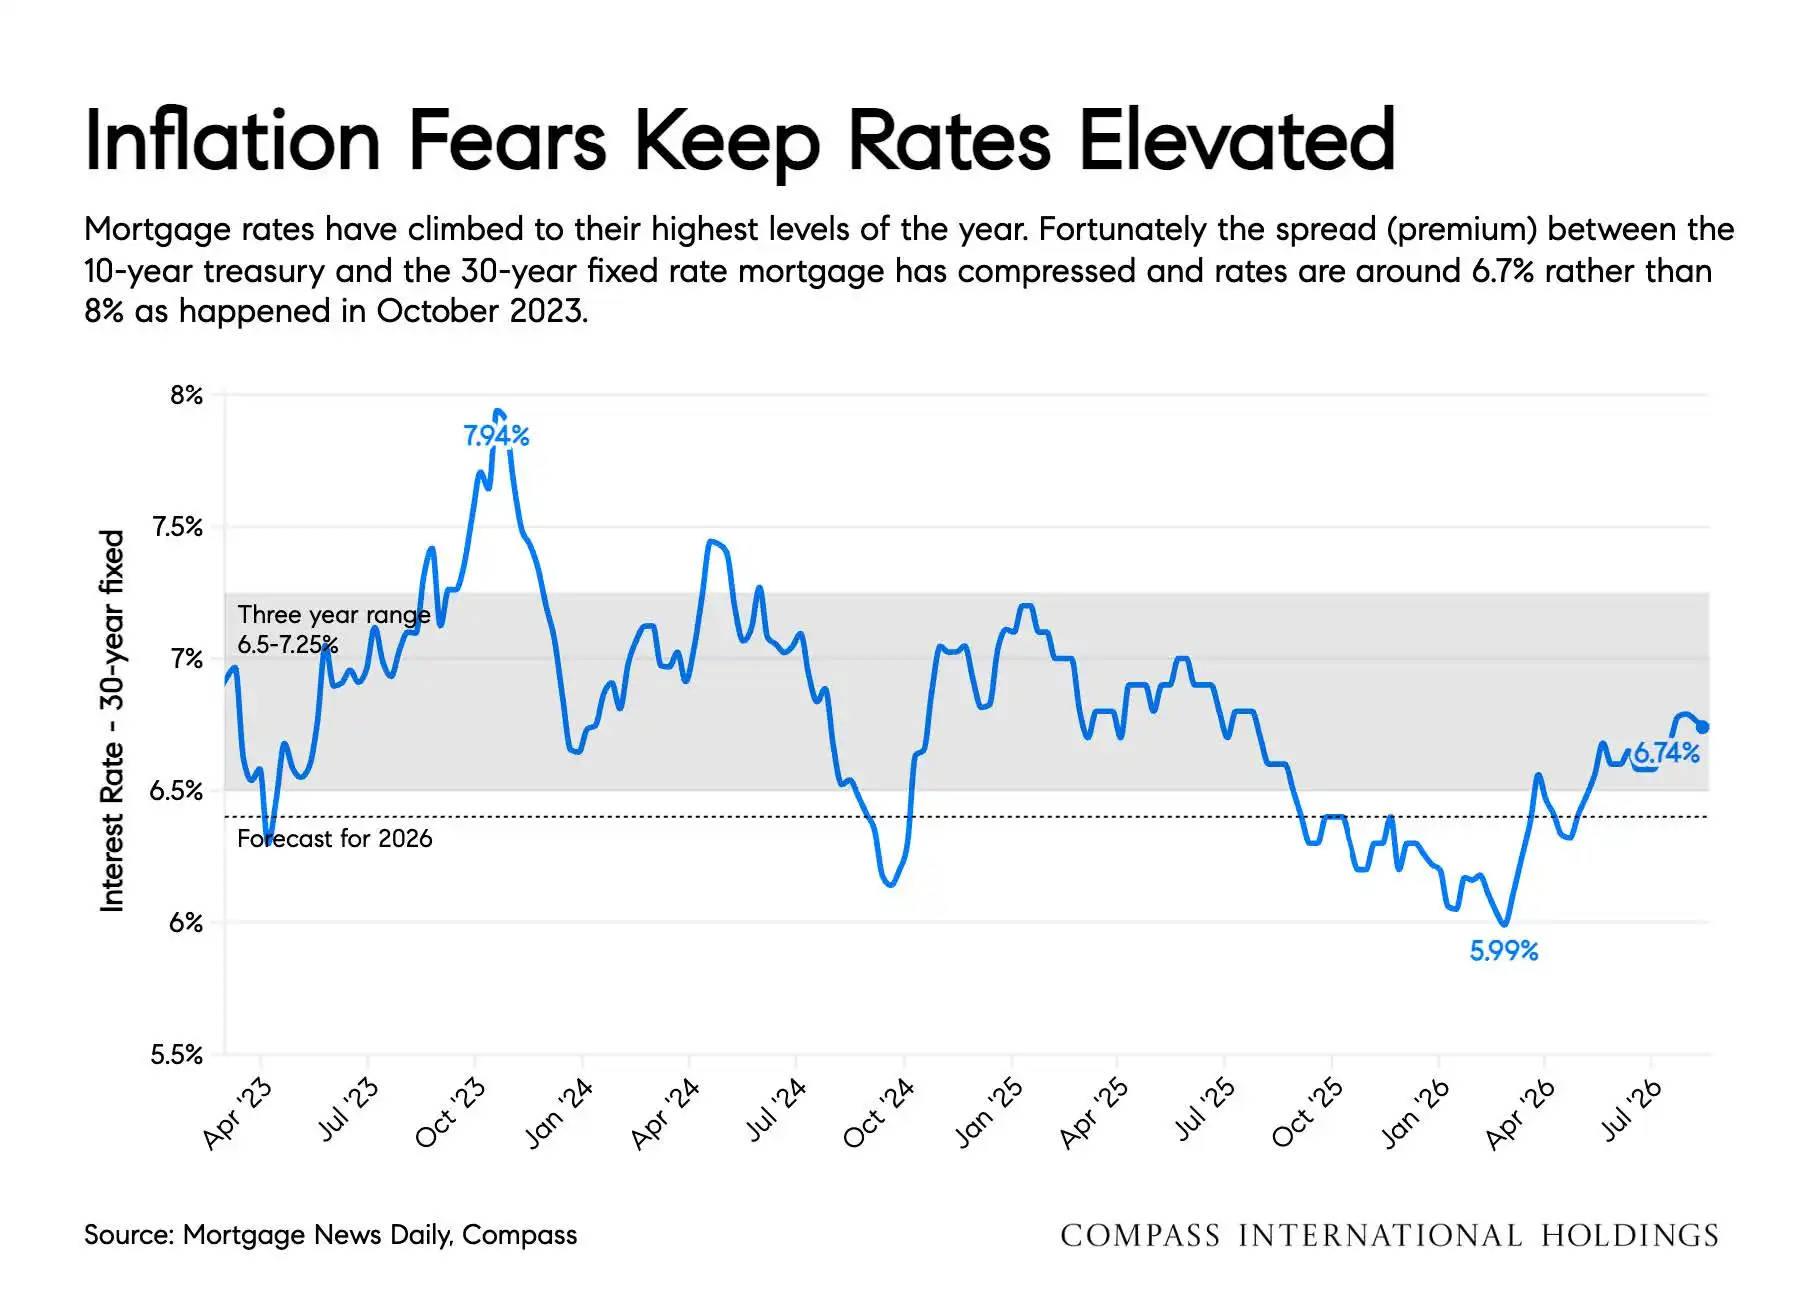
Interest rates remain one of the most important influences on the market. Inflation concerns, changing expectations for Federal Reserve policy, geopolitical uncertainty, and stronger employment data helped push mortgage rates to their highest levels of the year. Although June inflation readings provided some temporary relief, inflation remained above policymakers' target, and the report cautioned that renewed energy-price pressure could keep rates elevated.
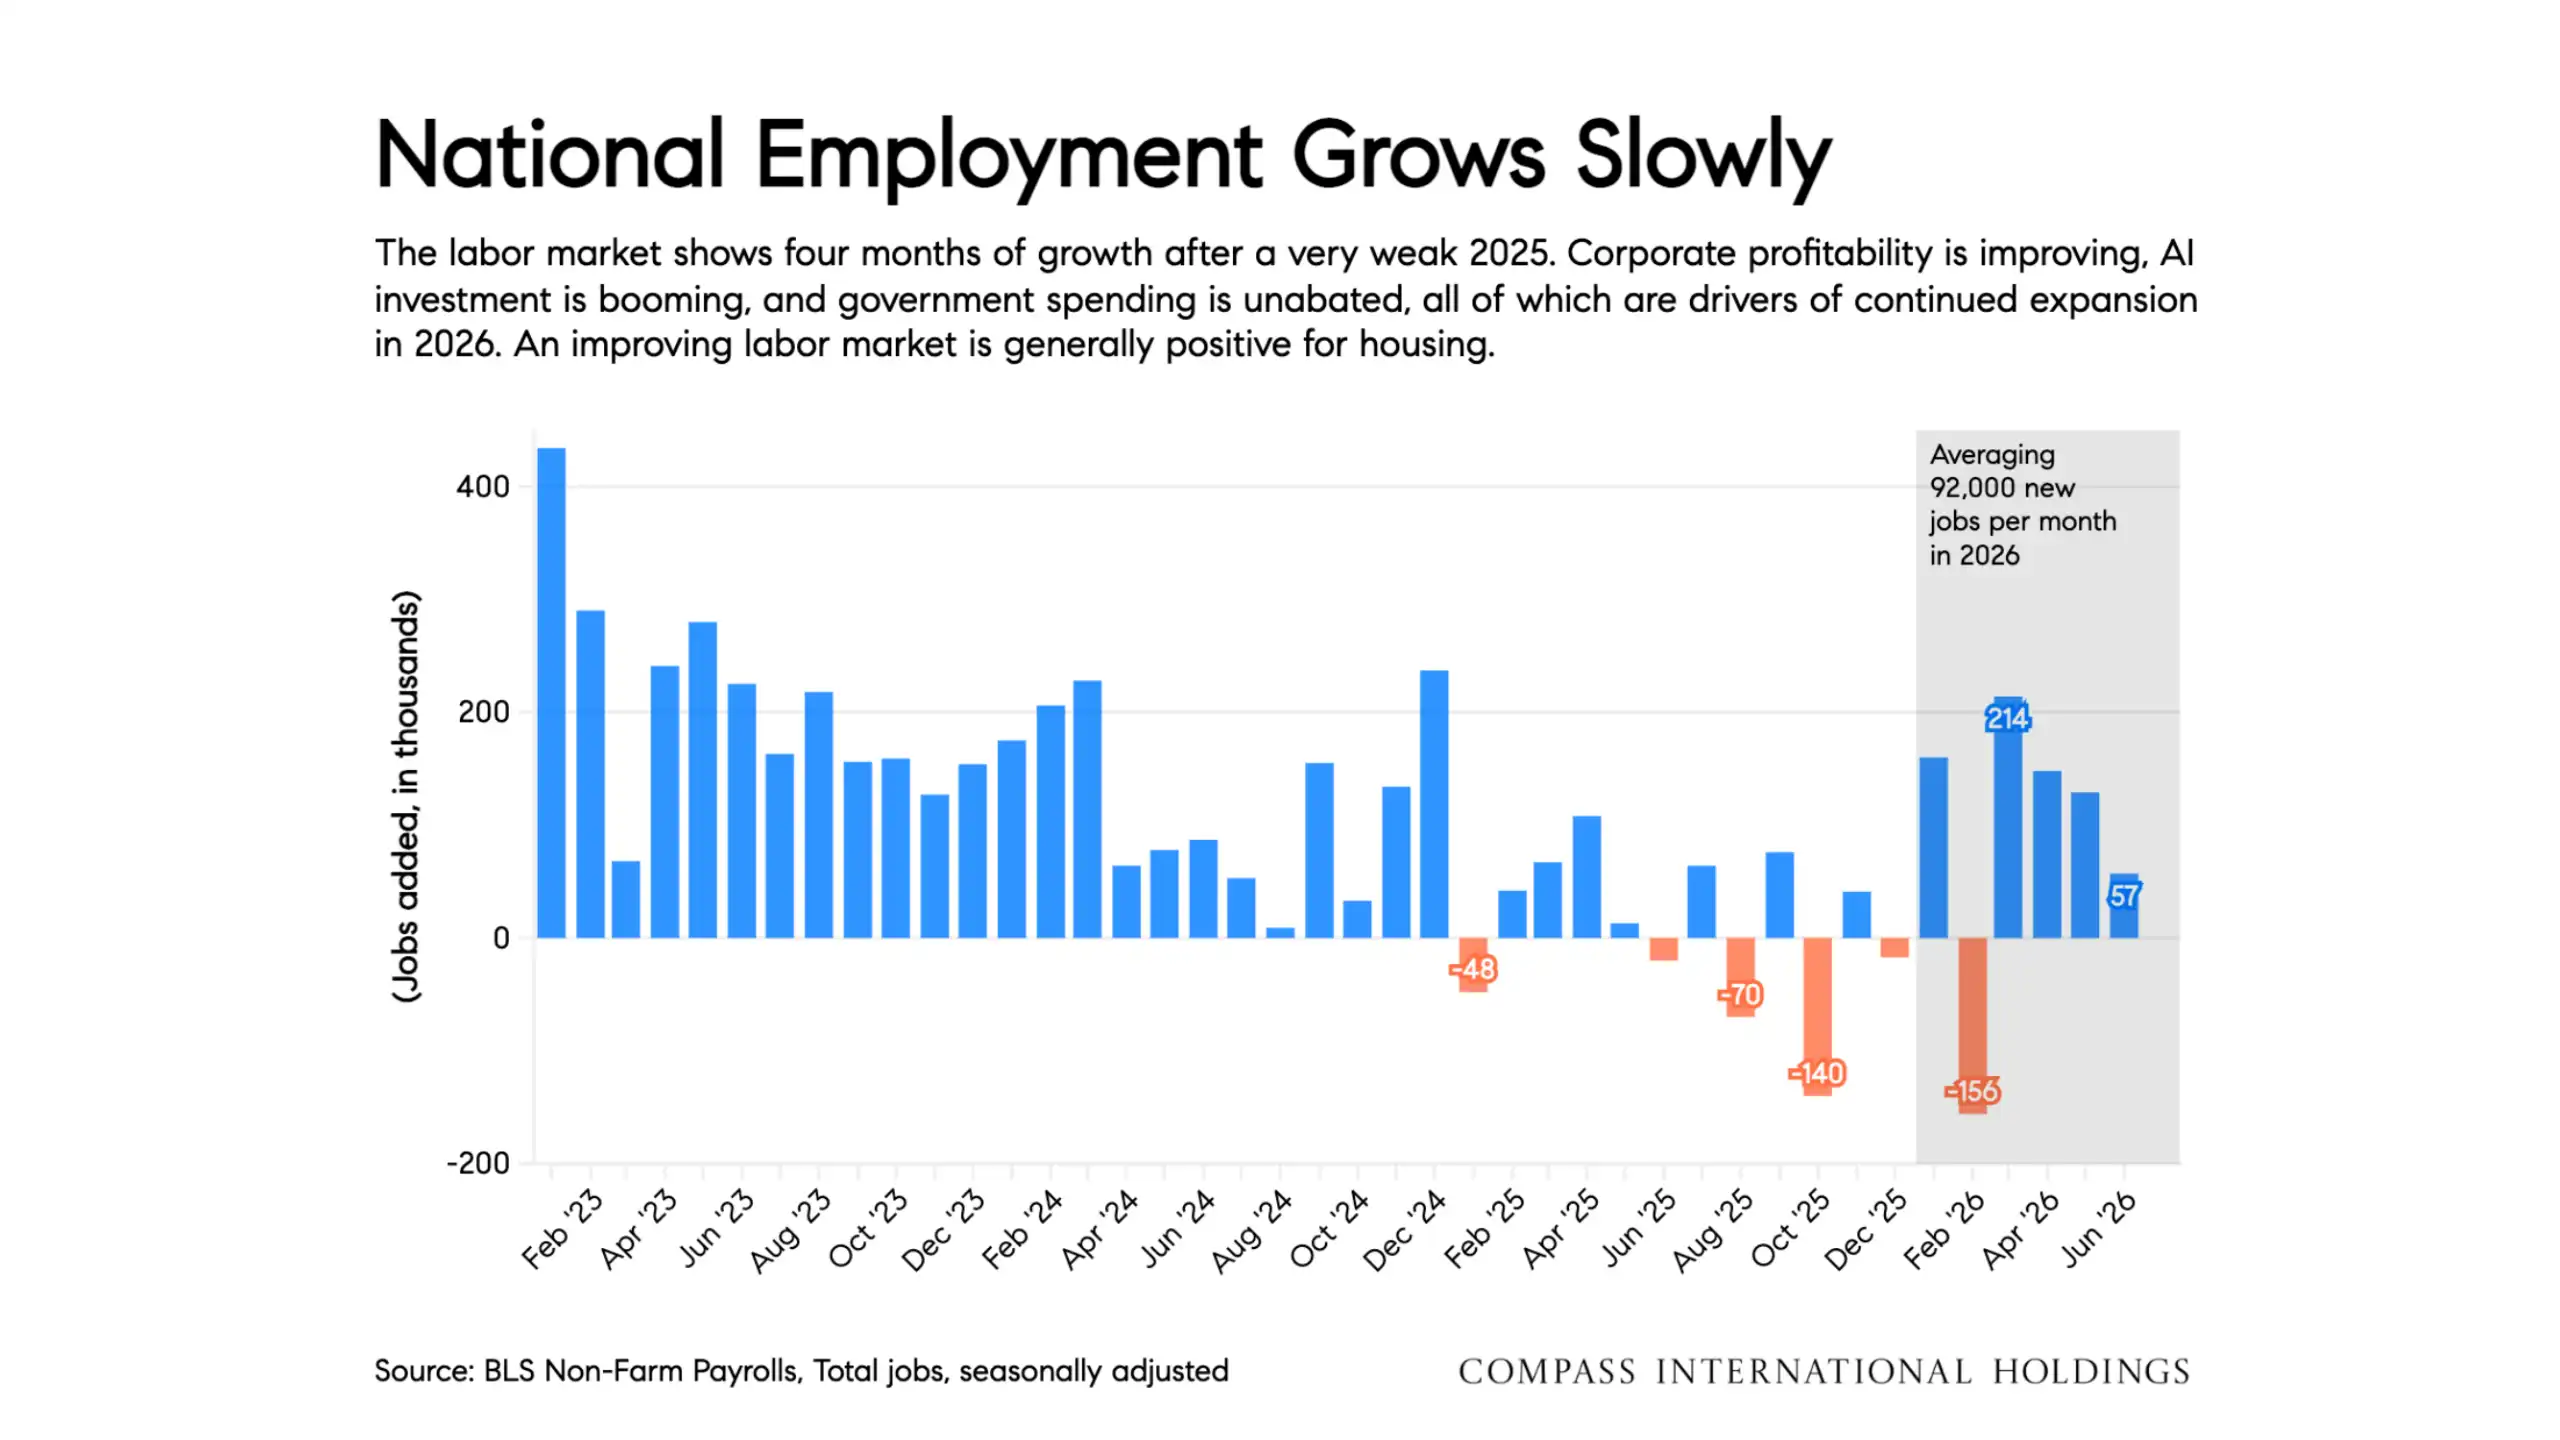
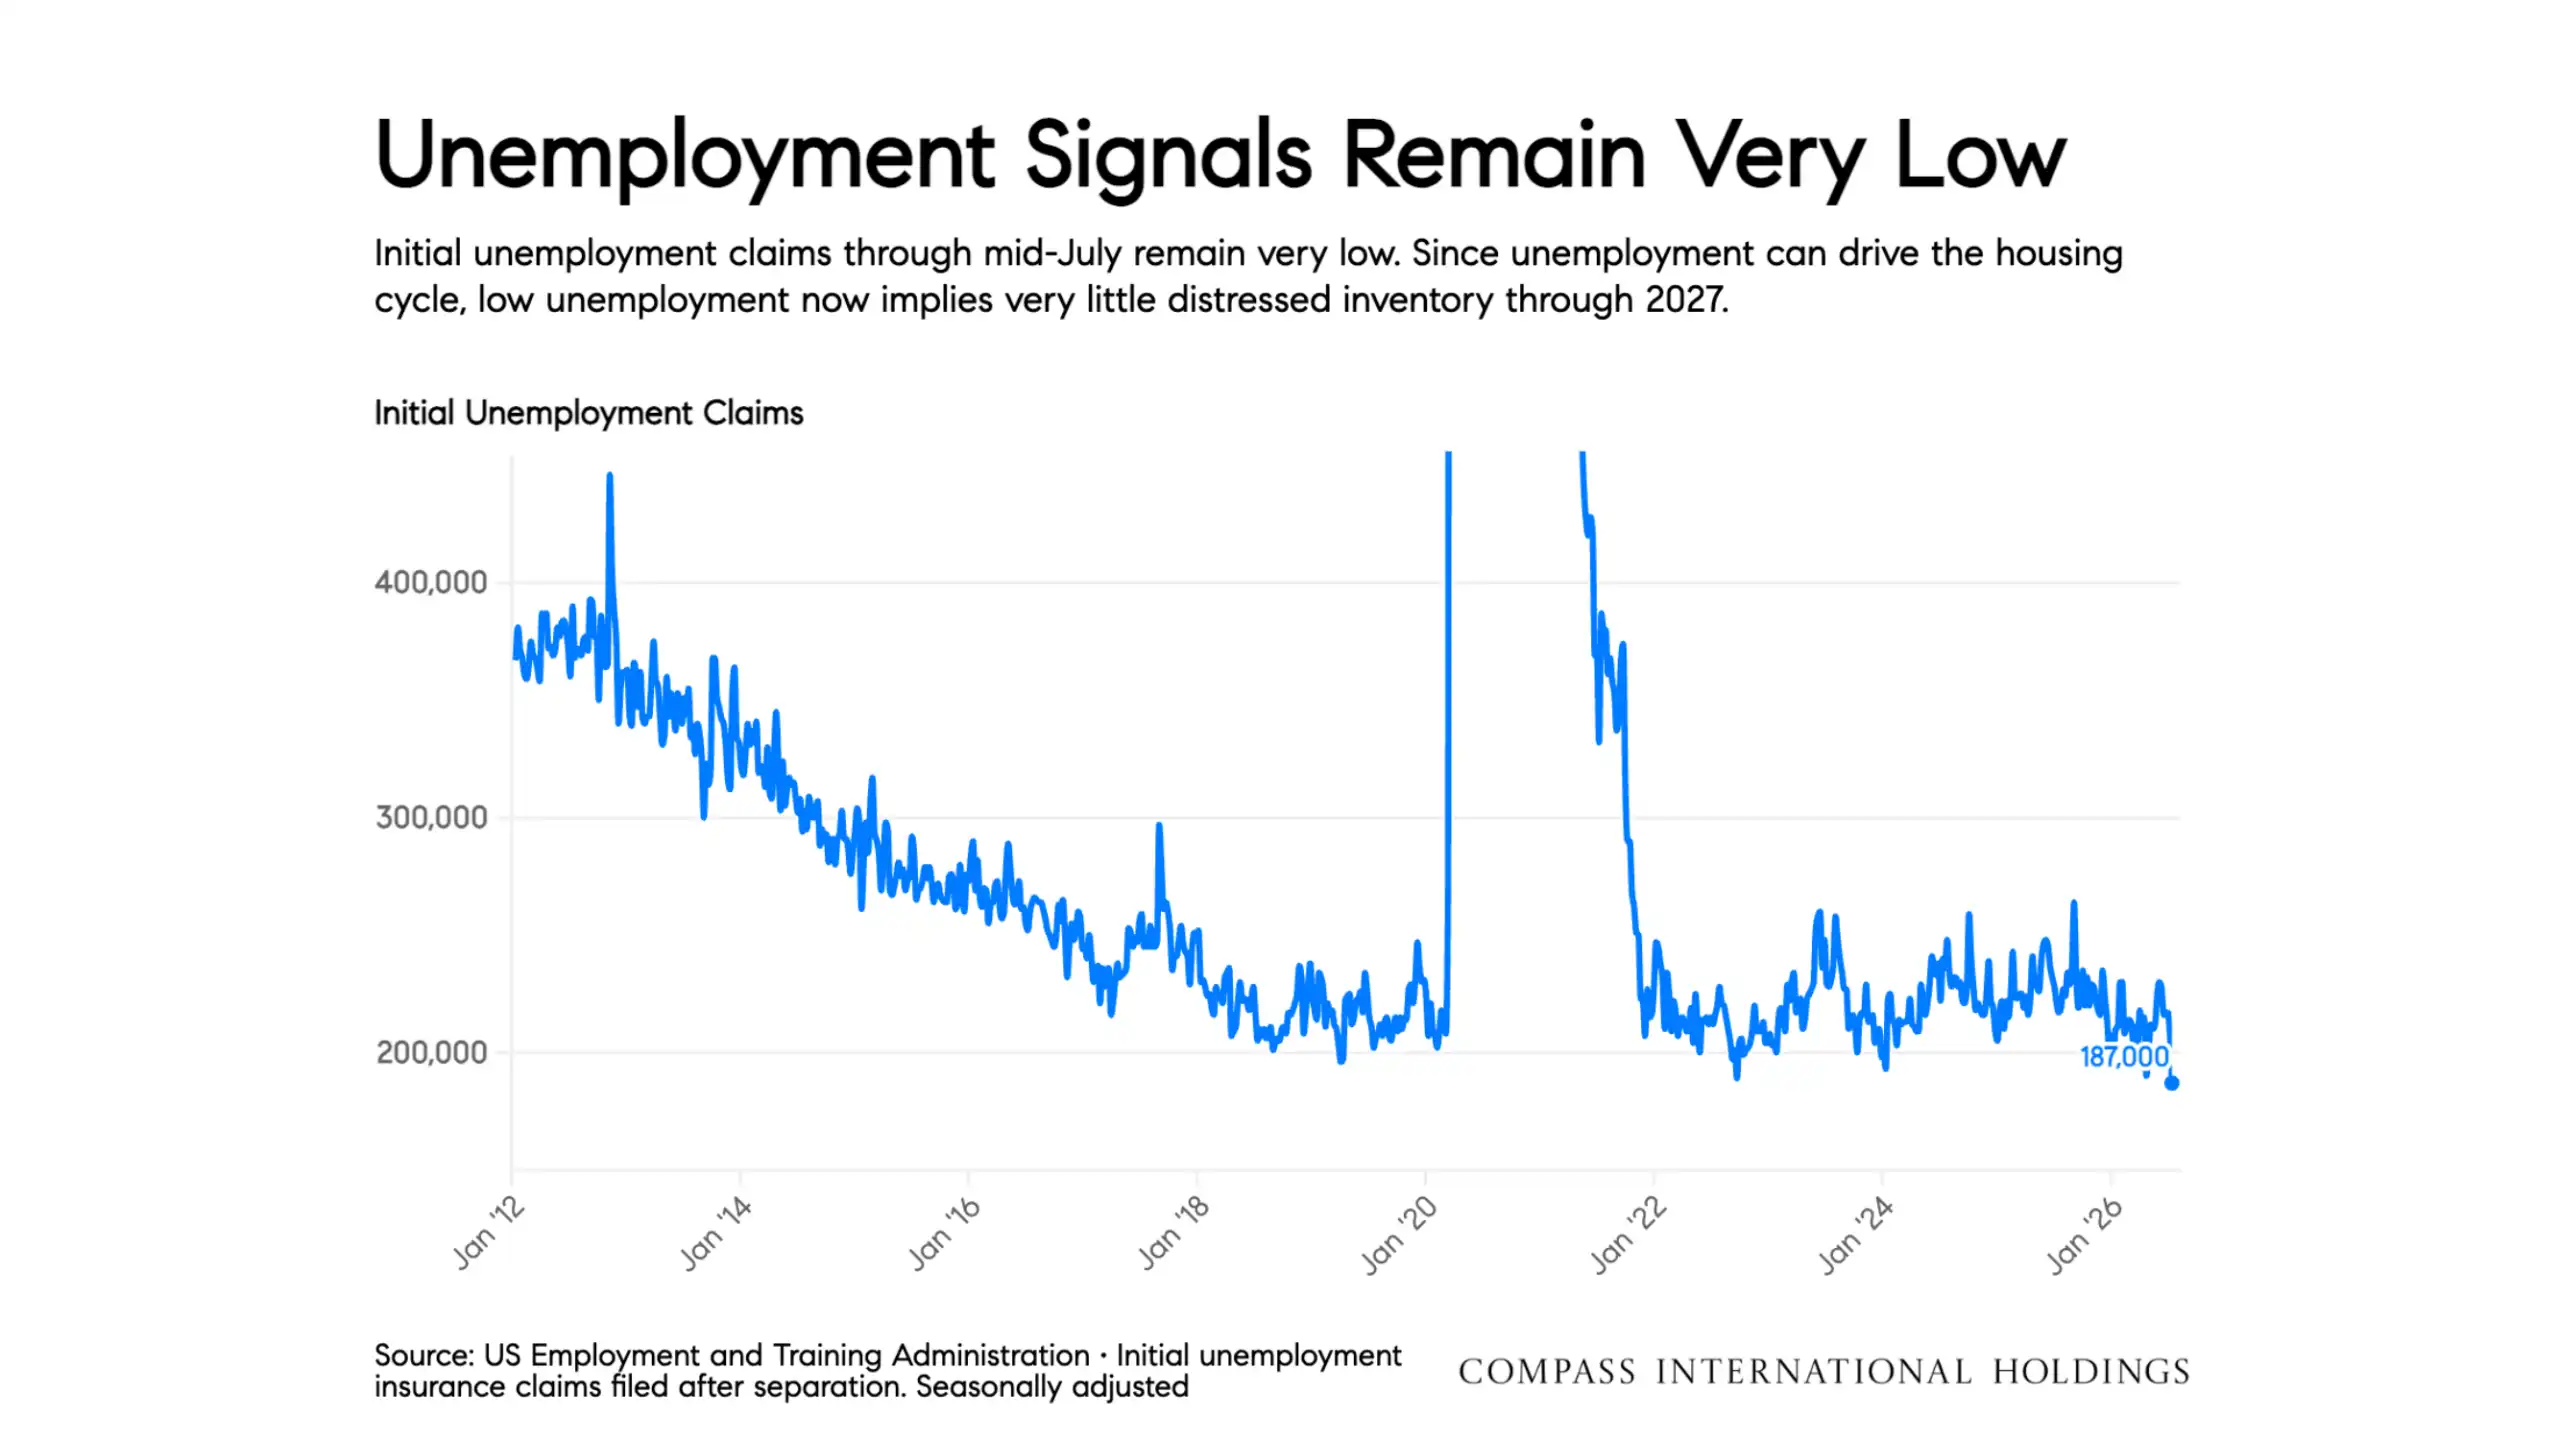
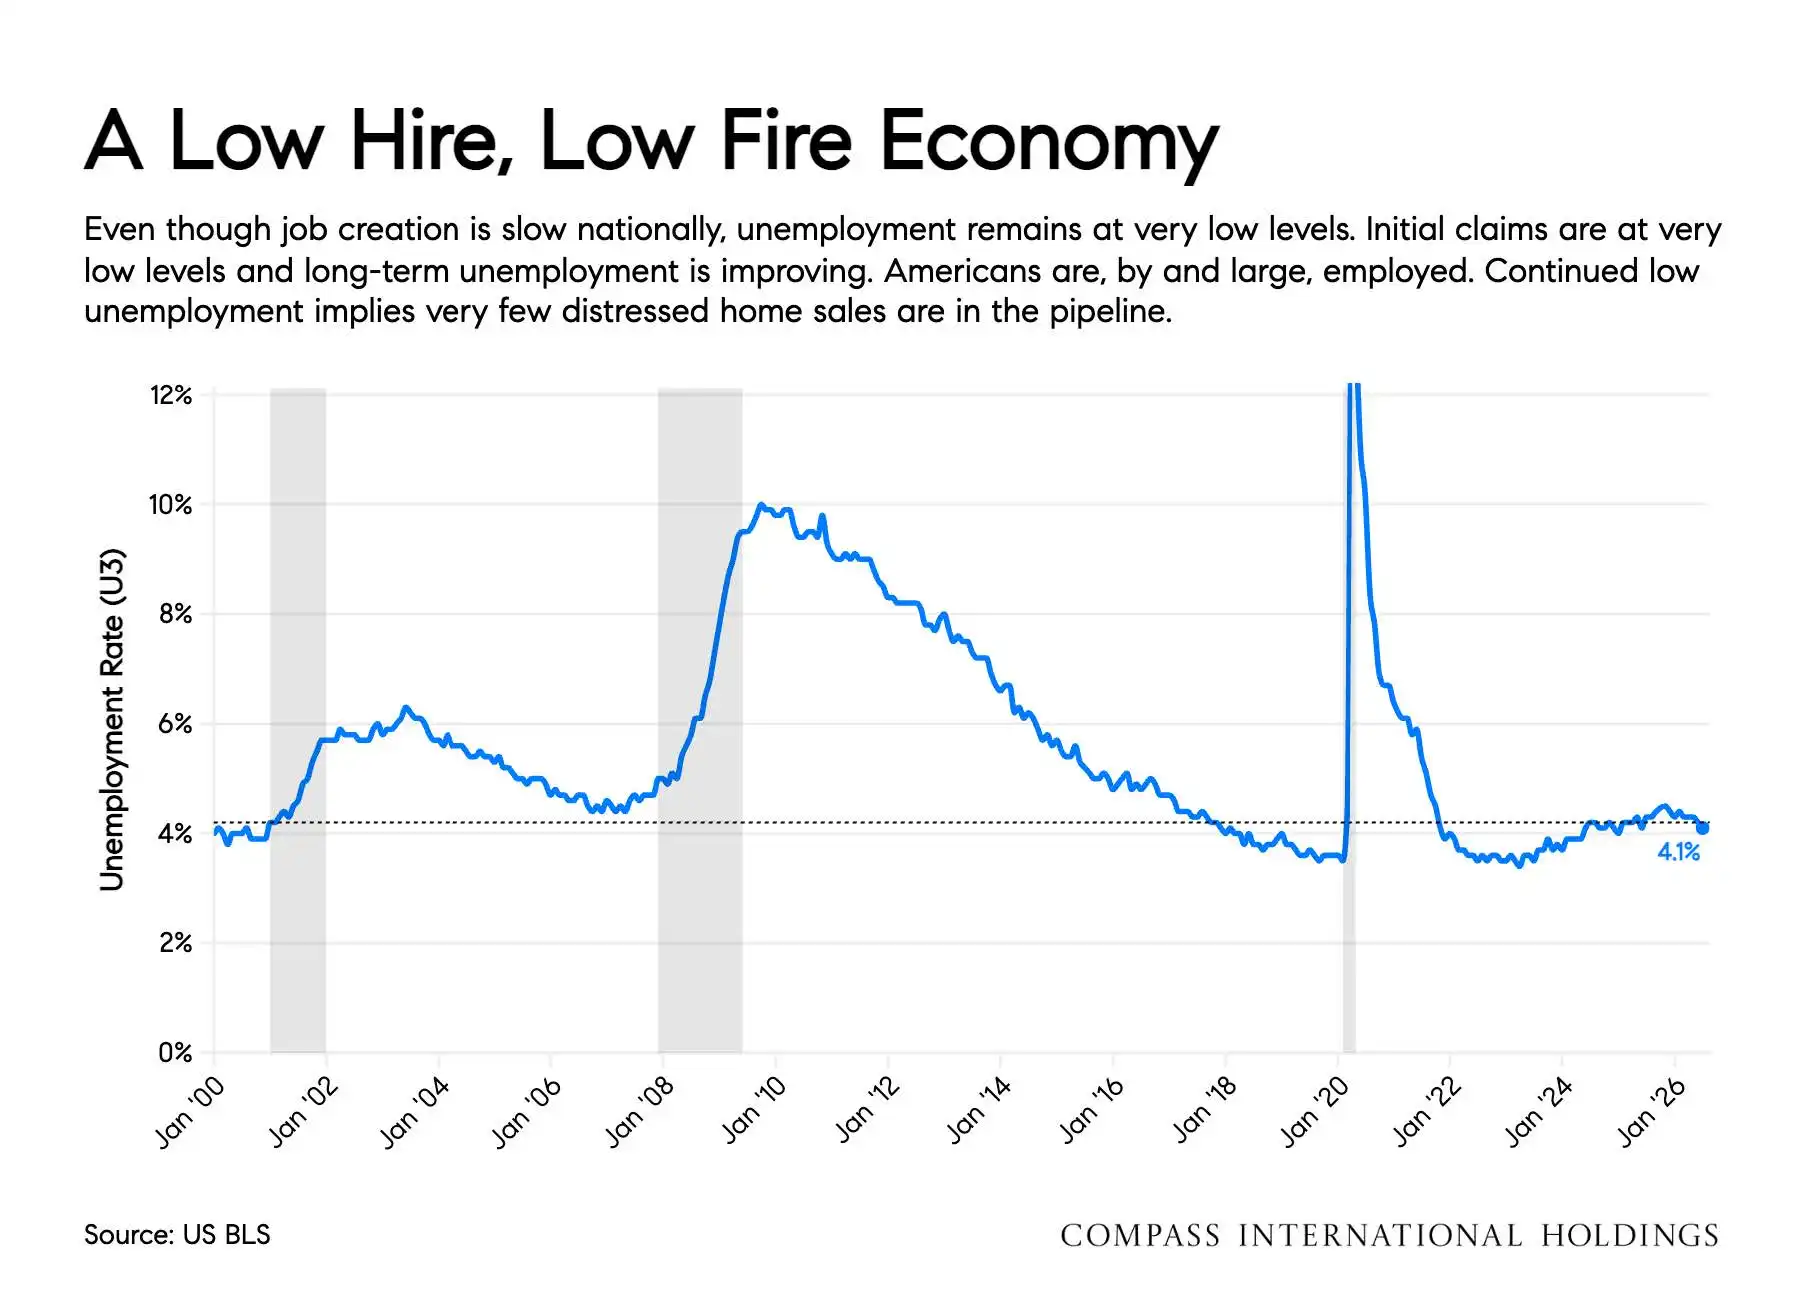
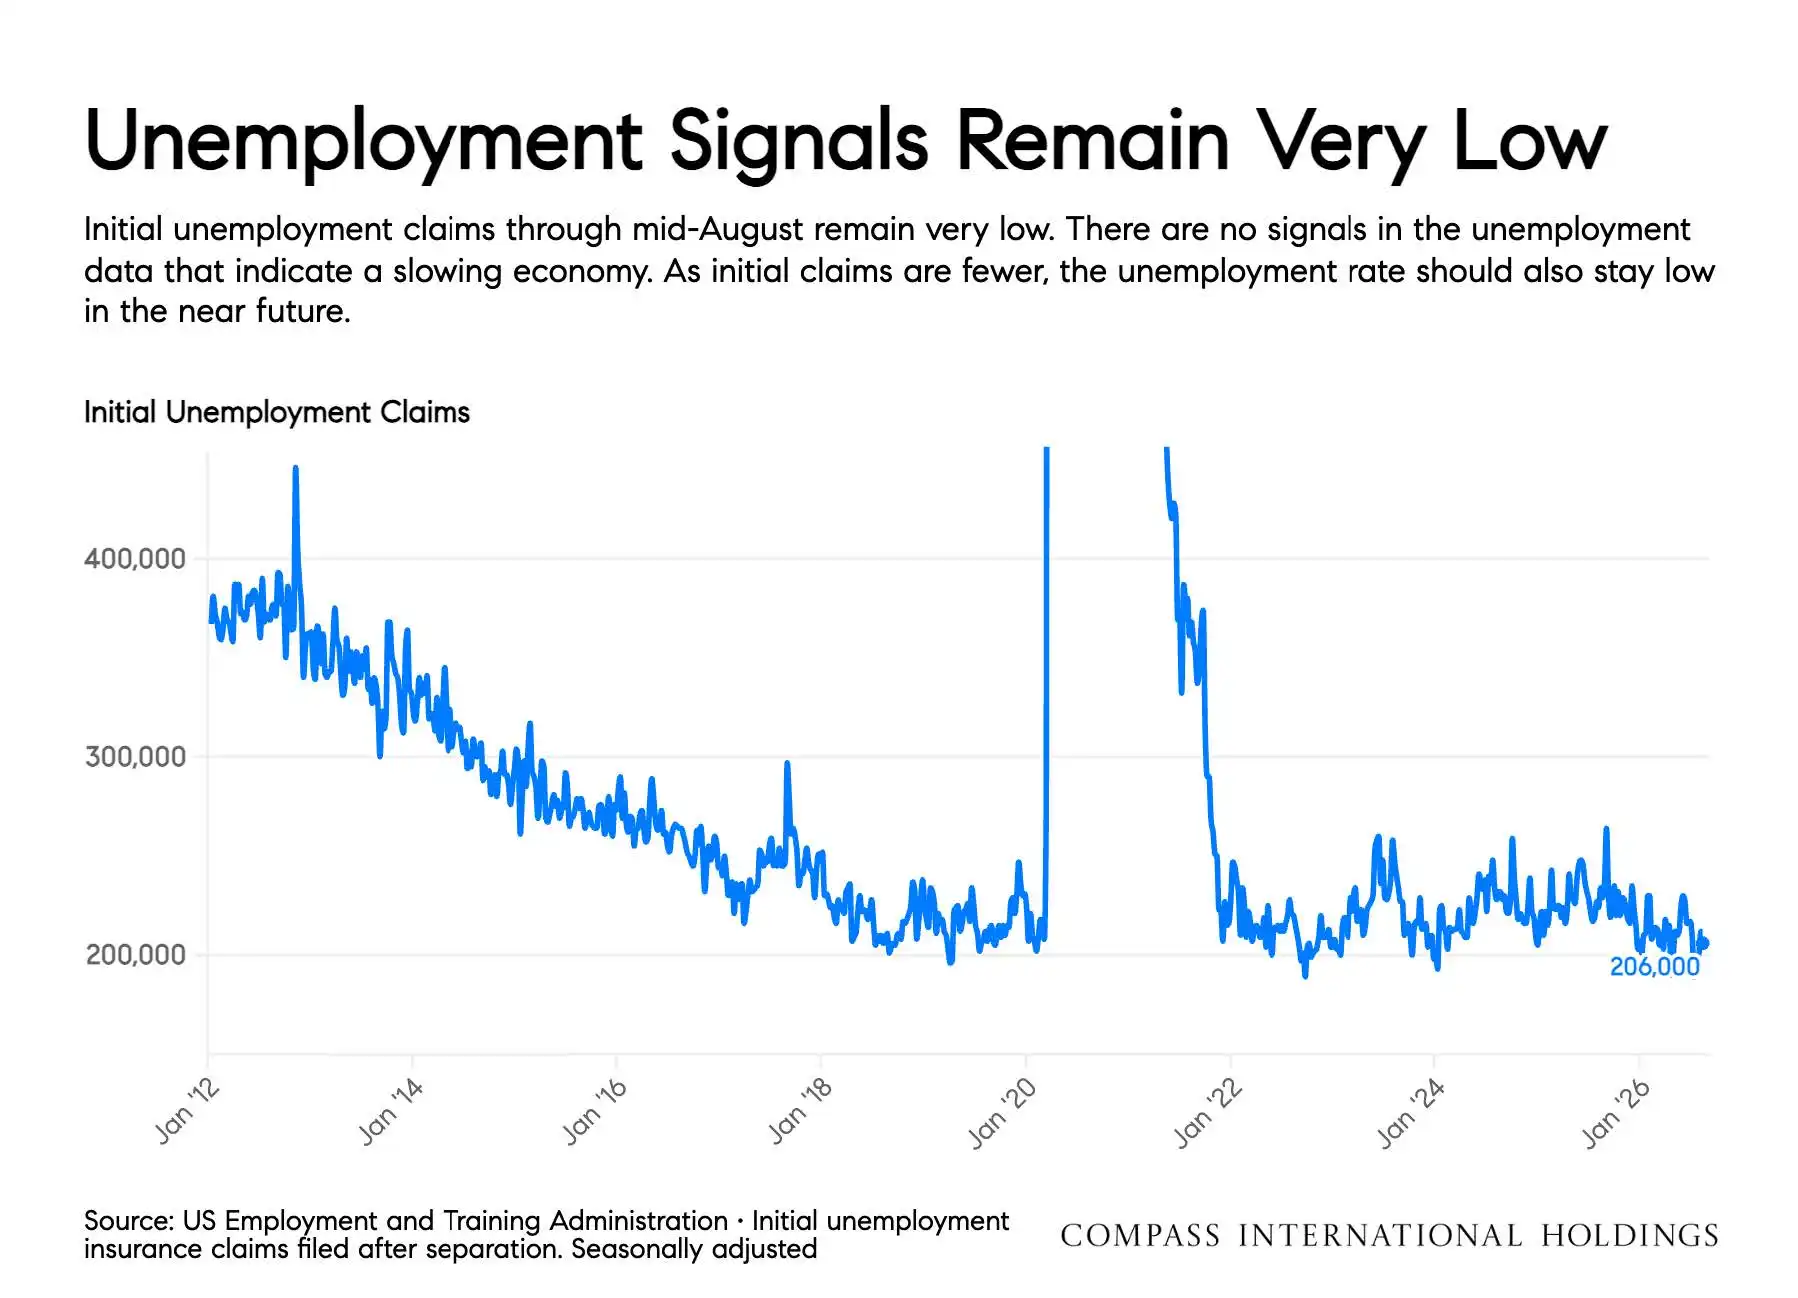
The labor market continues to provide an important source of stability. National employment growth has been relatively slow, but unemployment claims remained very low through mid-July. That matters for housing because strong employment generally supports household confidence and limits the amount of distressed inventory entering the market.
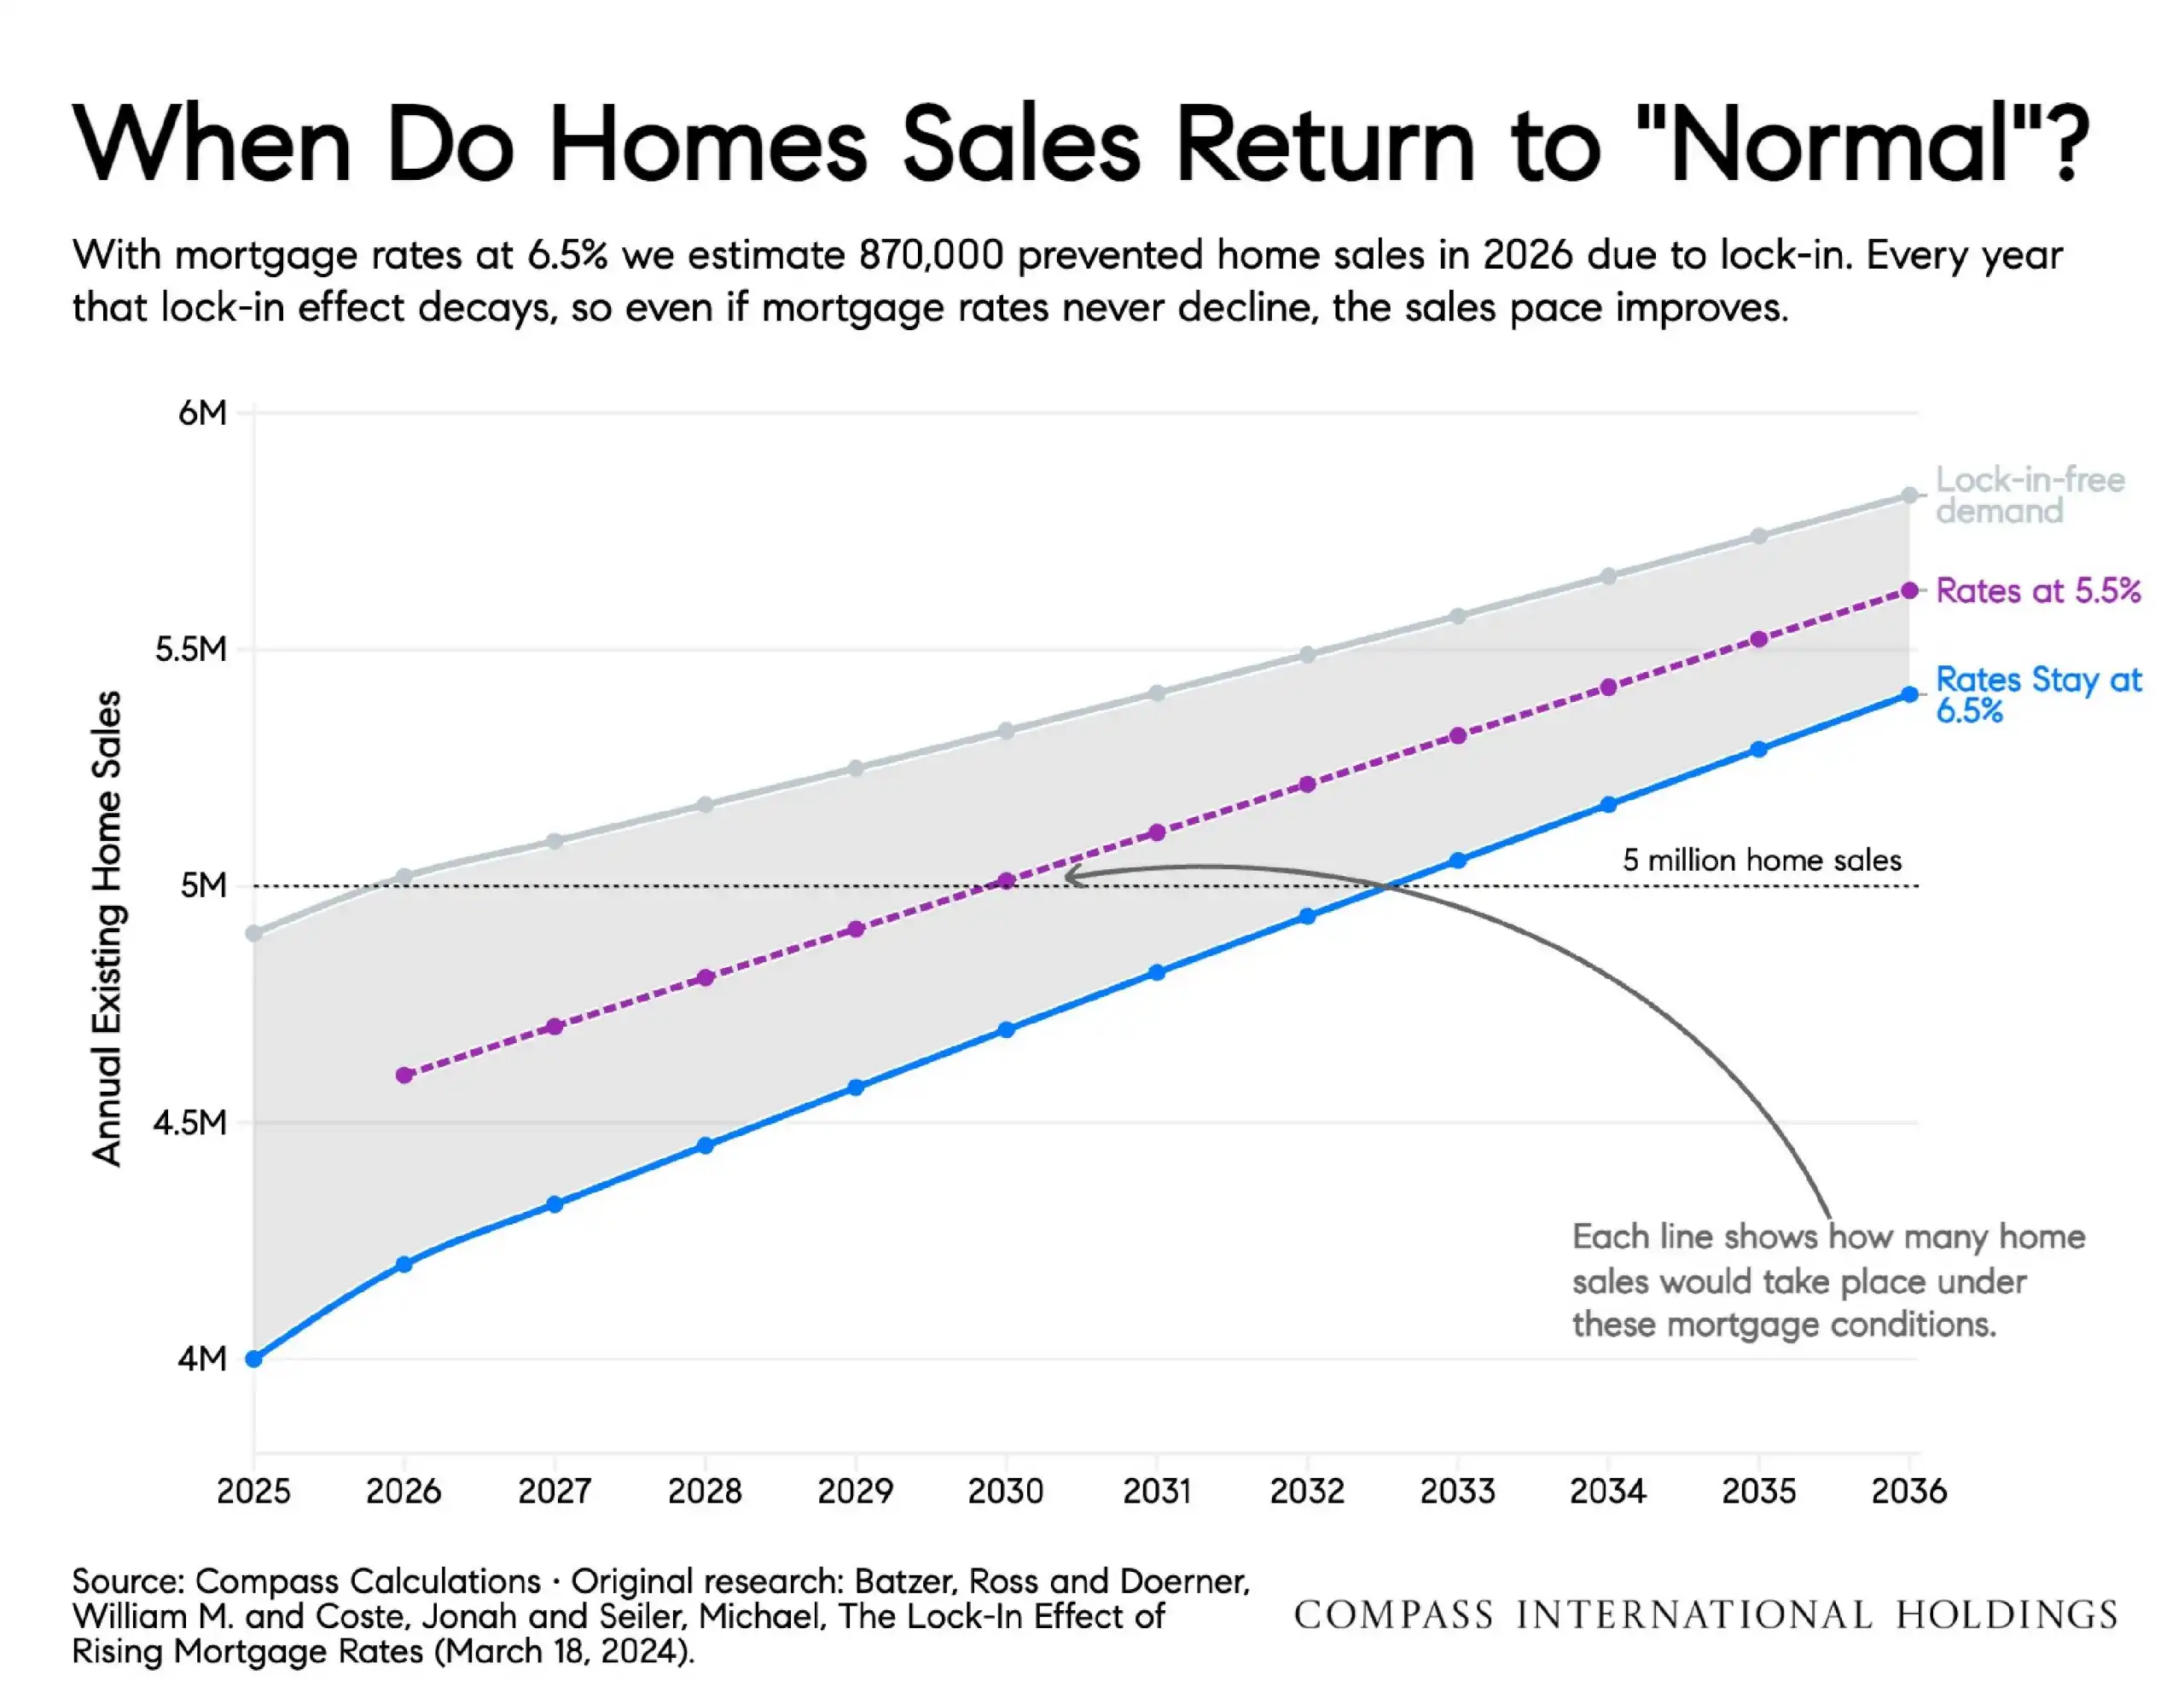
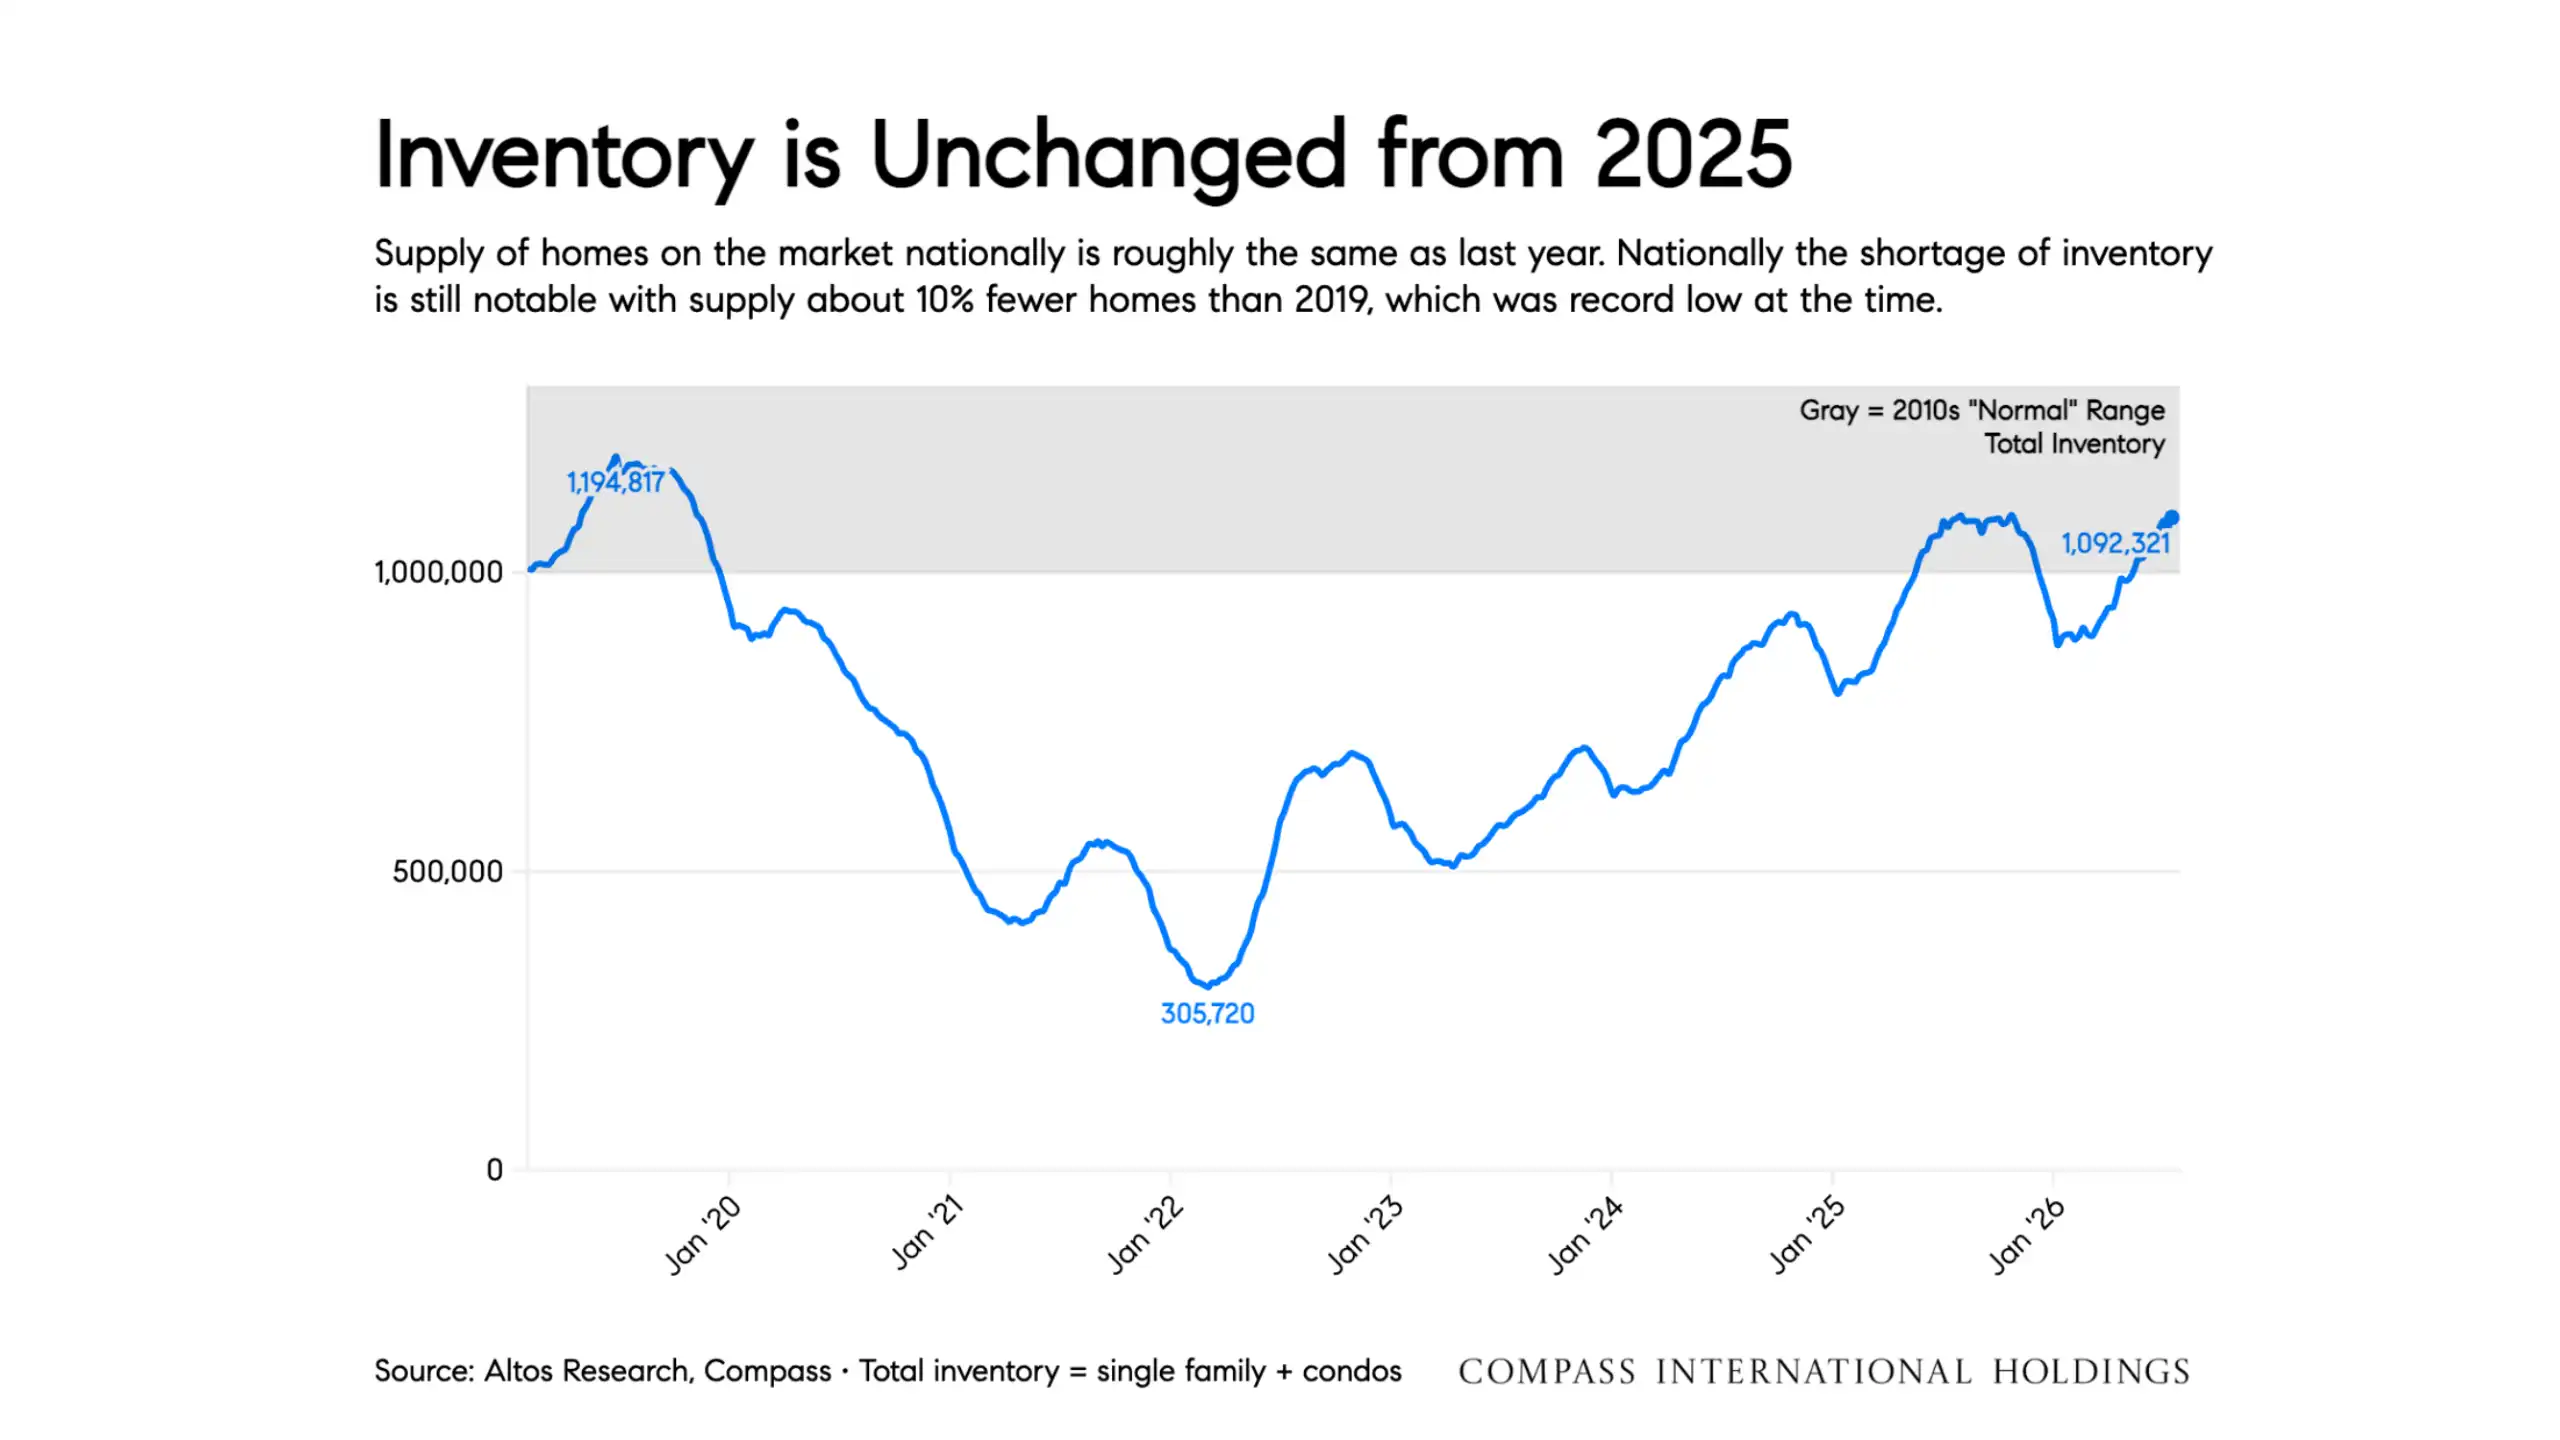
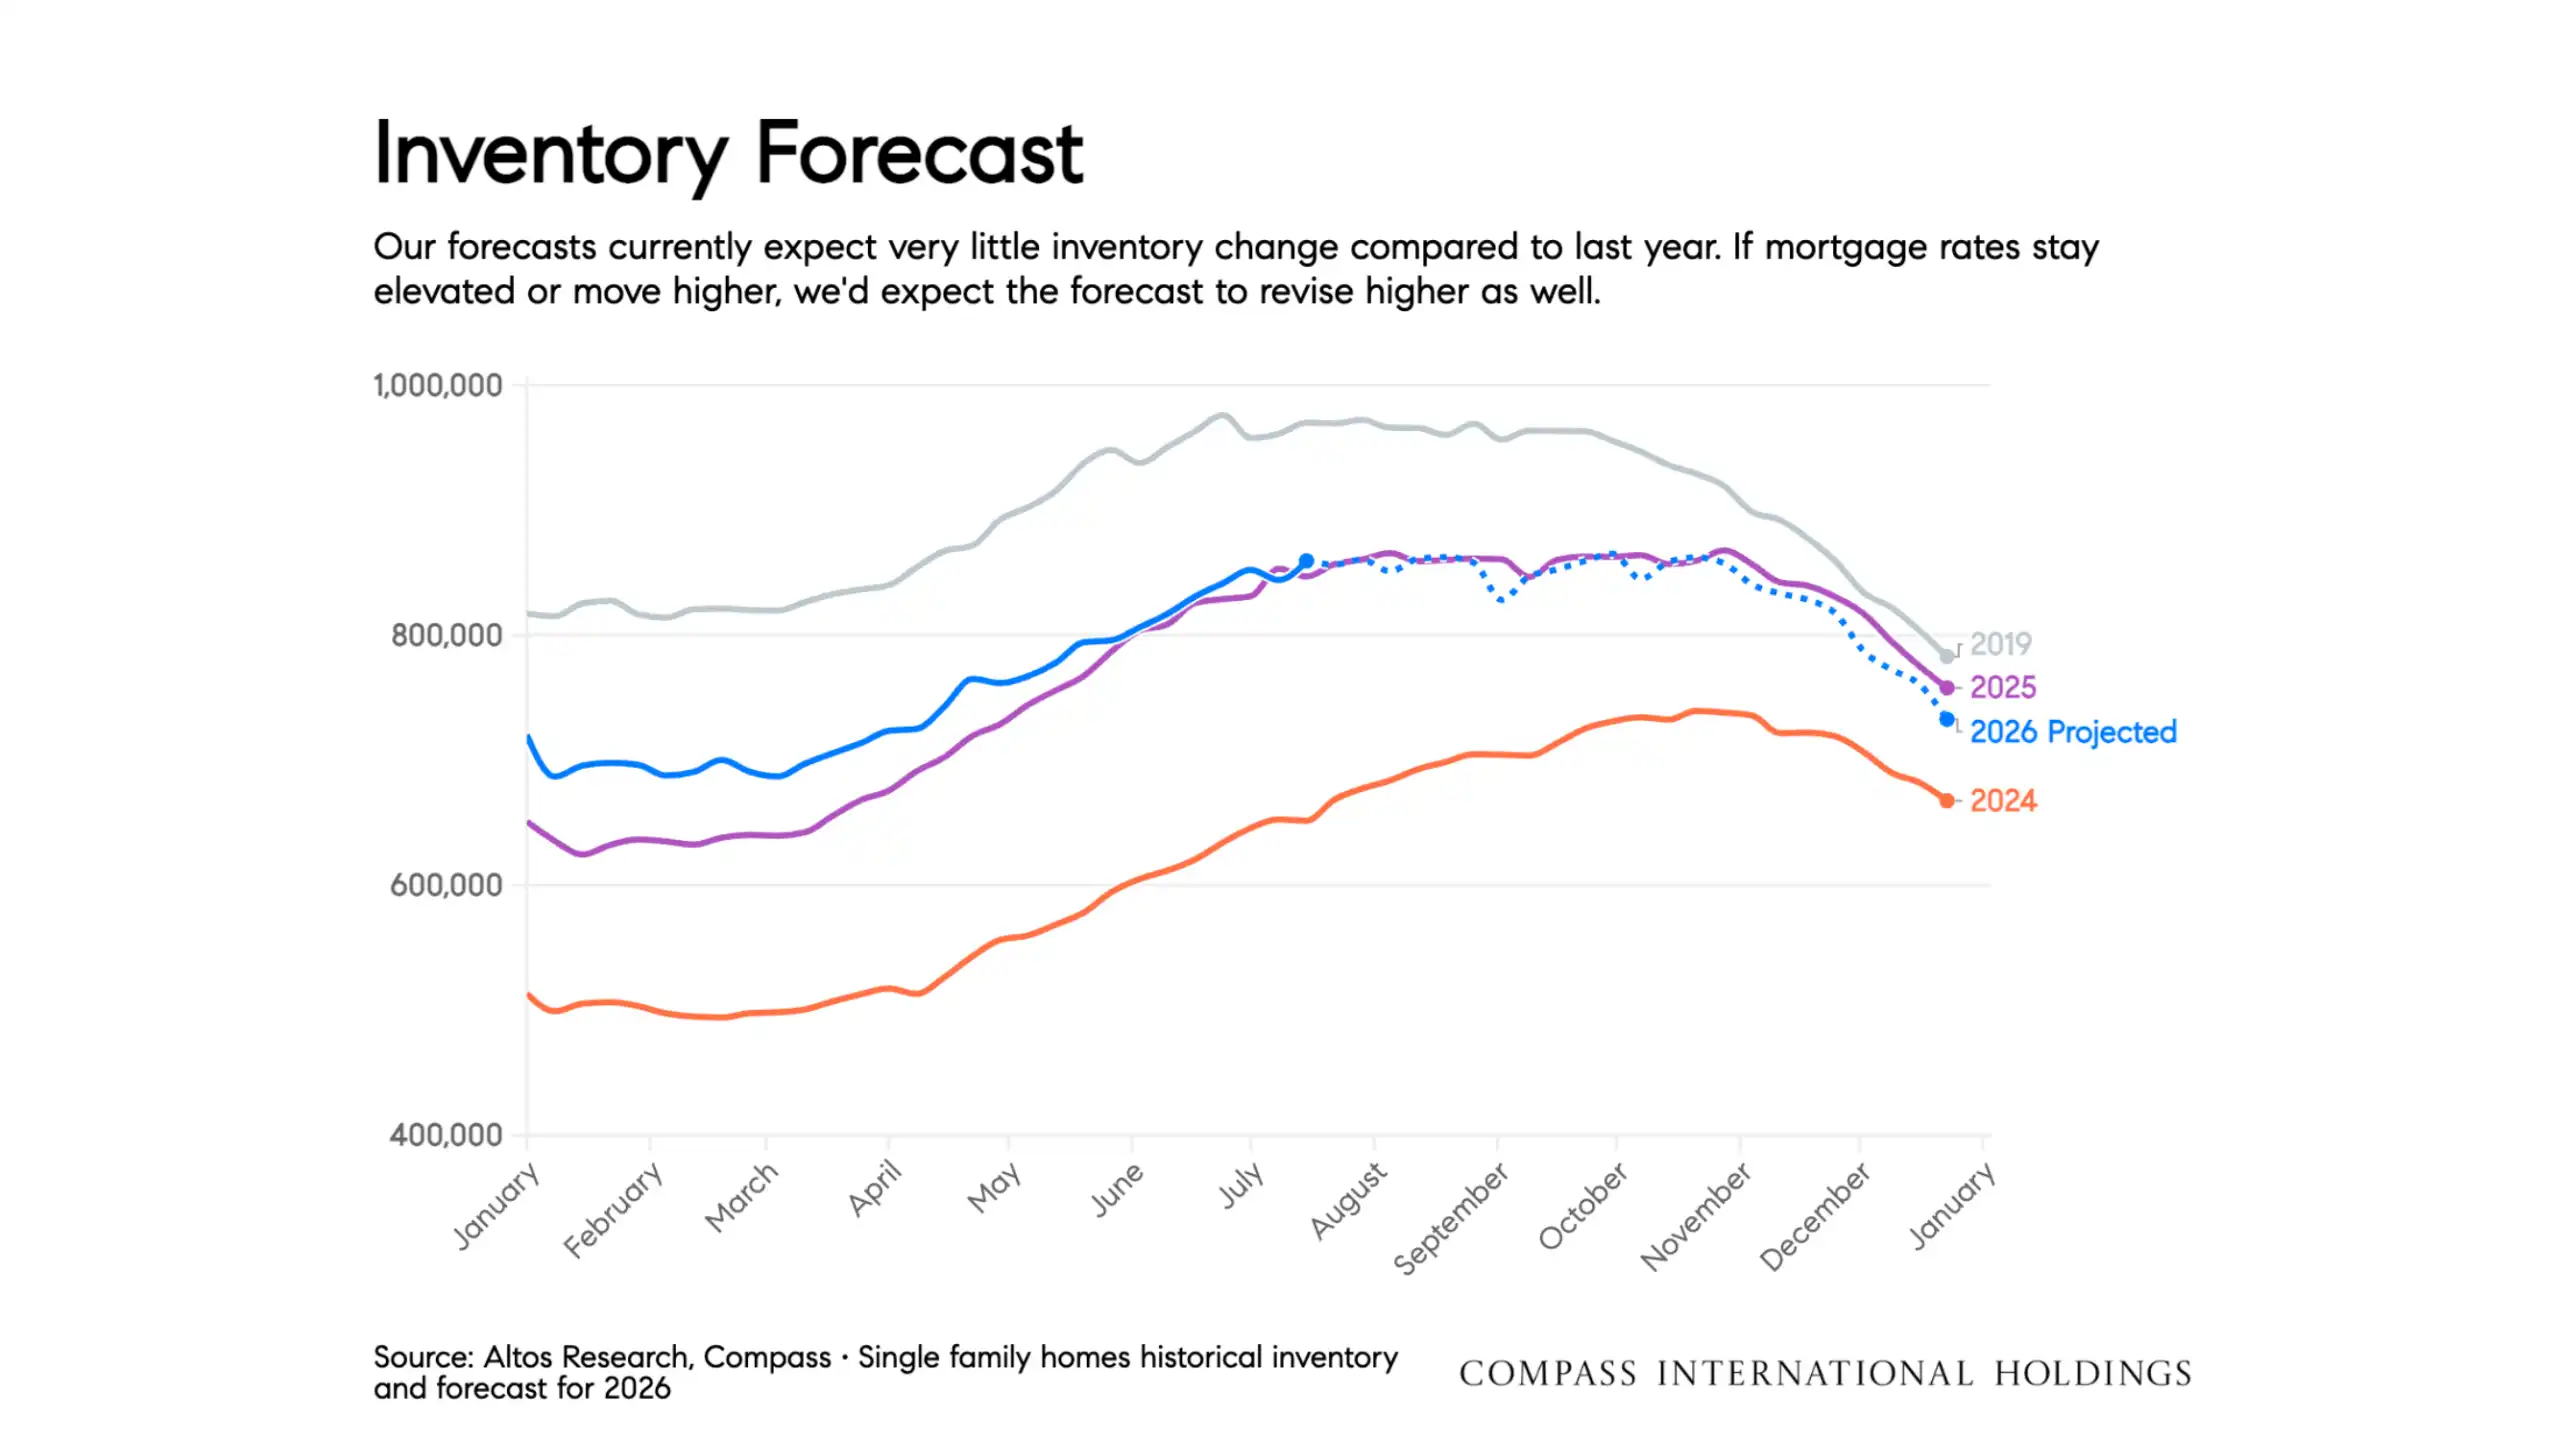
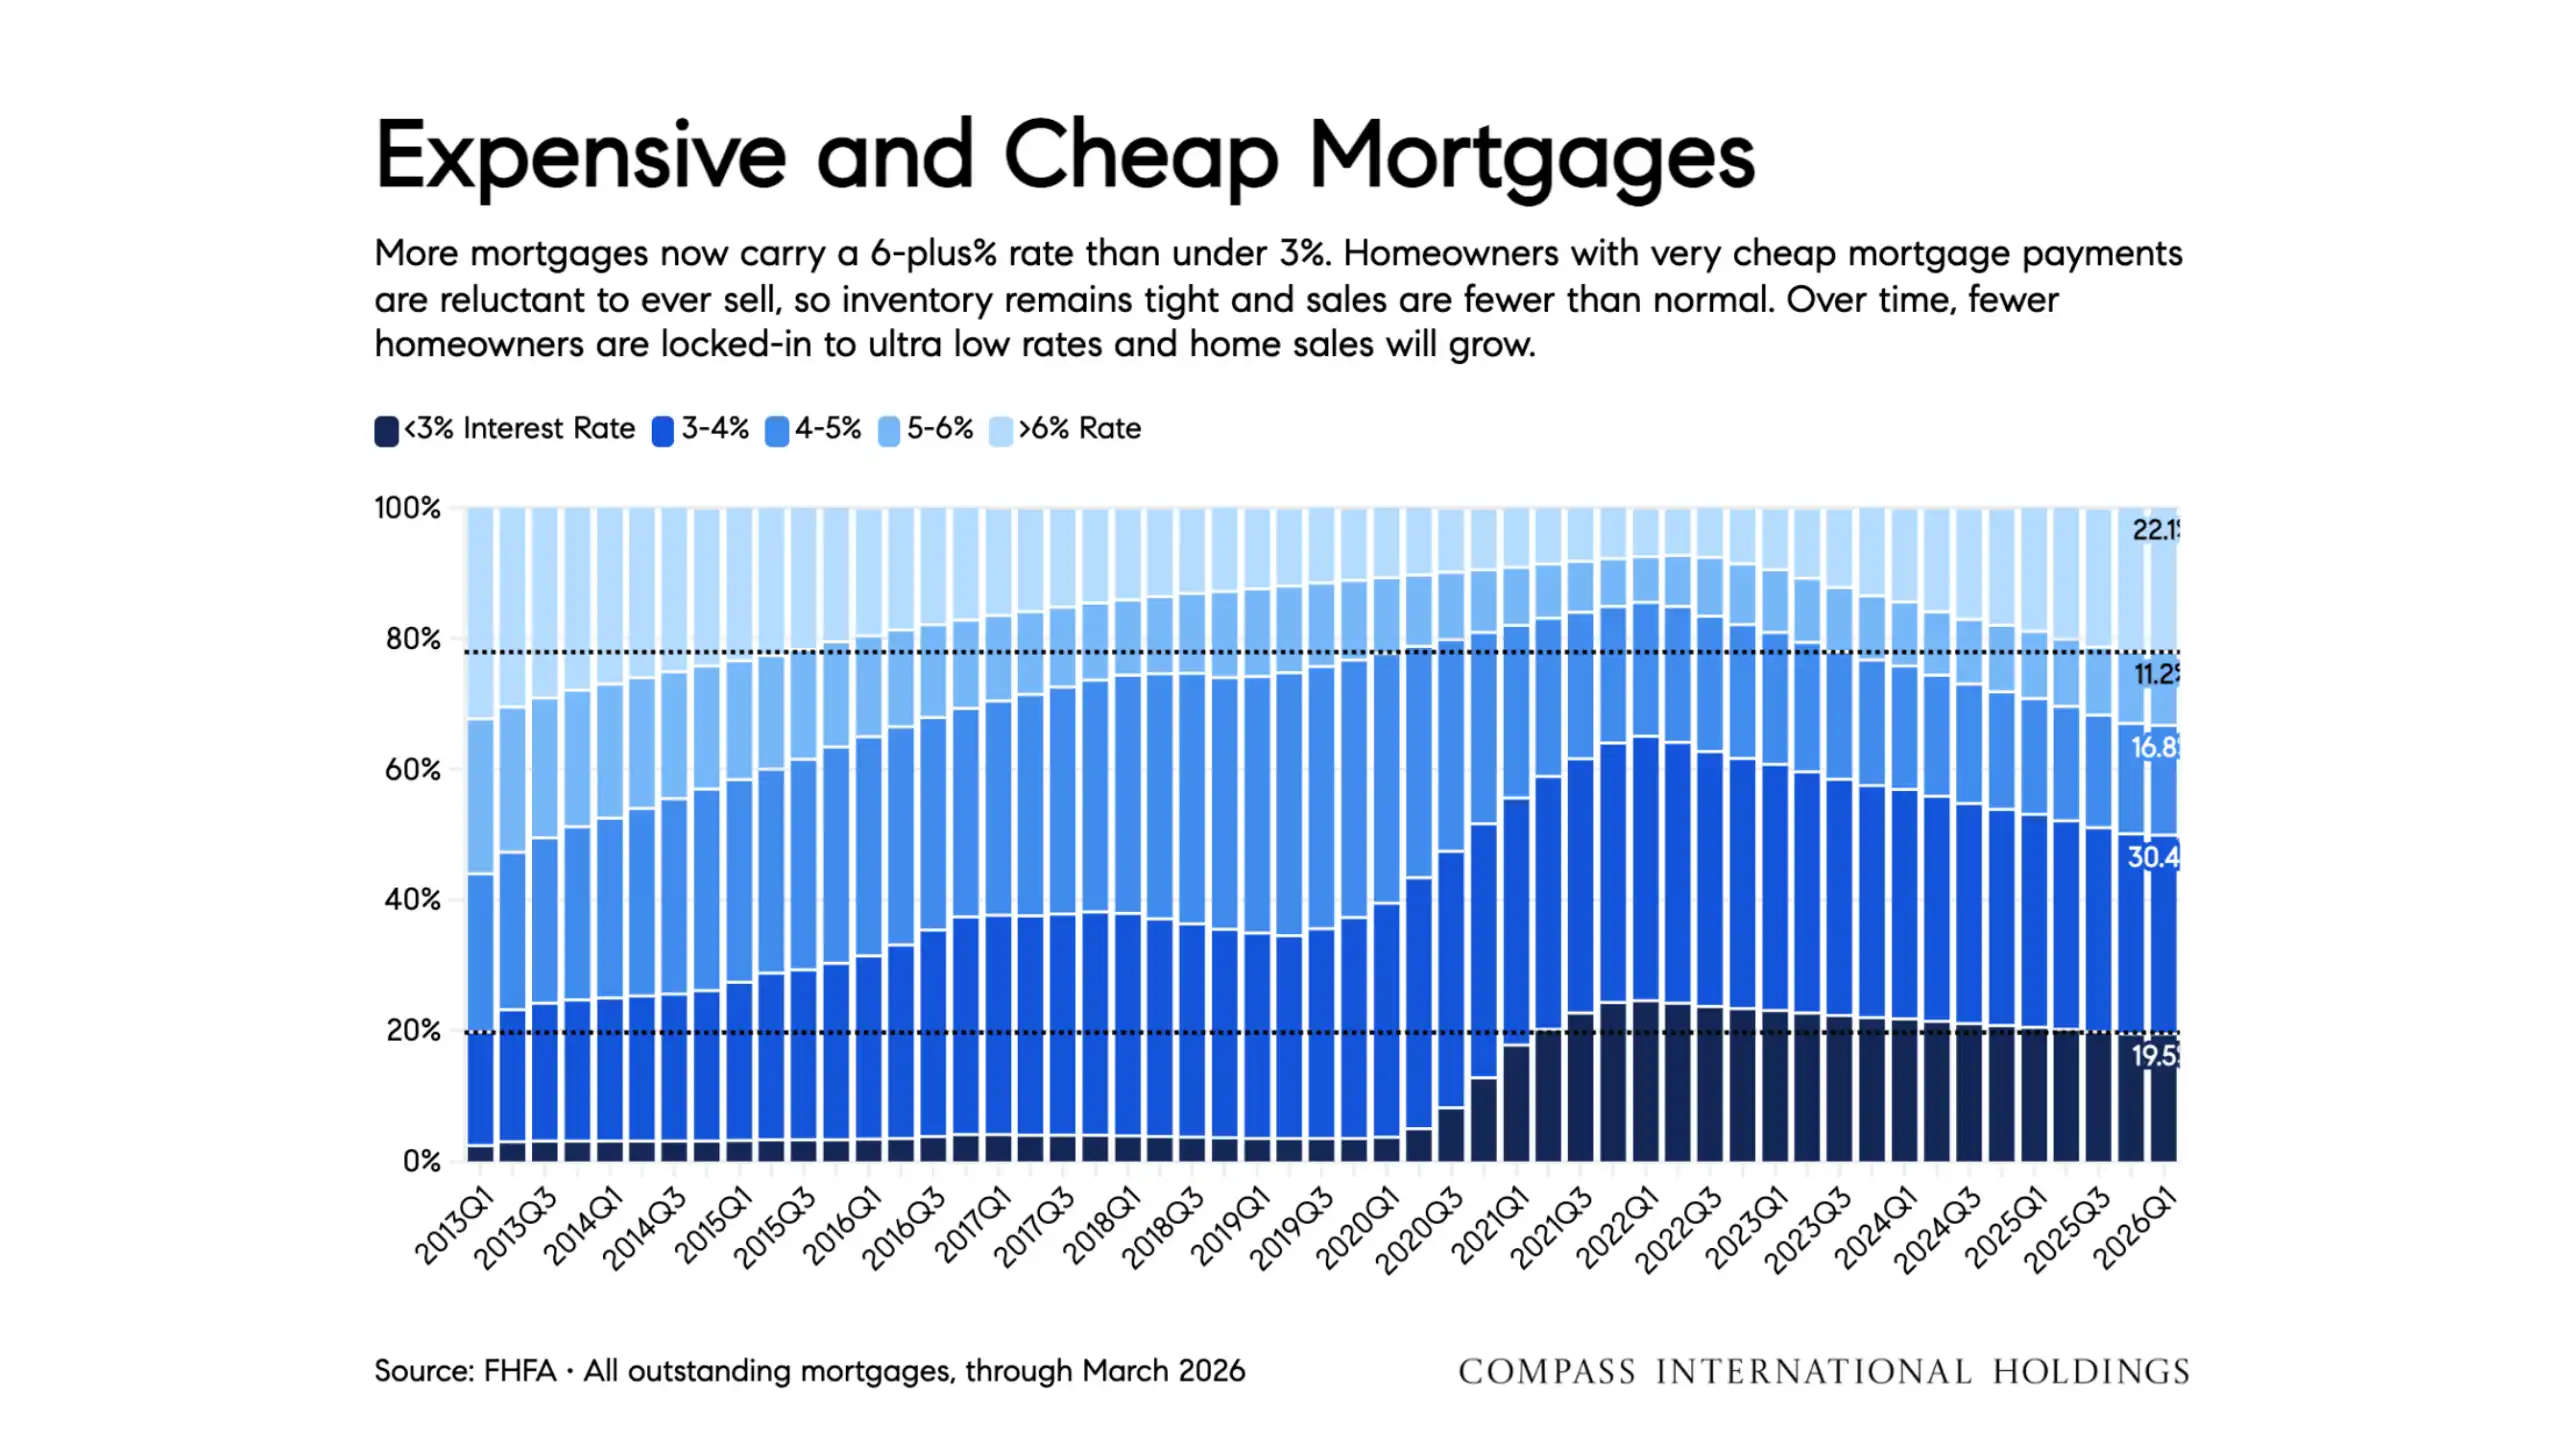
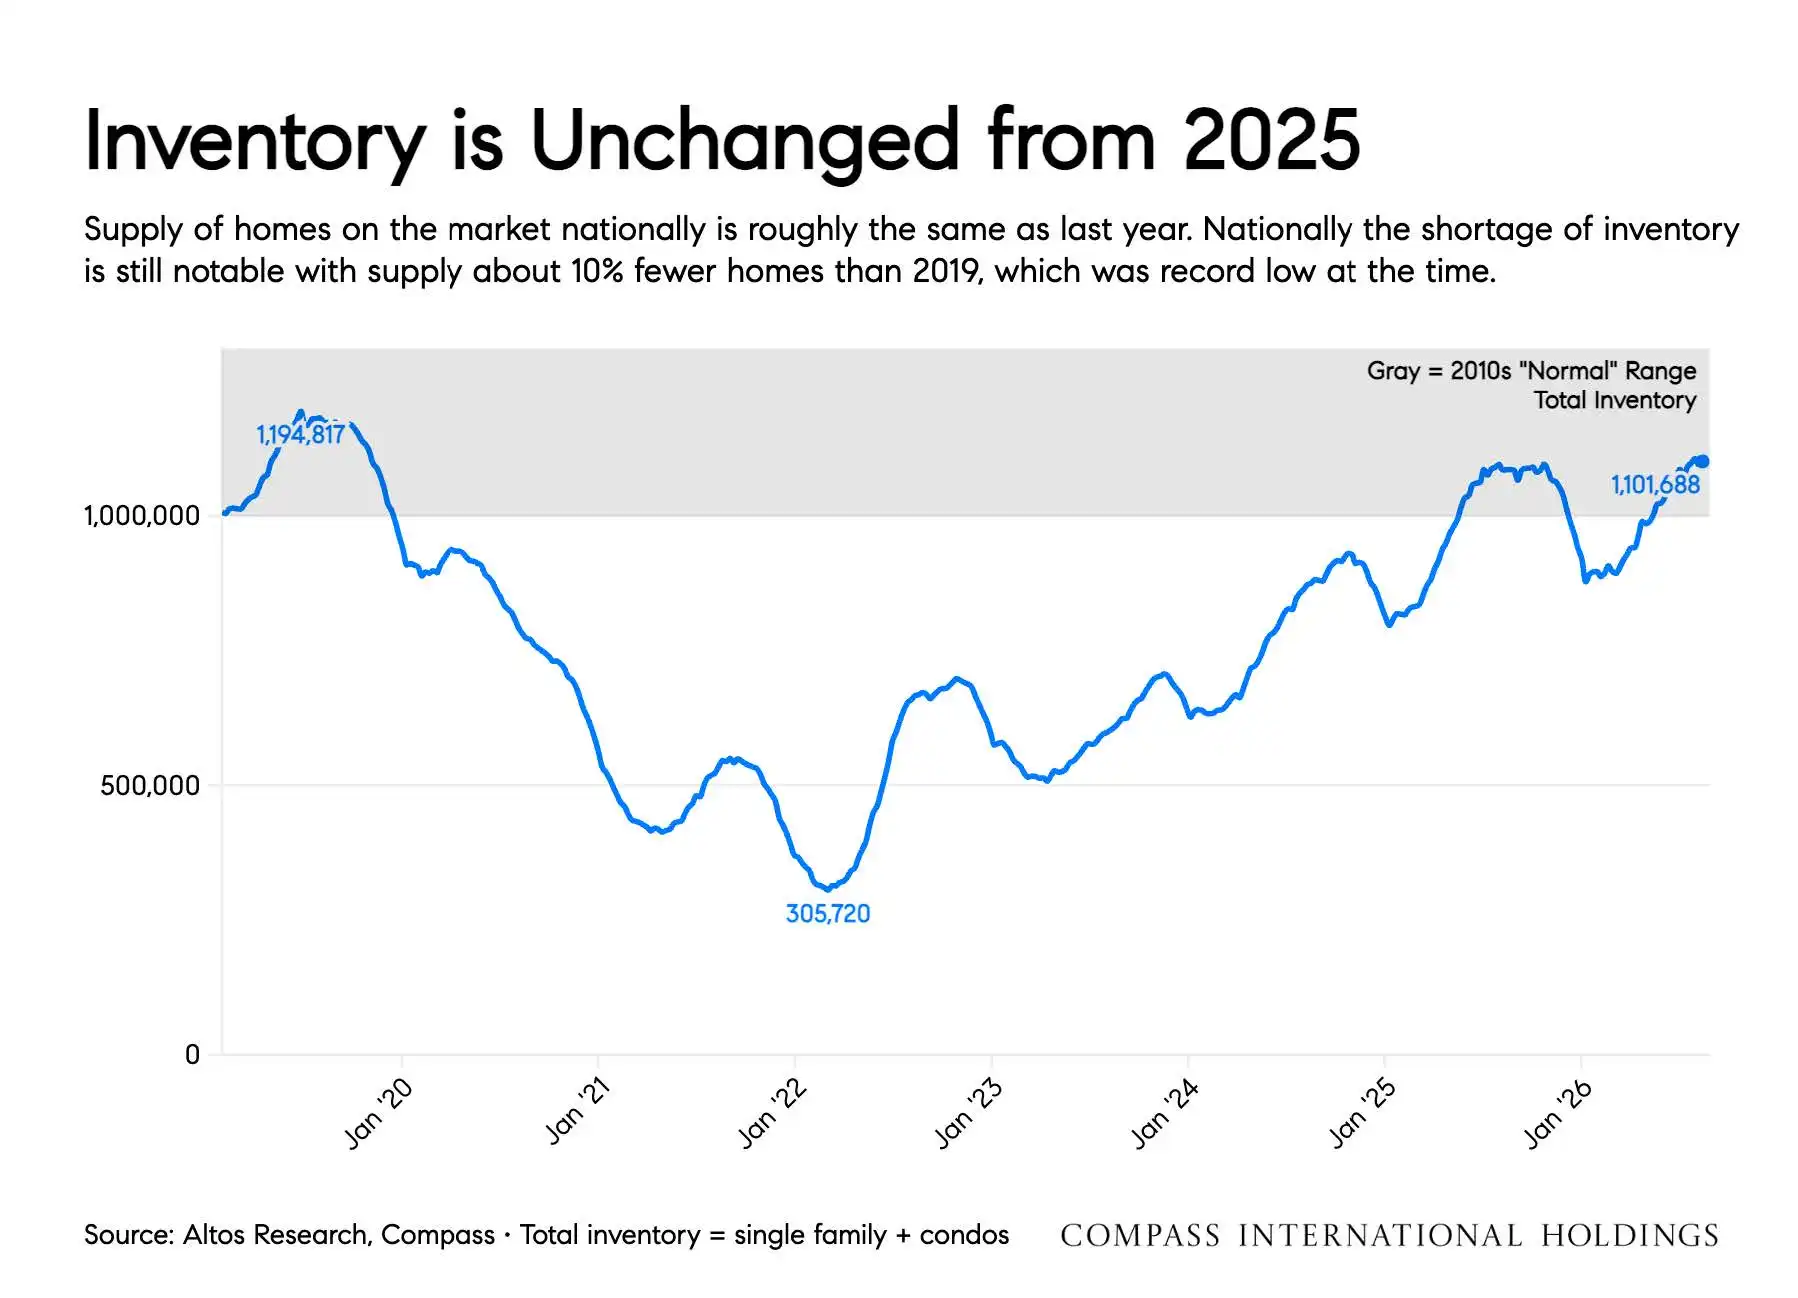
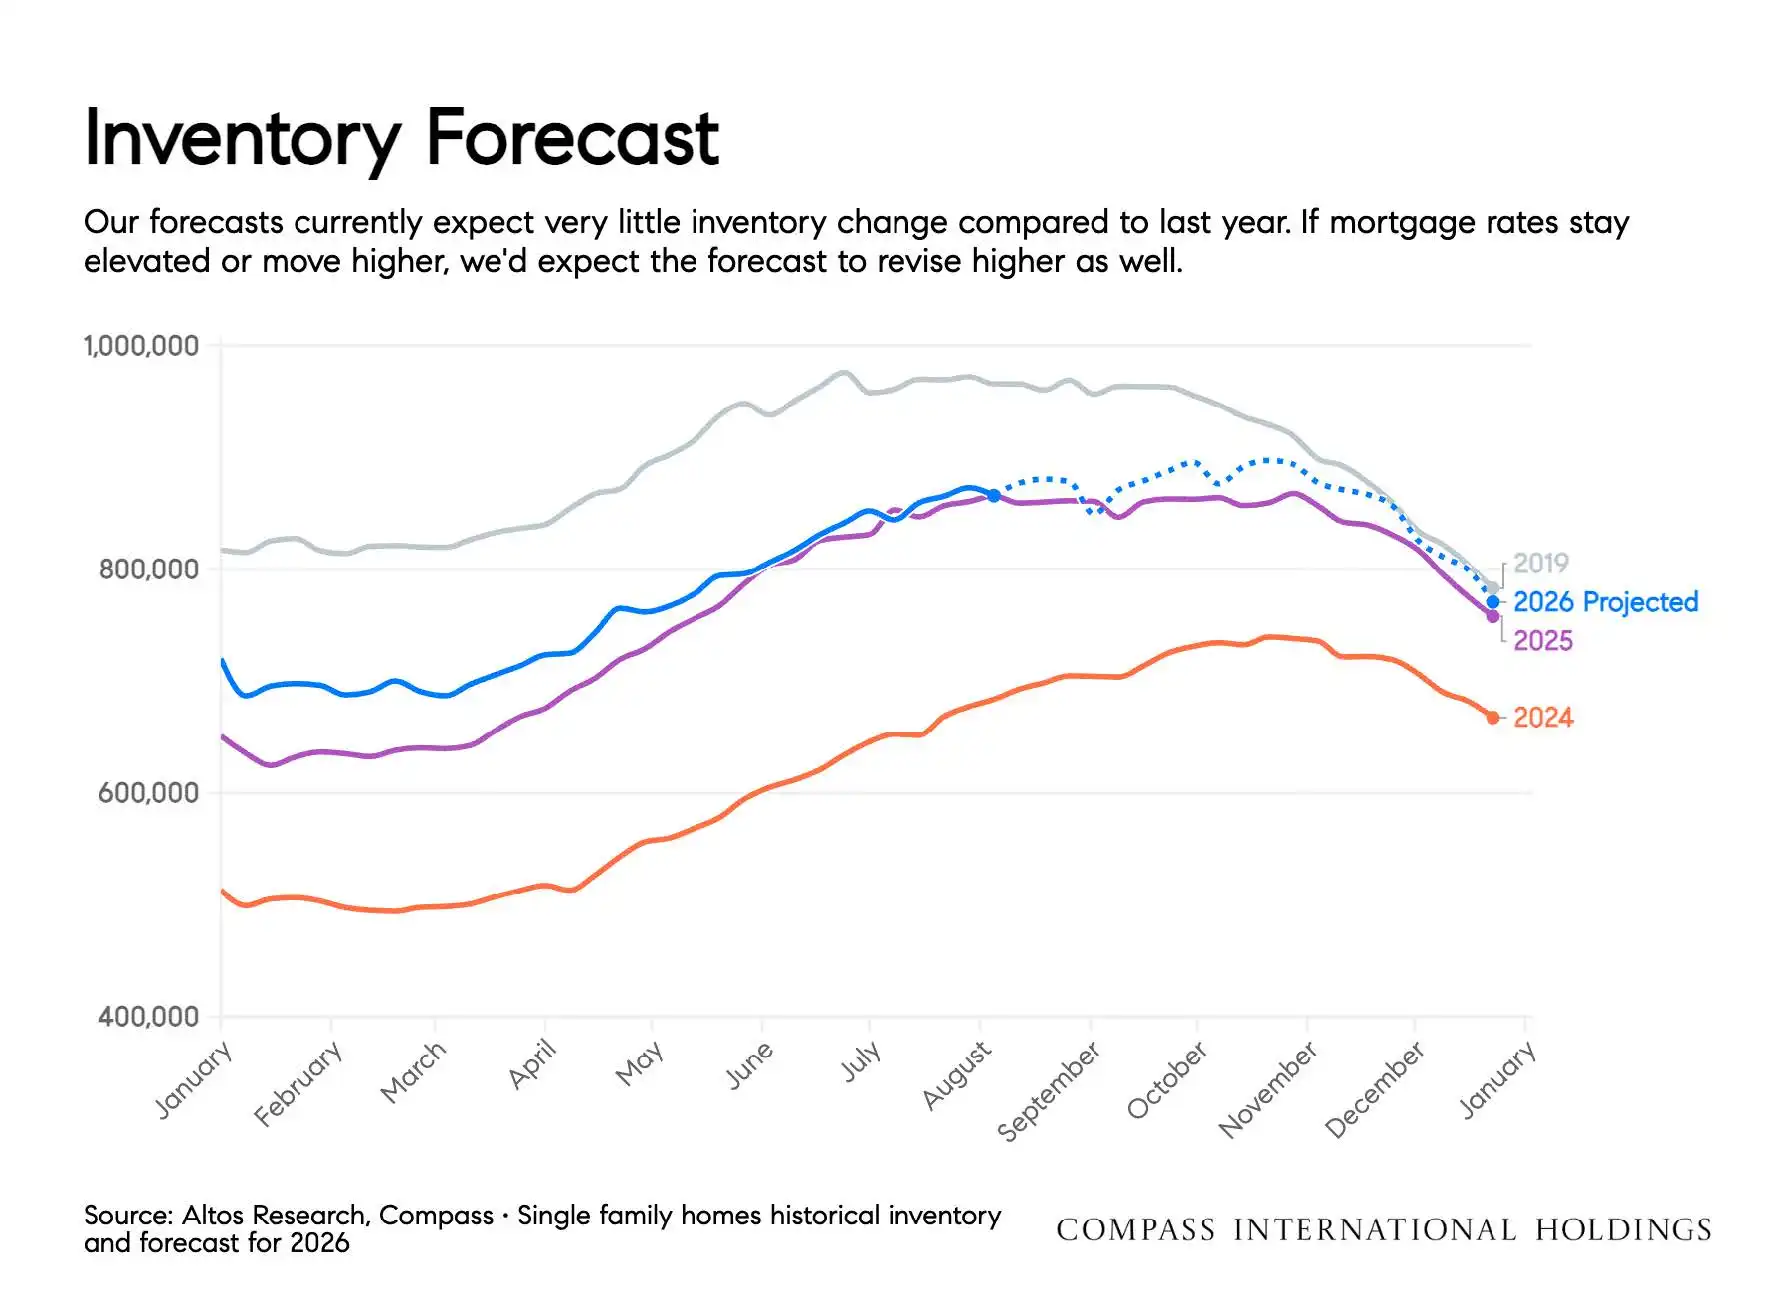
National housing supply was roughly unchanged from 2025 and remained approximately 10% below 2019 levels. The report projects relatively little inventory change through the remainder of 2026, although a prolonged period of higher mortgage rates could lead to somewhat more available supply. Many existing homeowners remain reluctant to sell because they still hold mortgages well below current rates, which continues to restrict normal turnover.
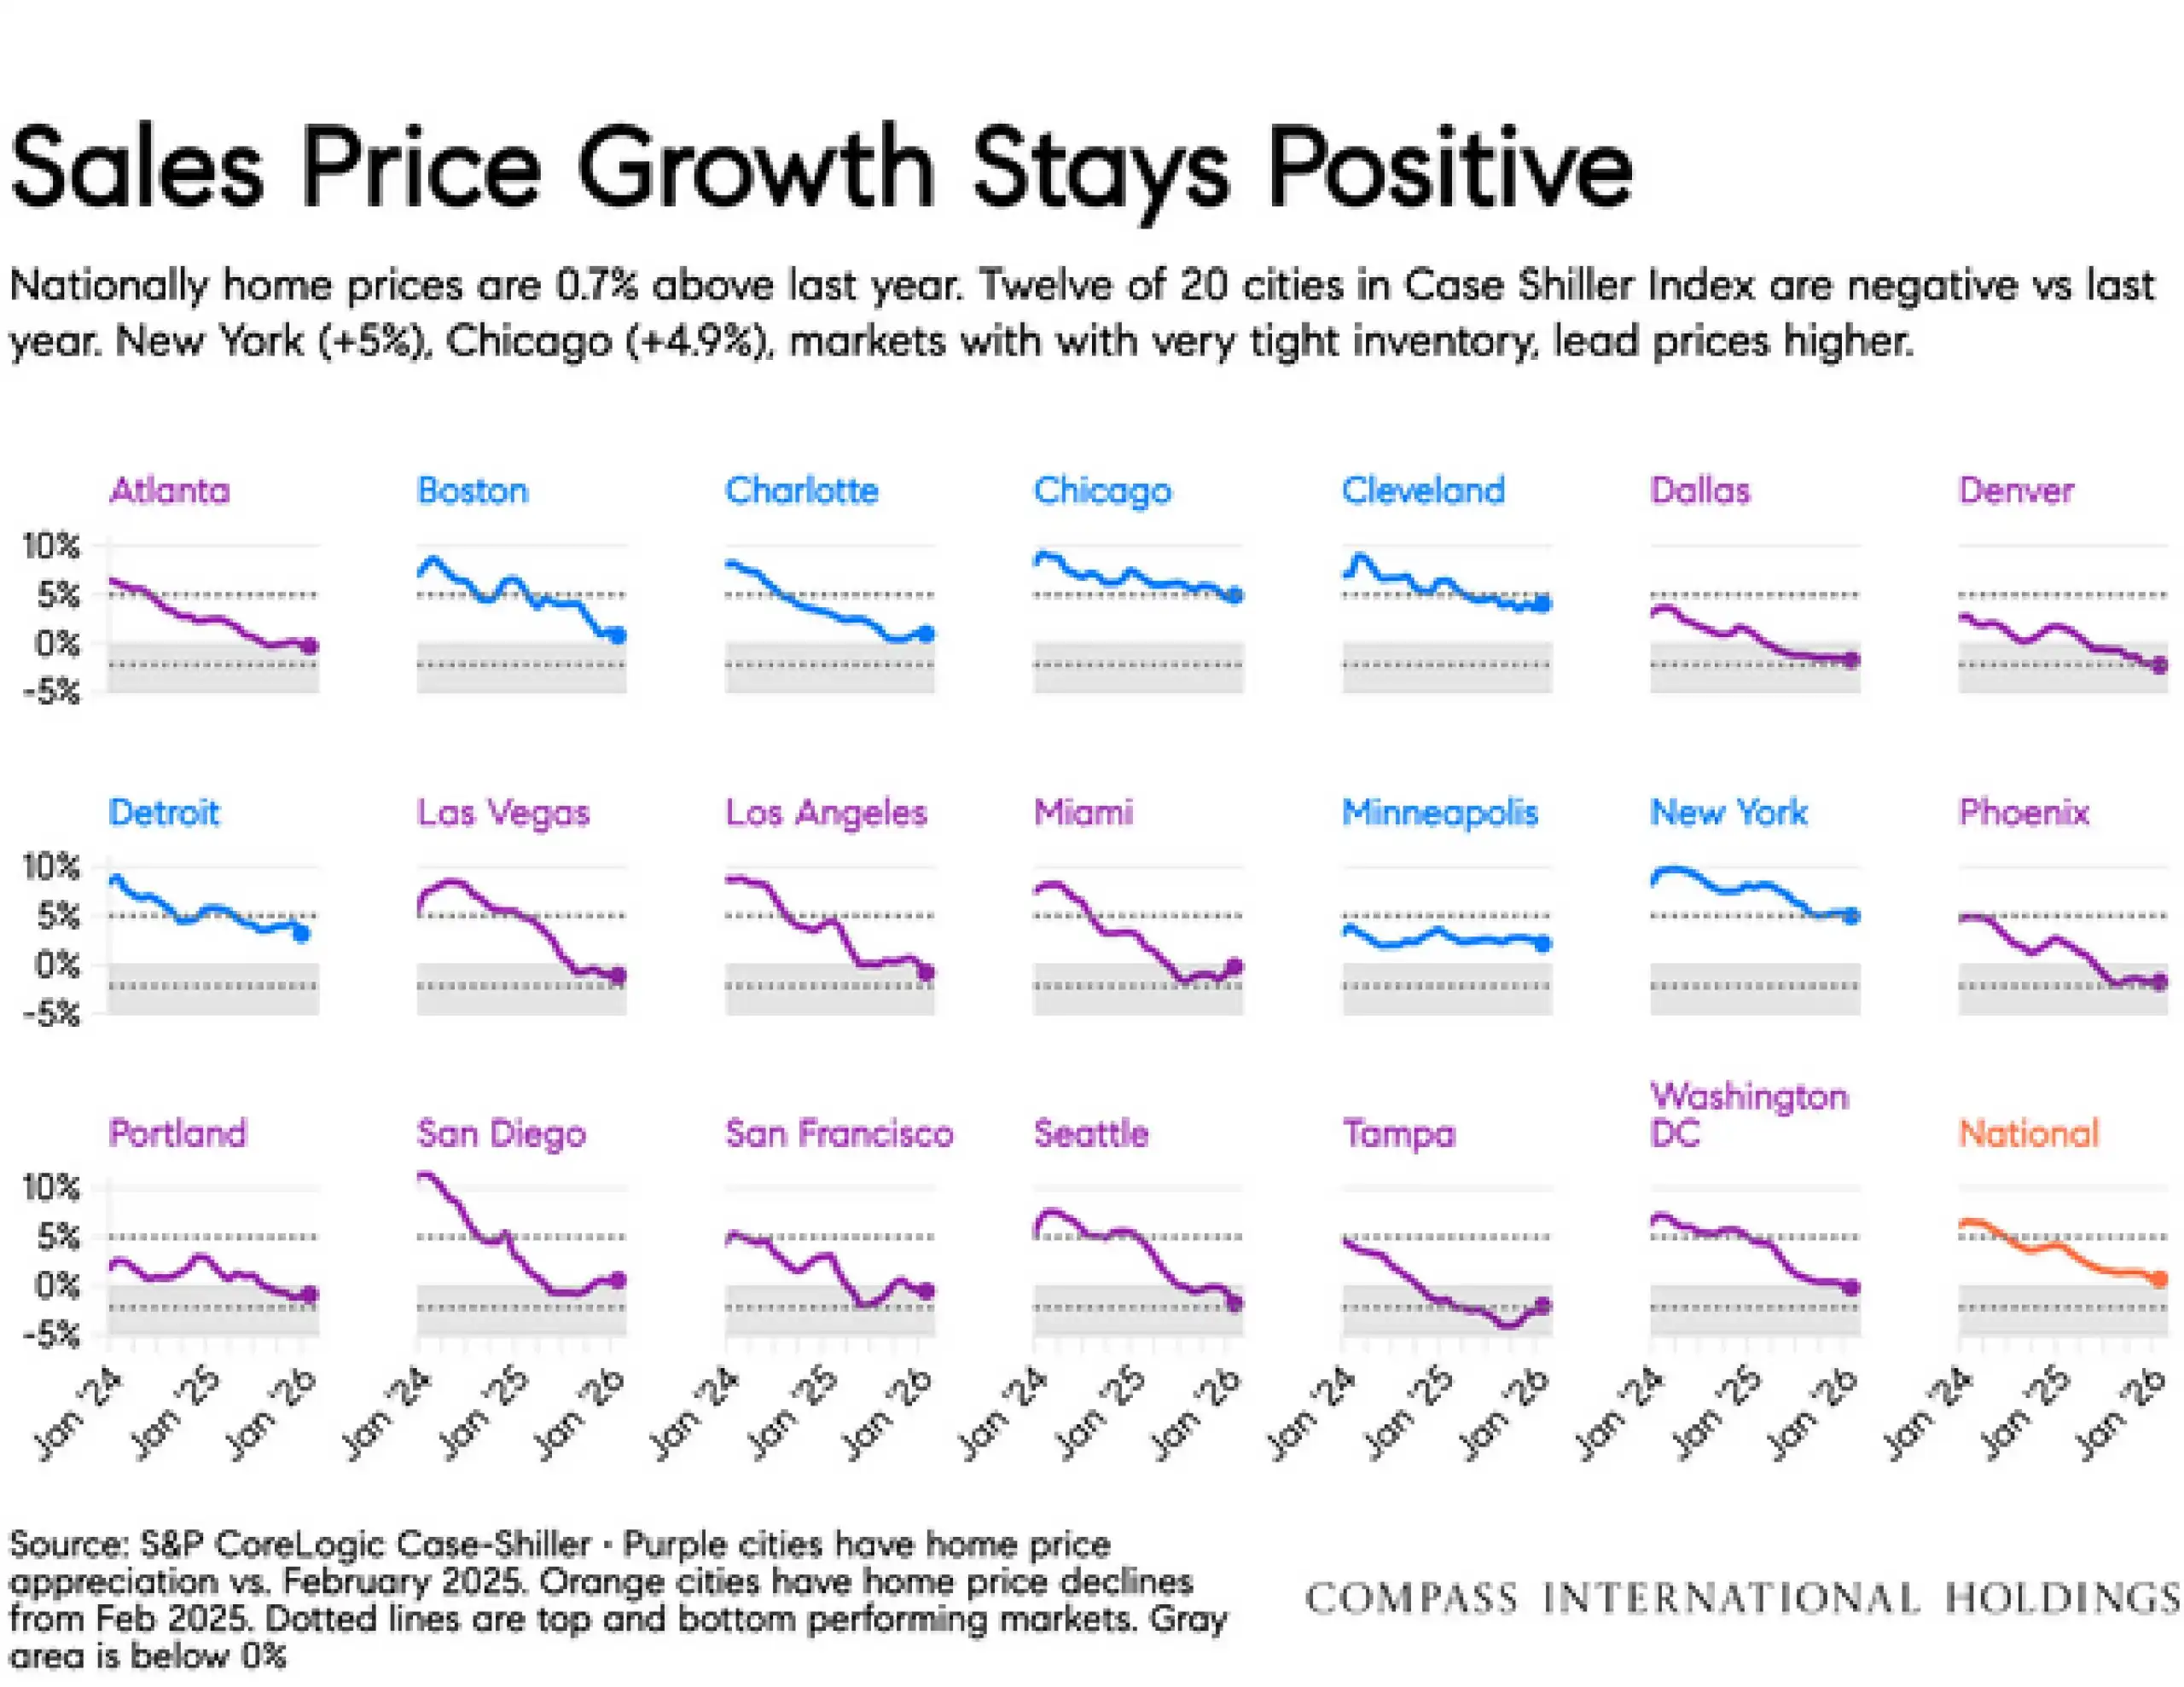
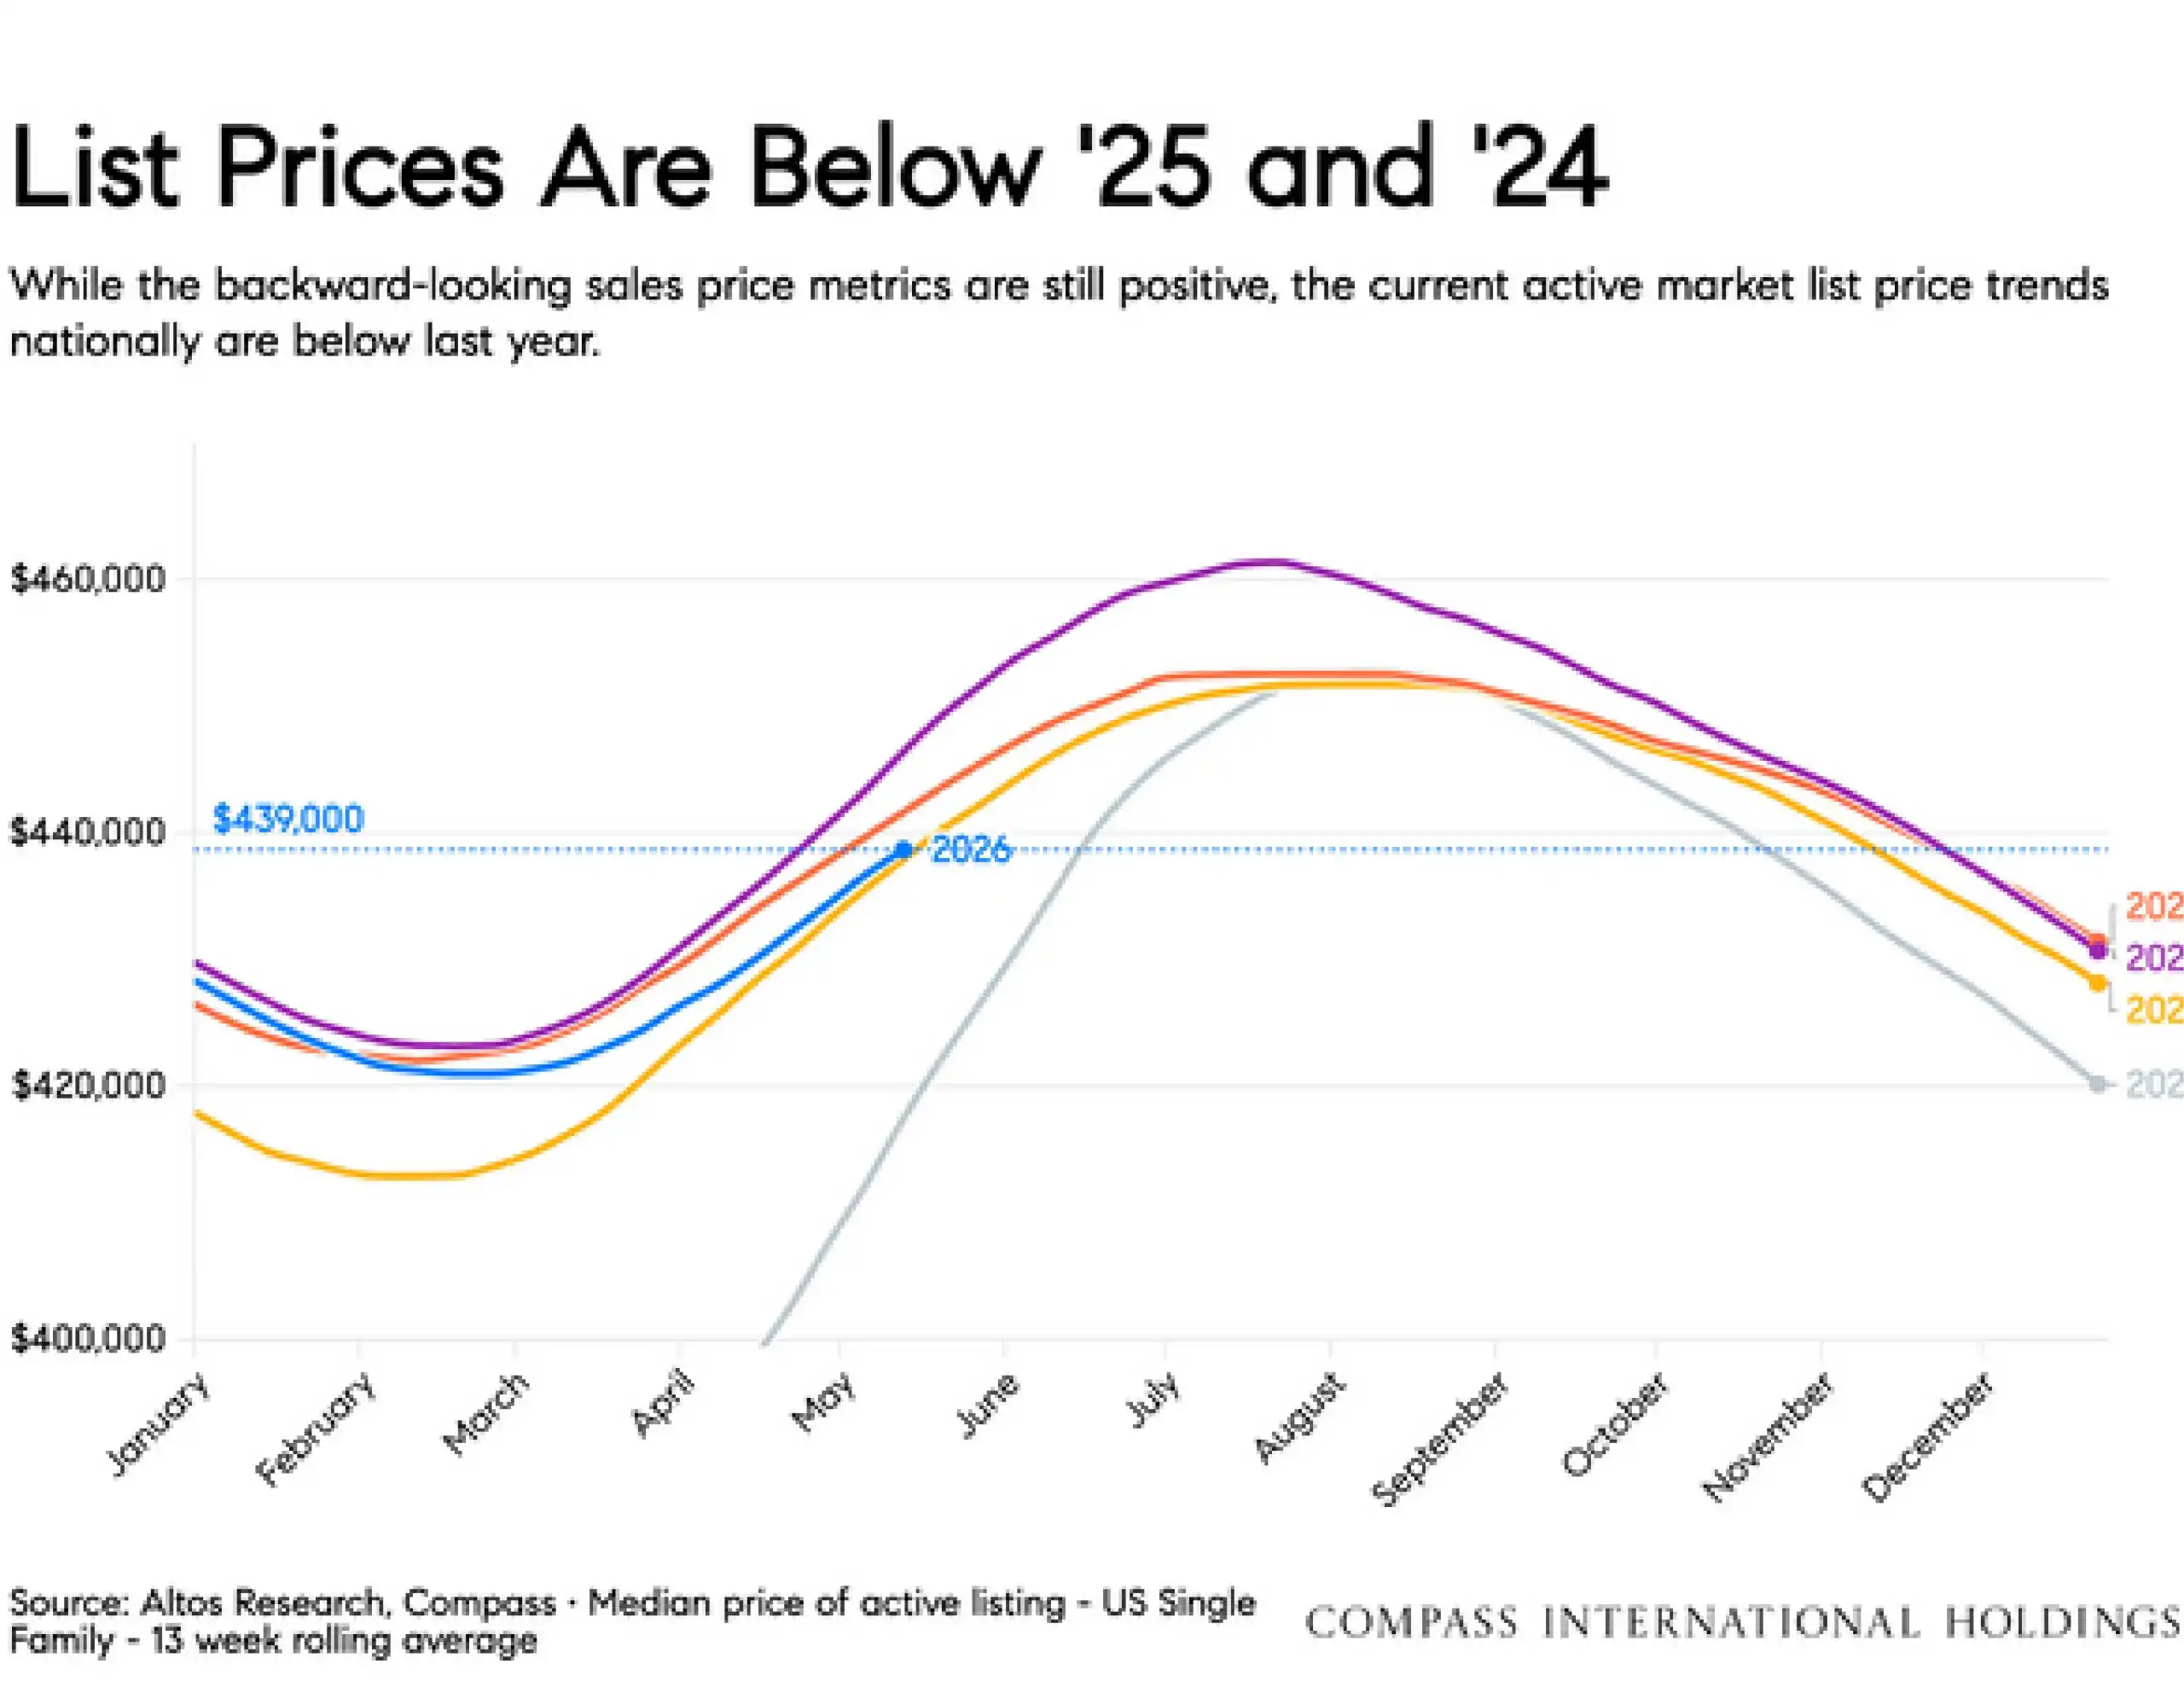
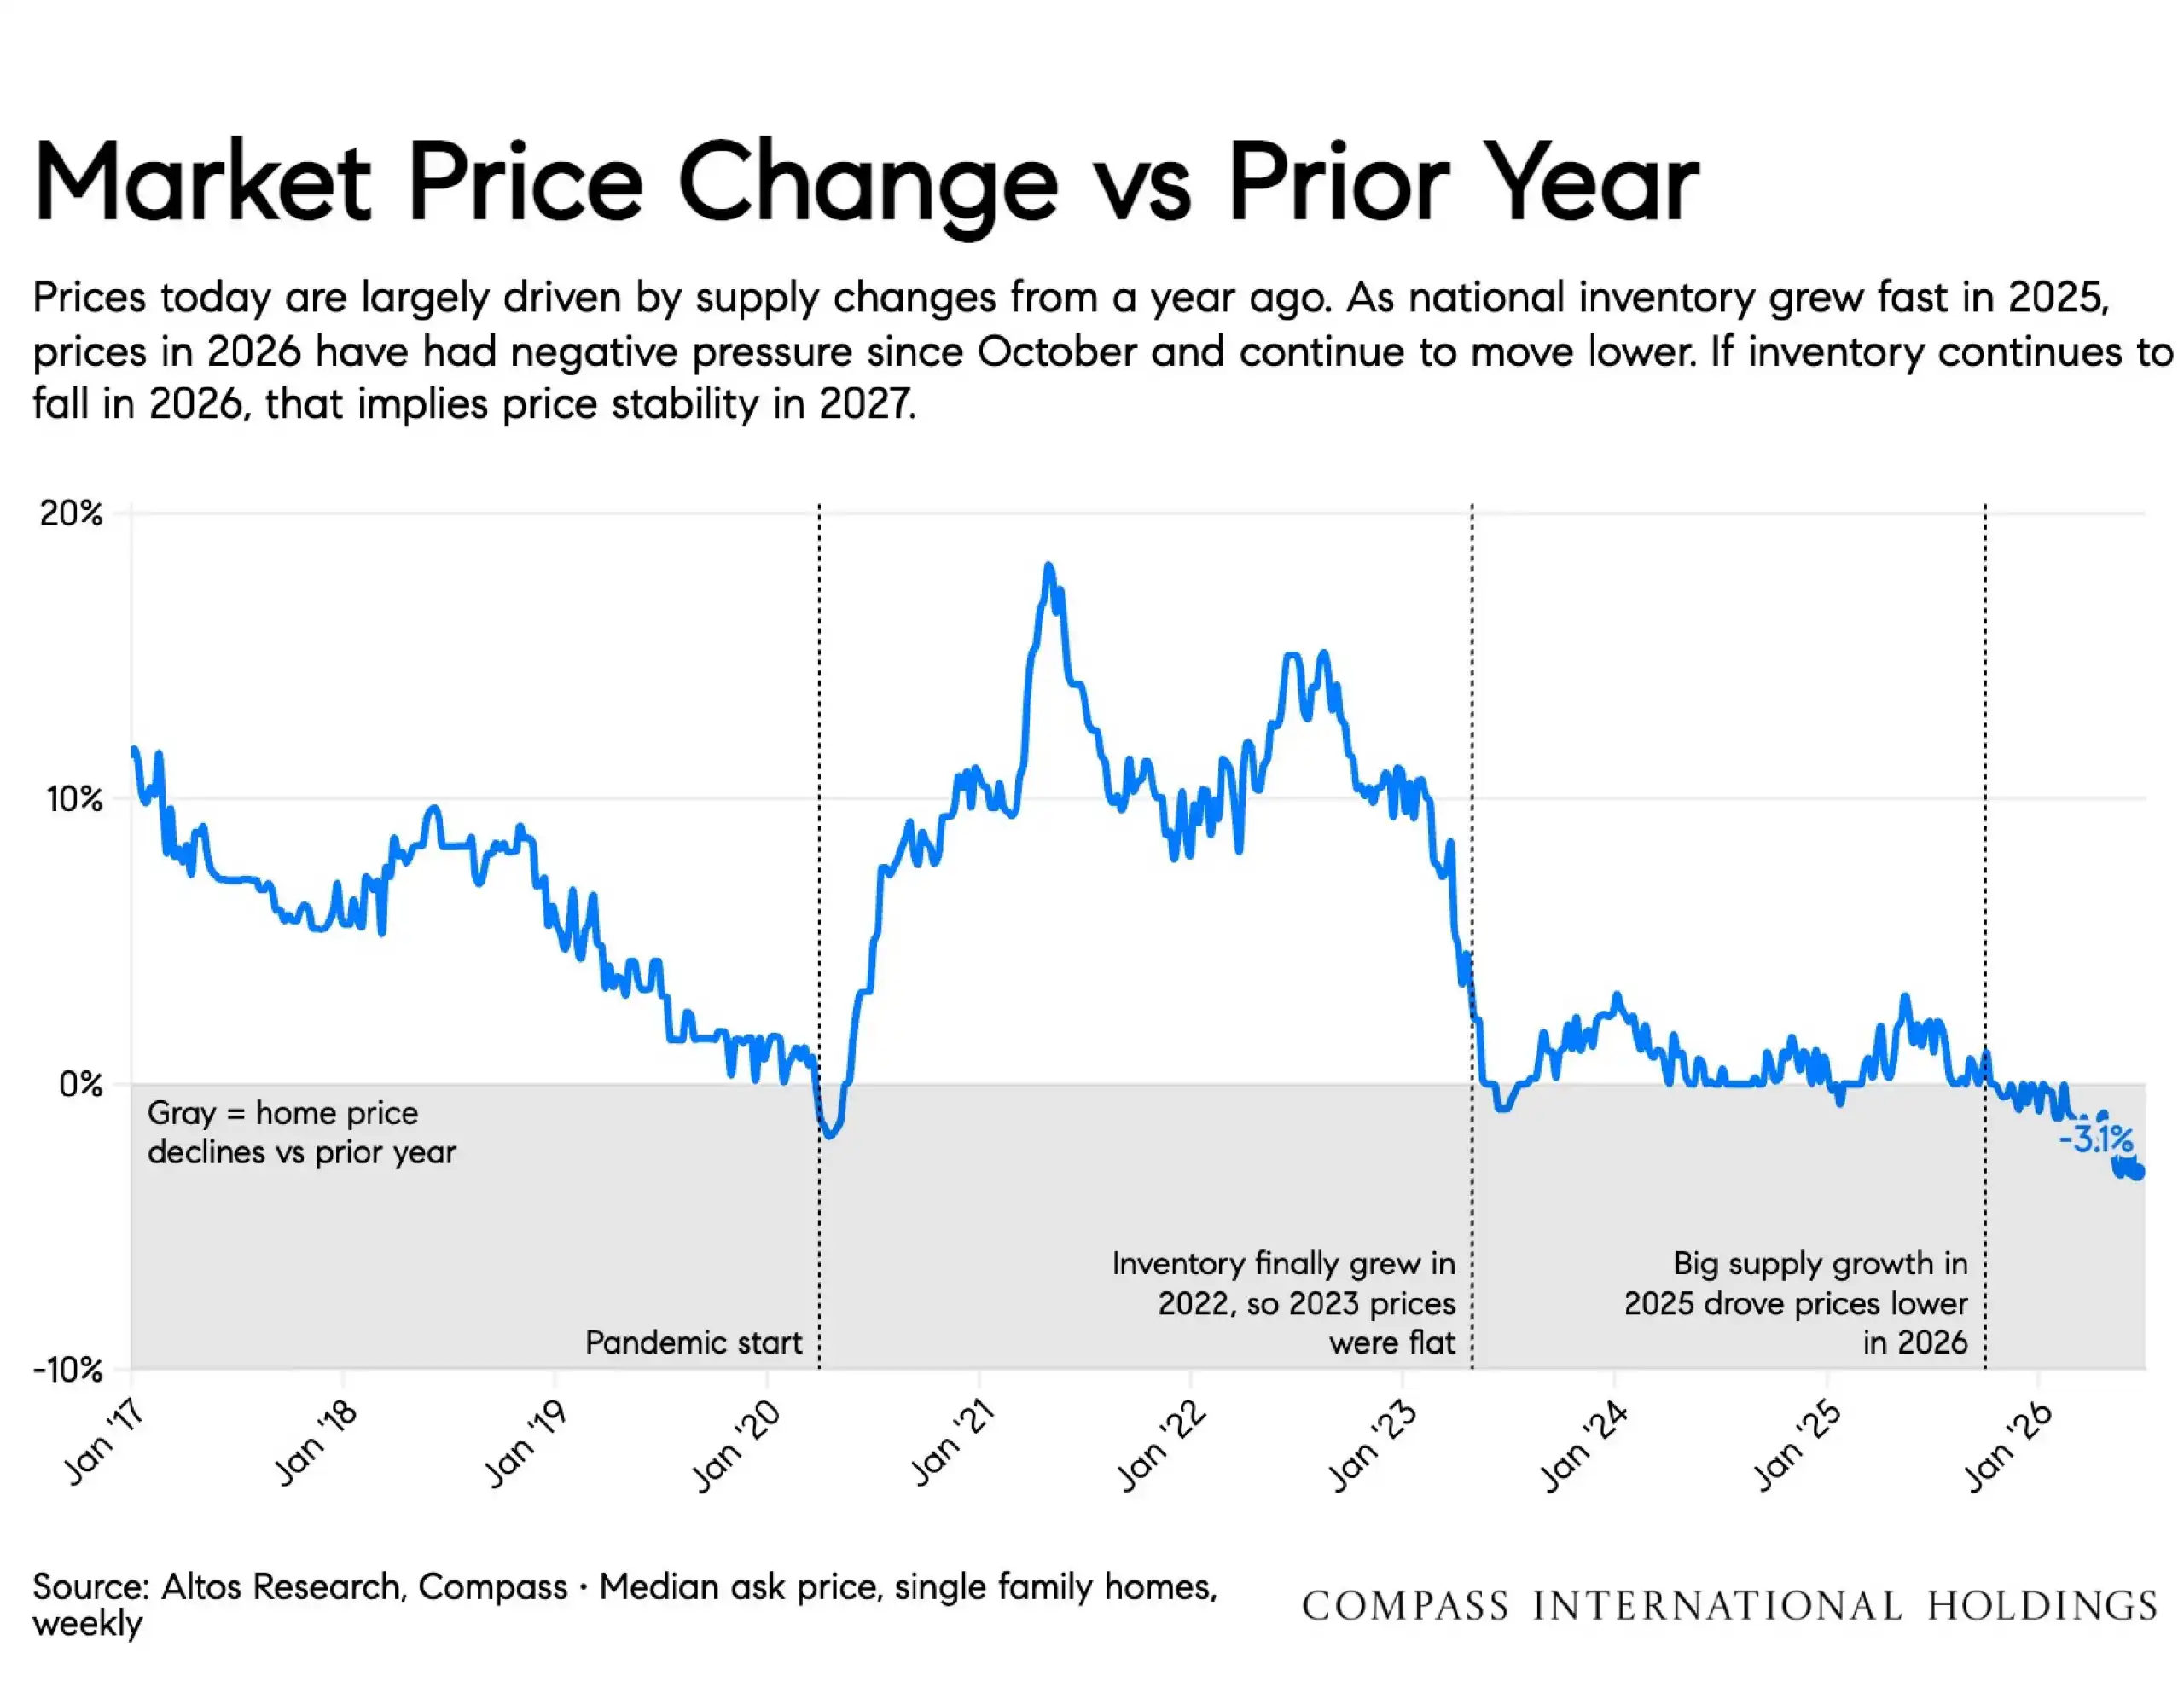
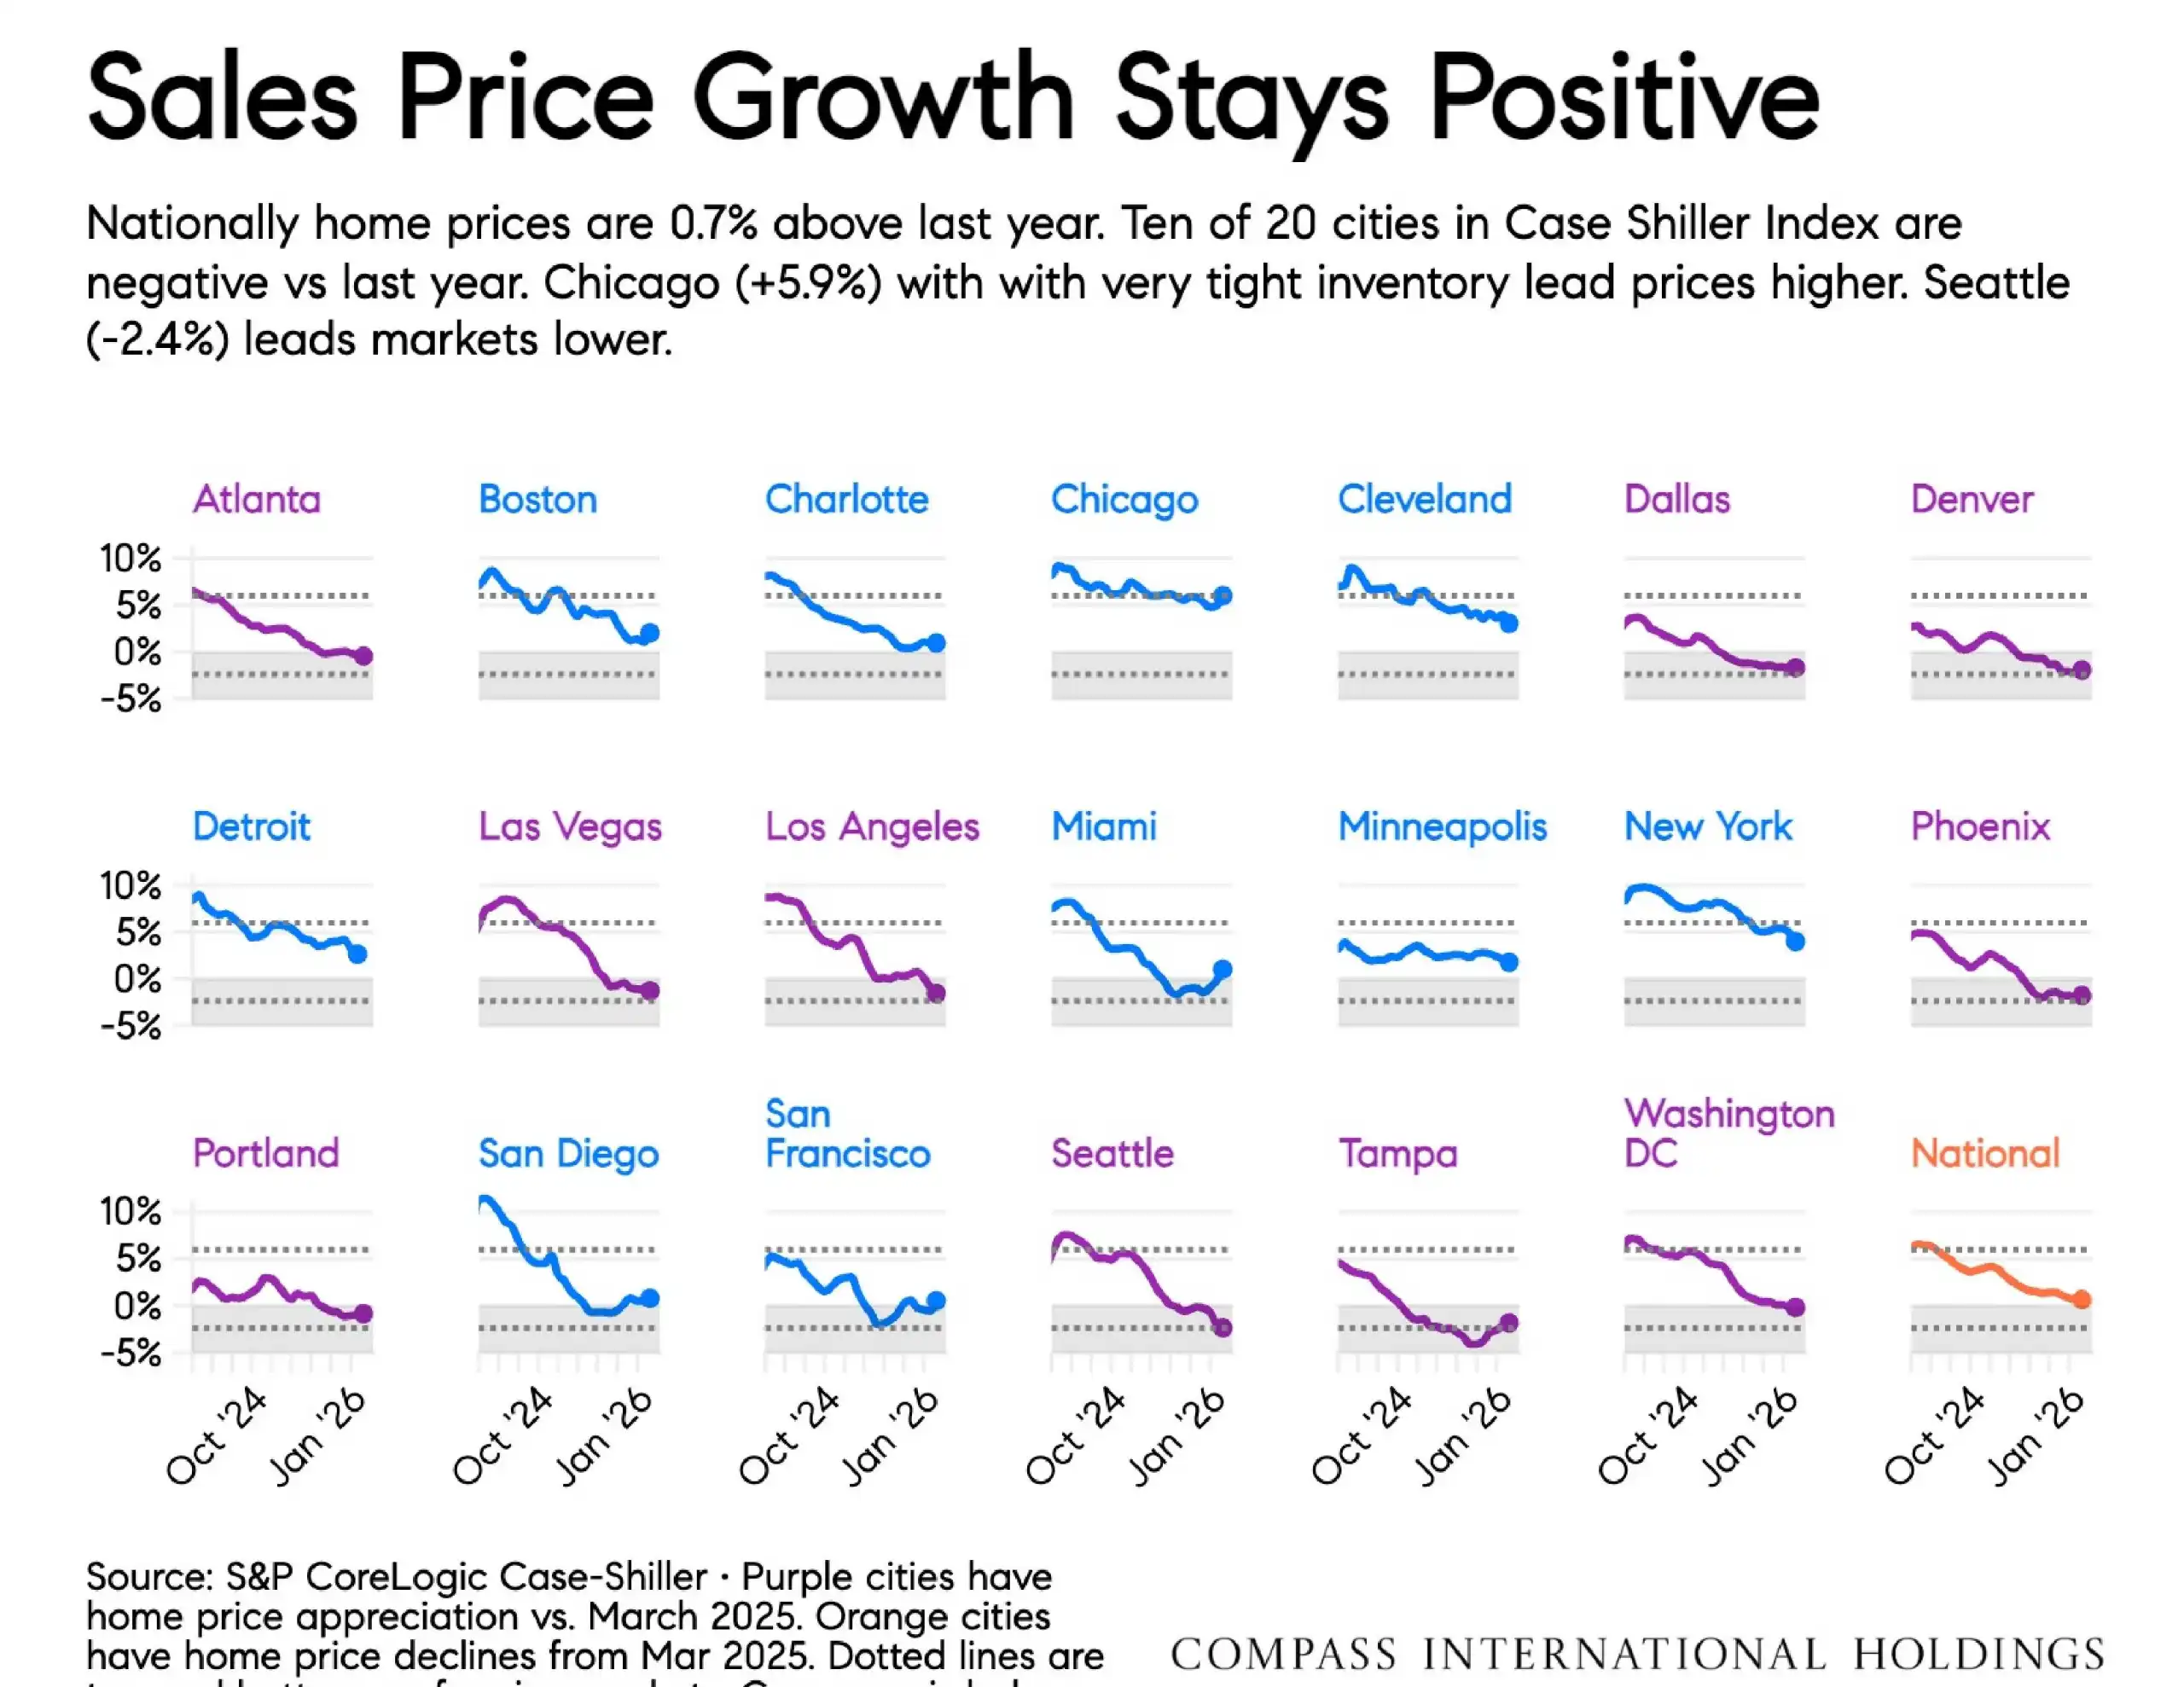
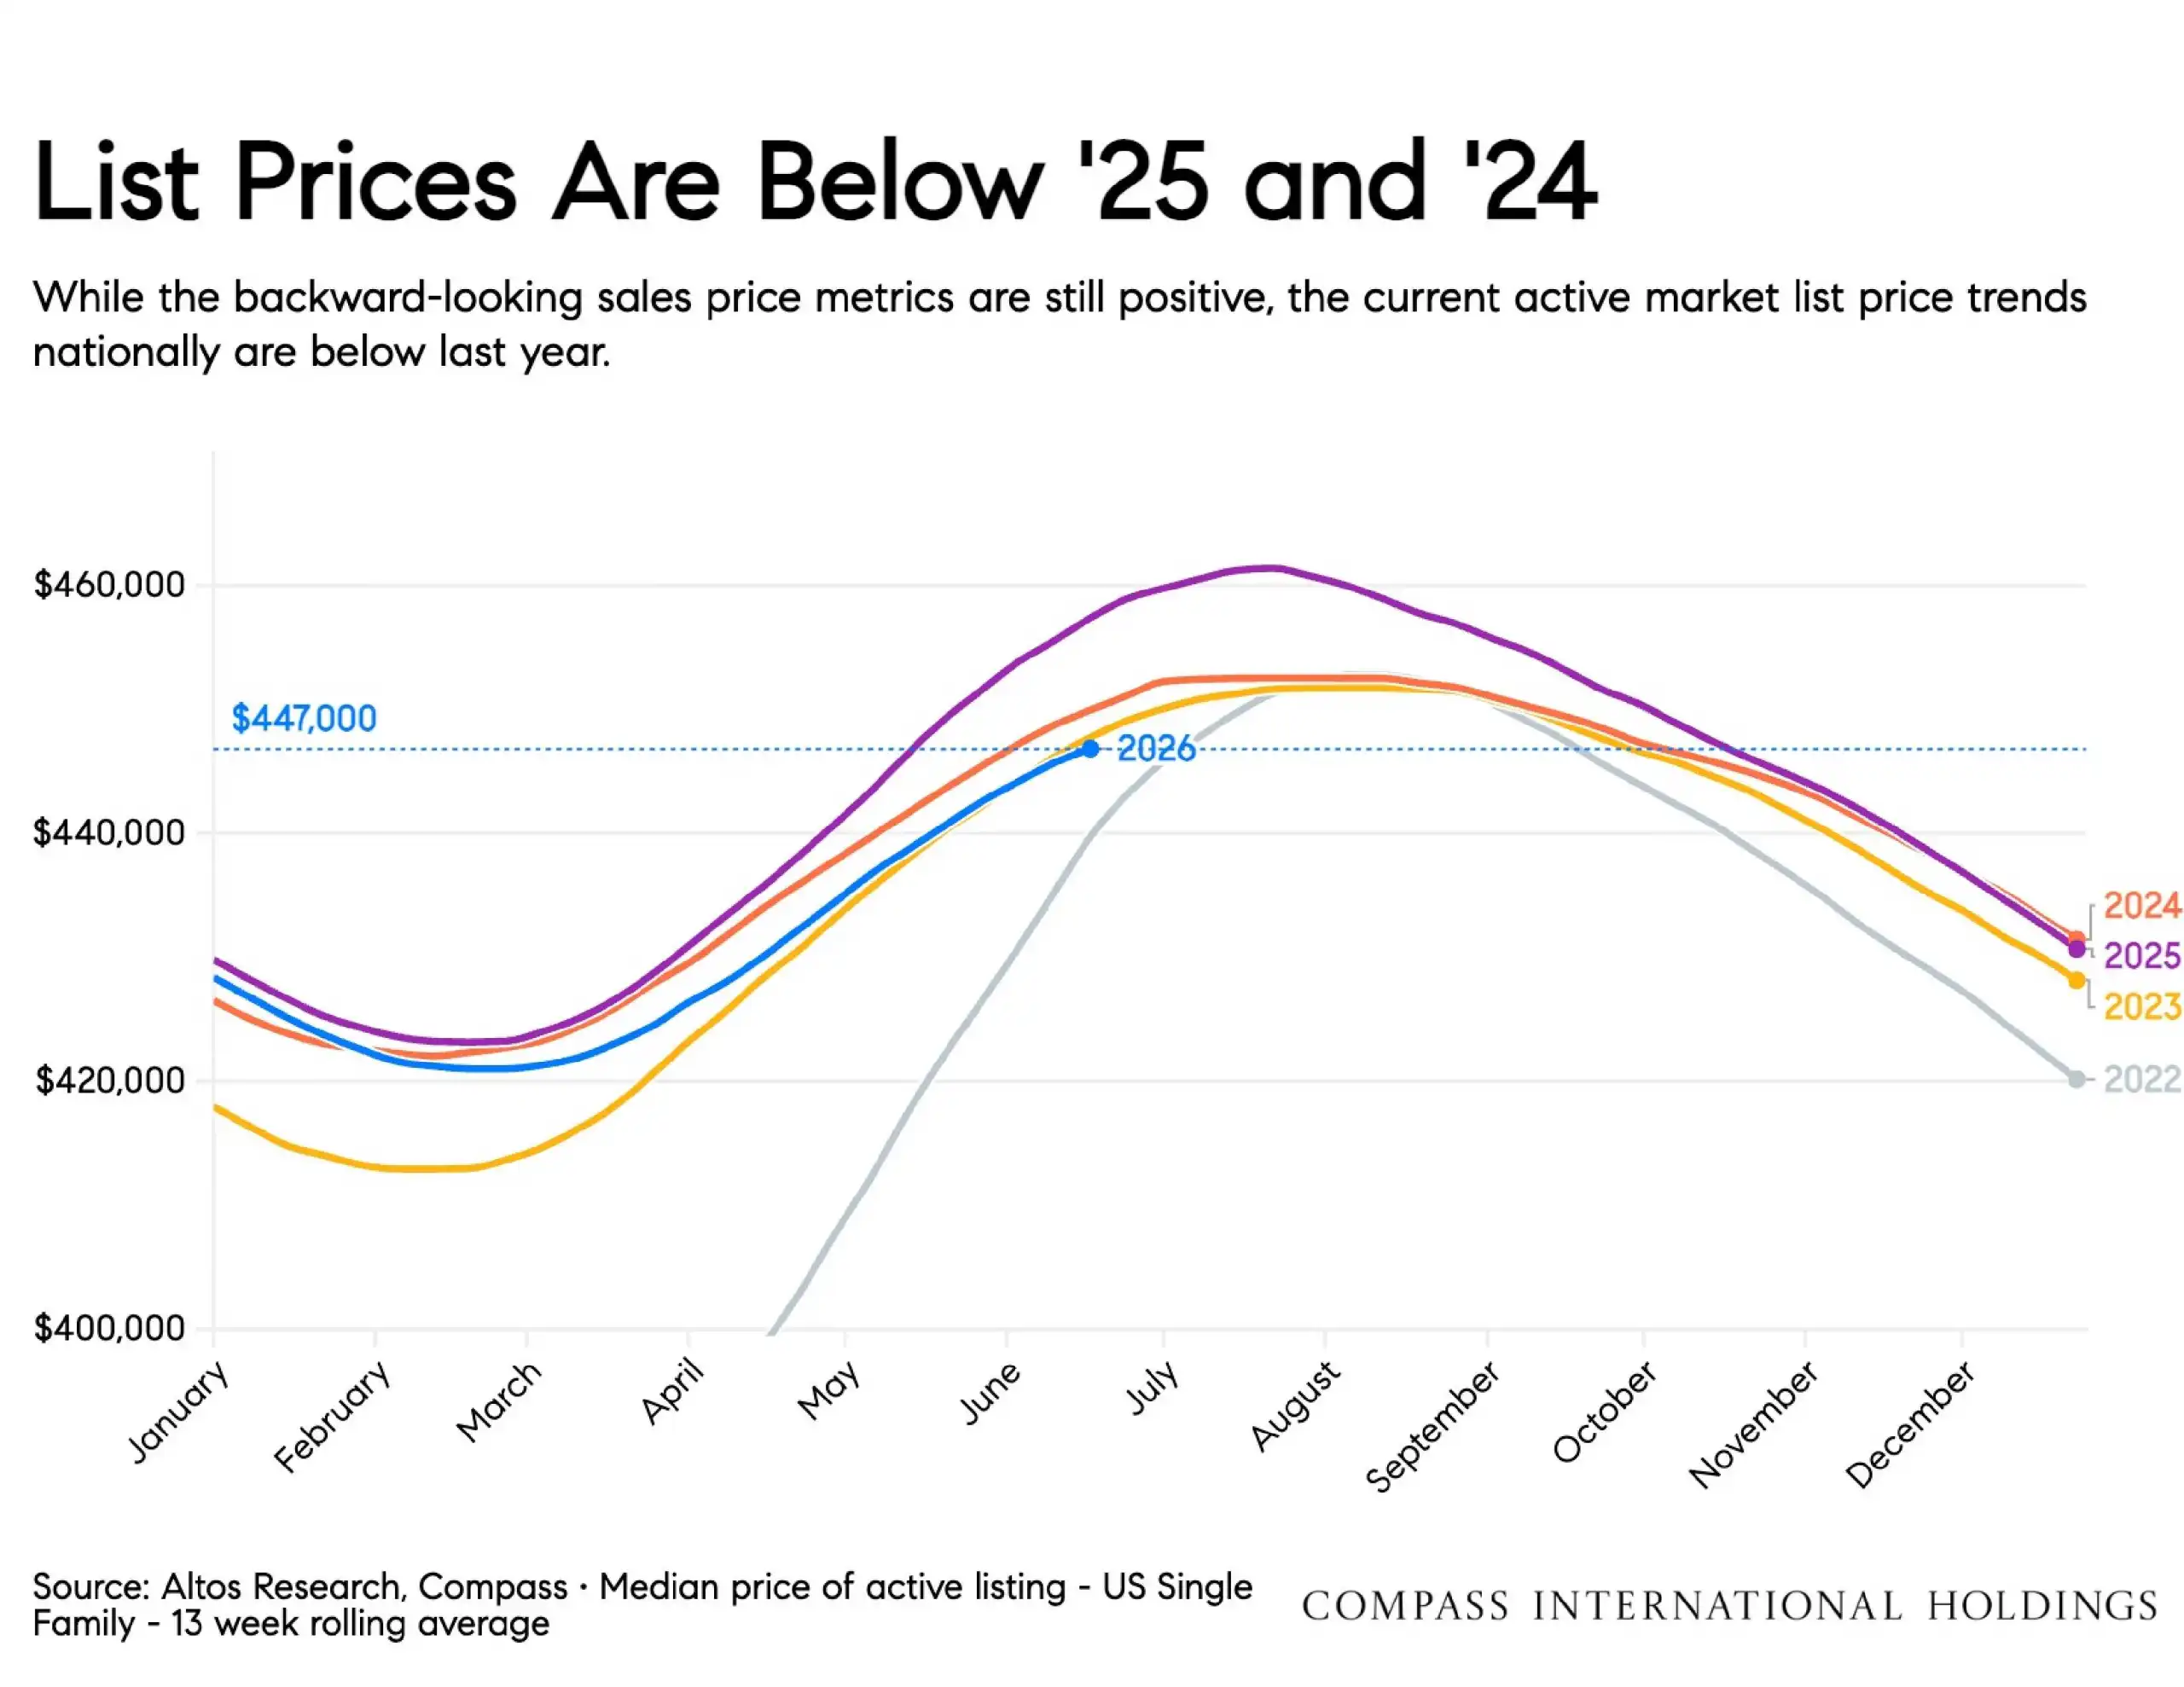
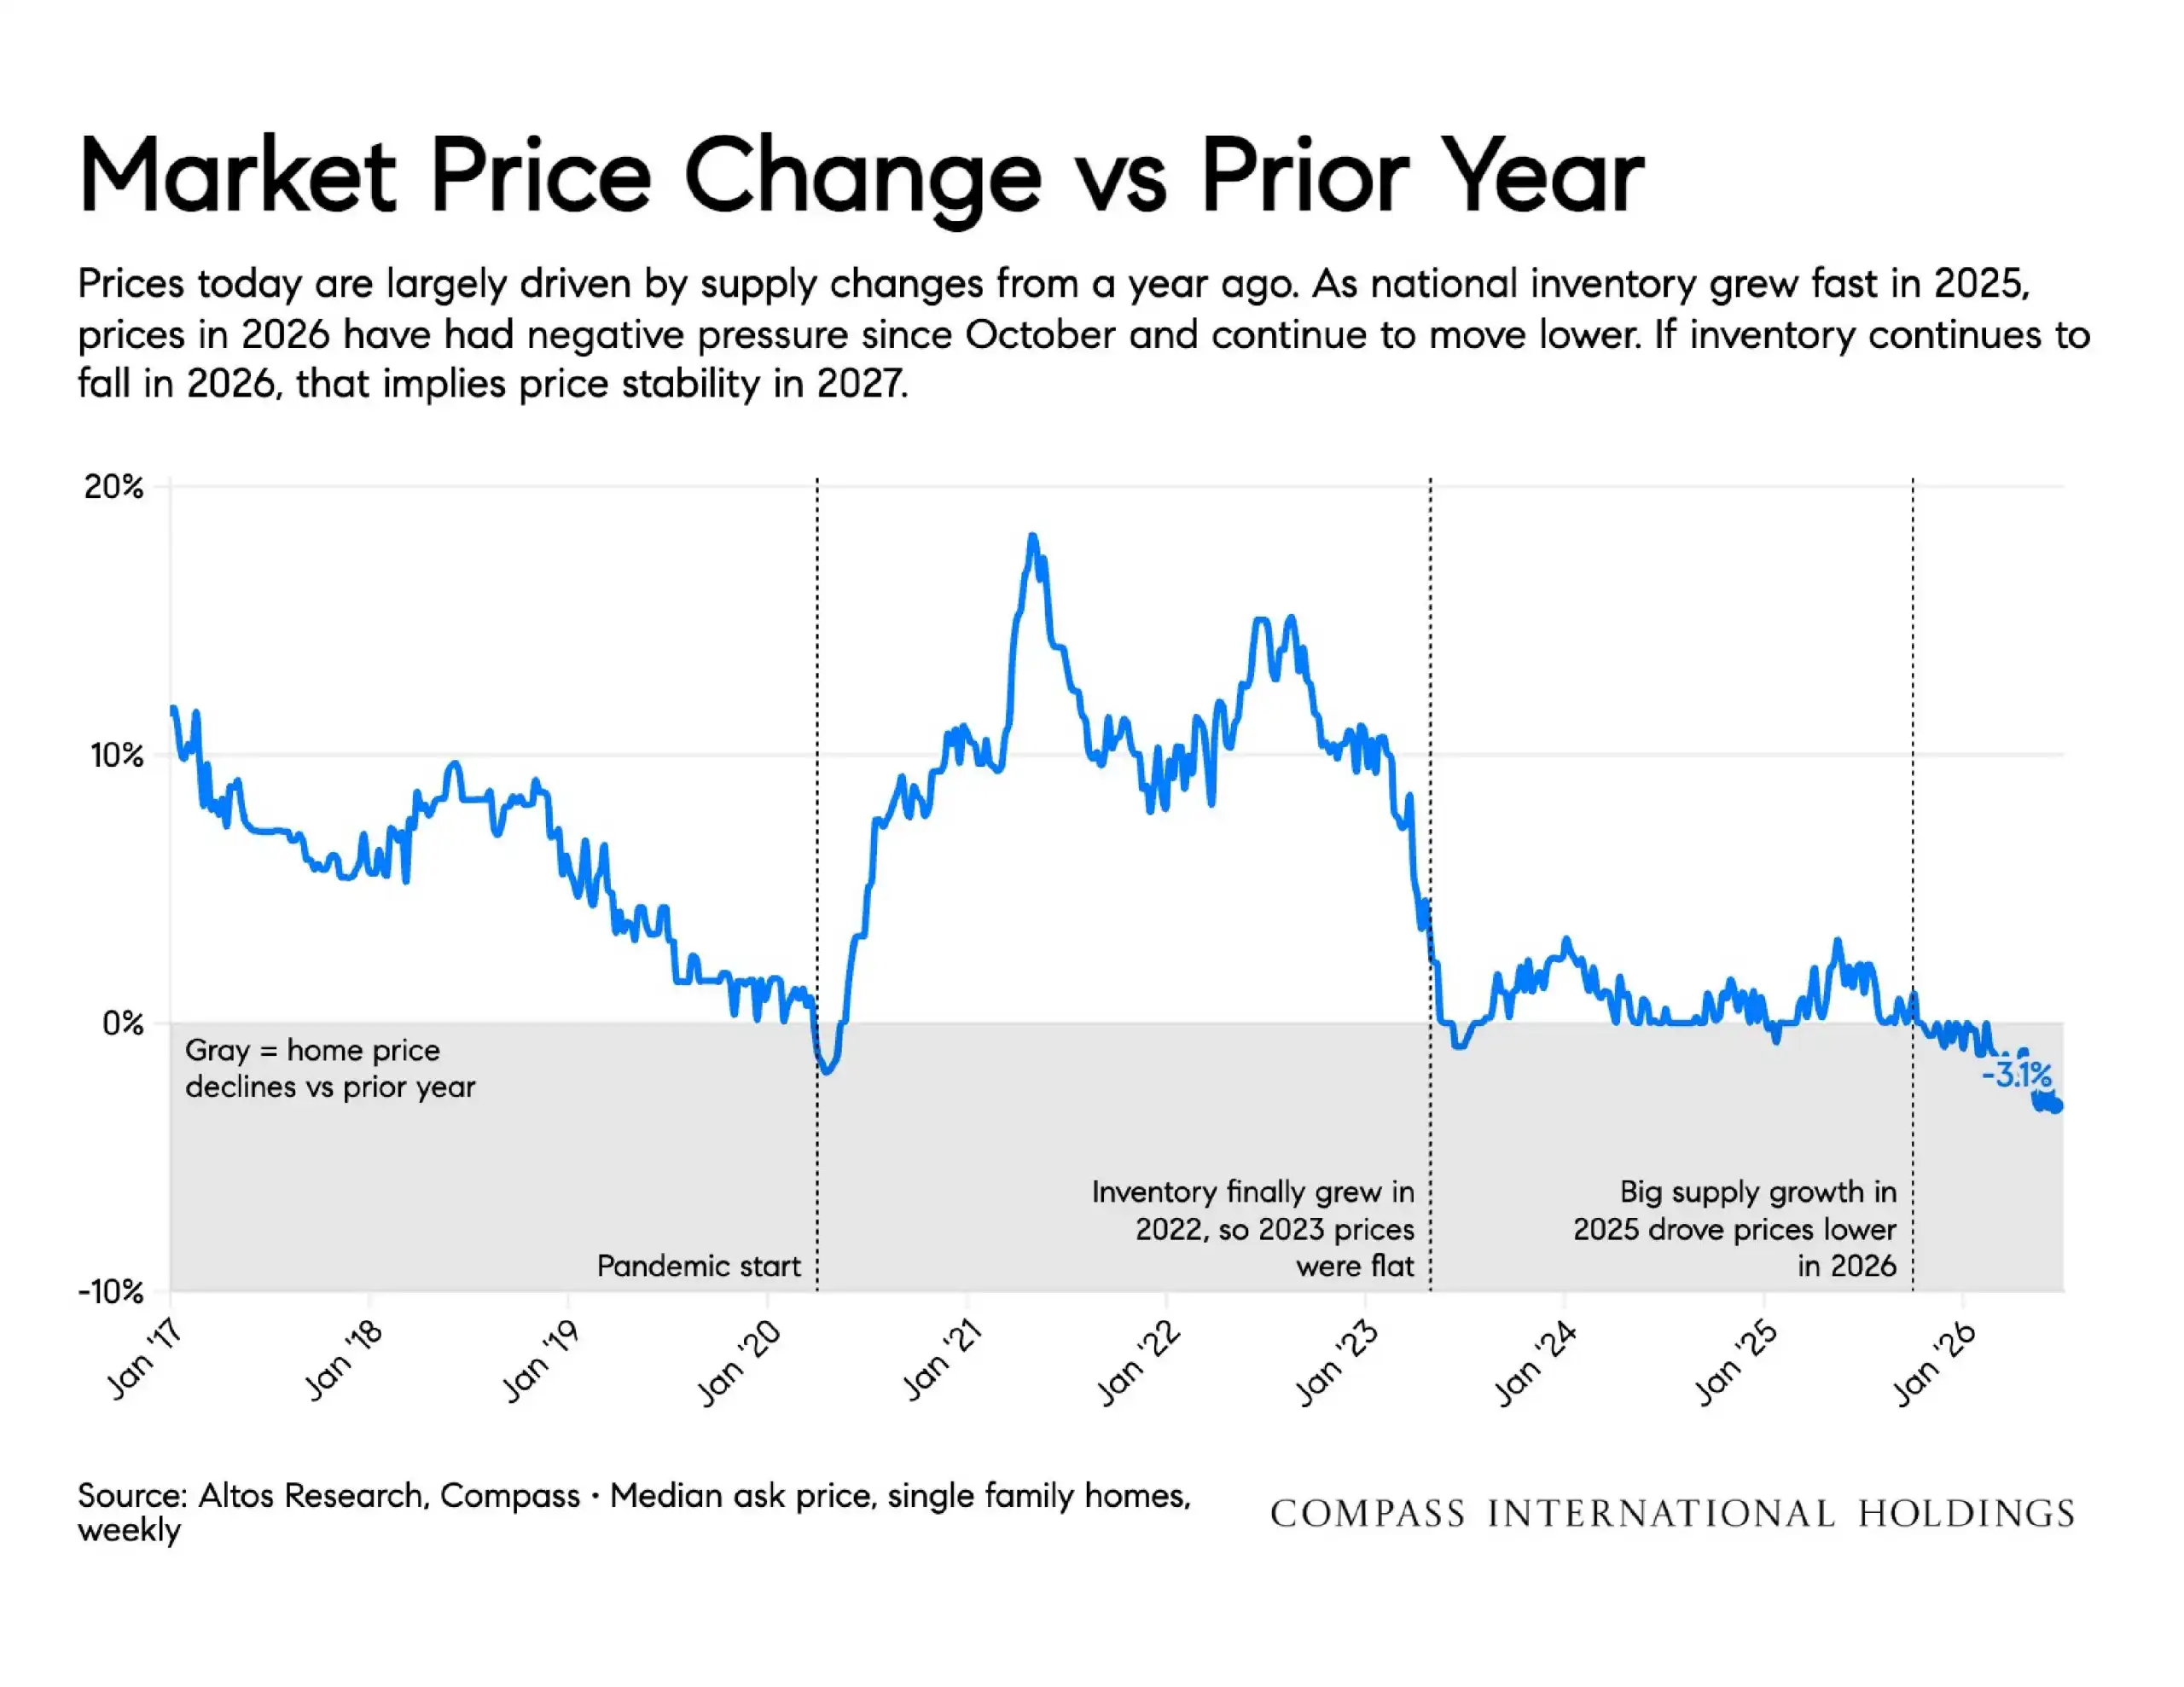
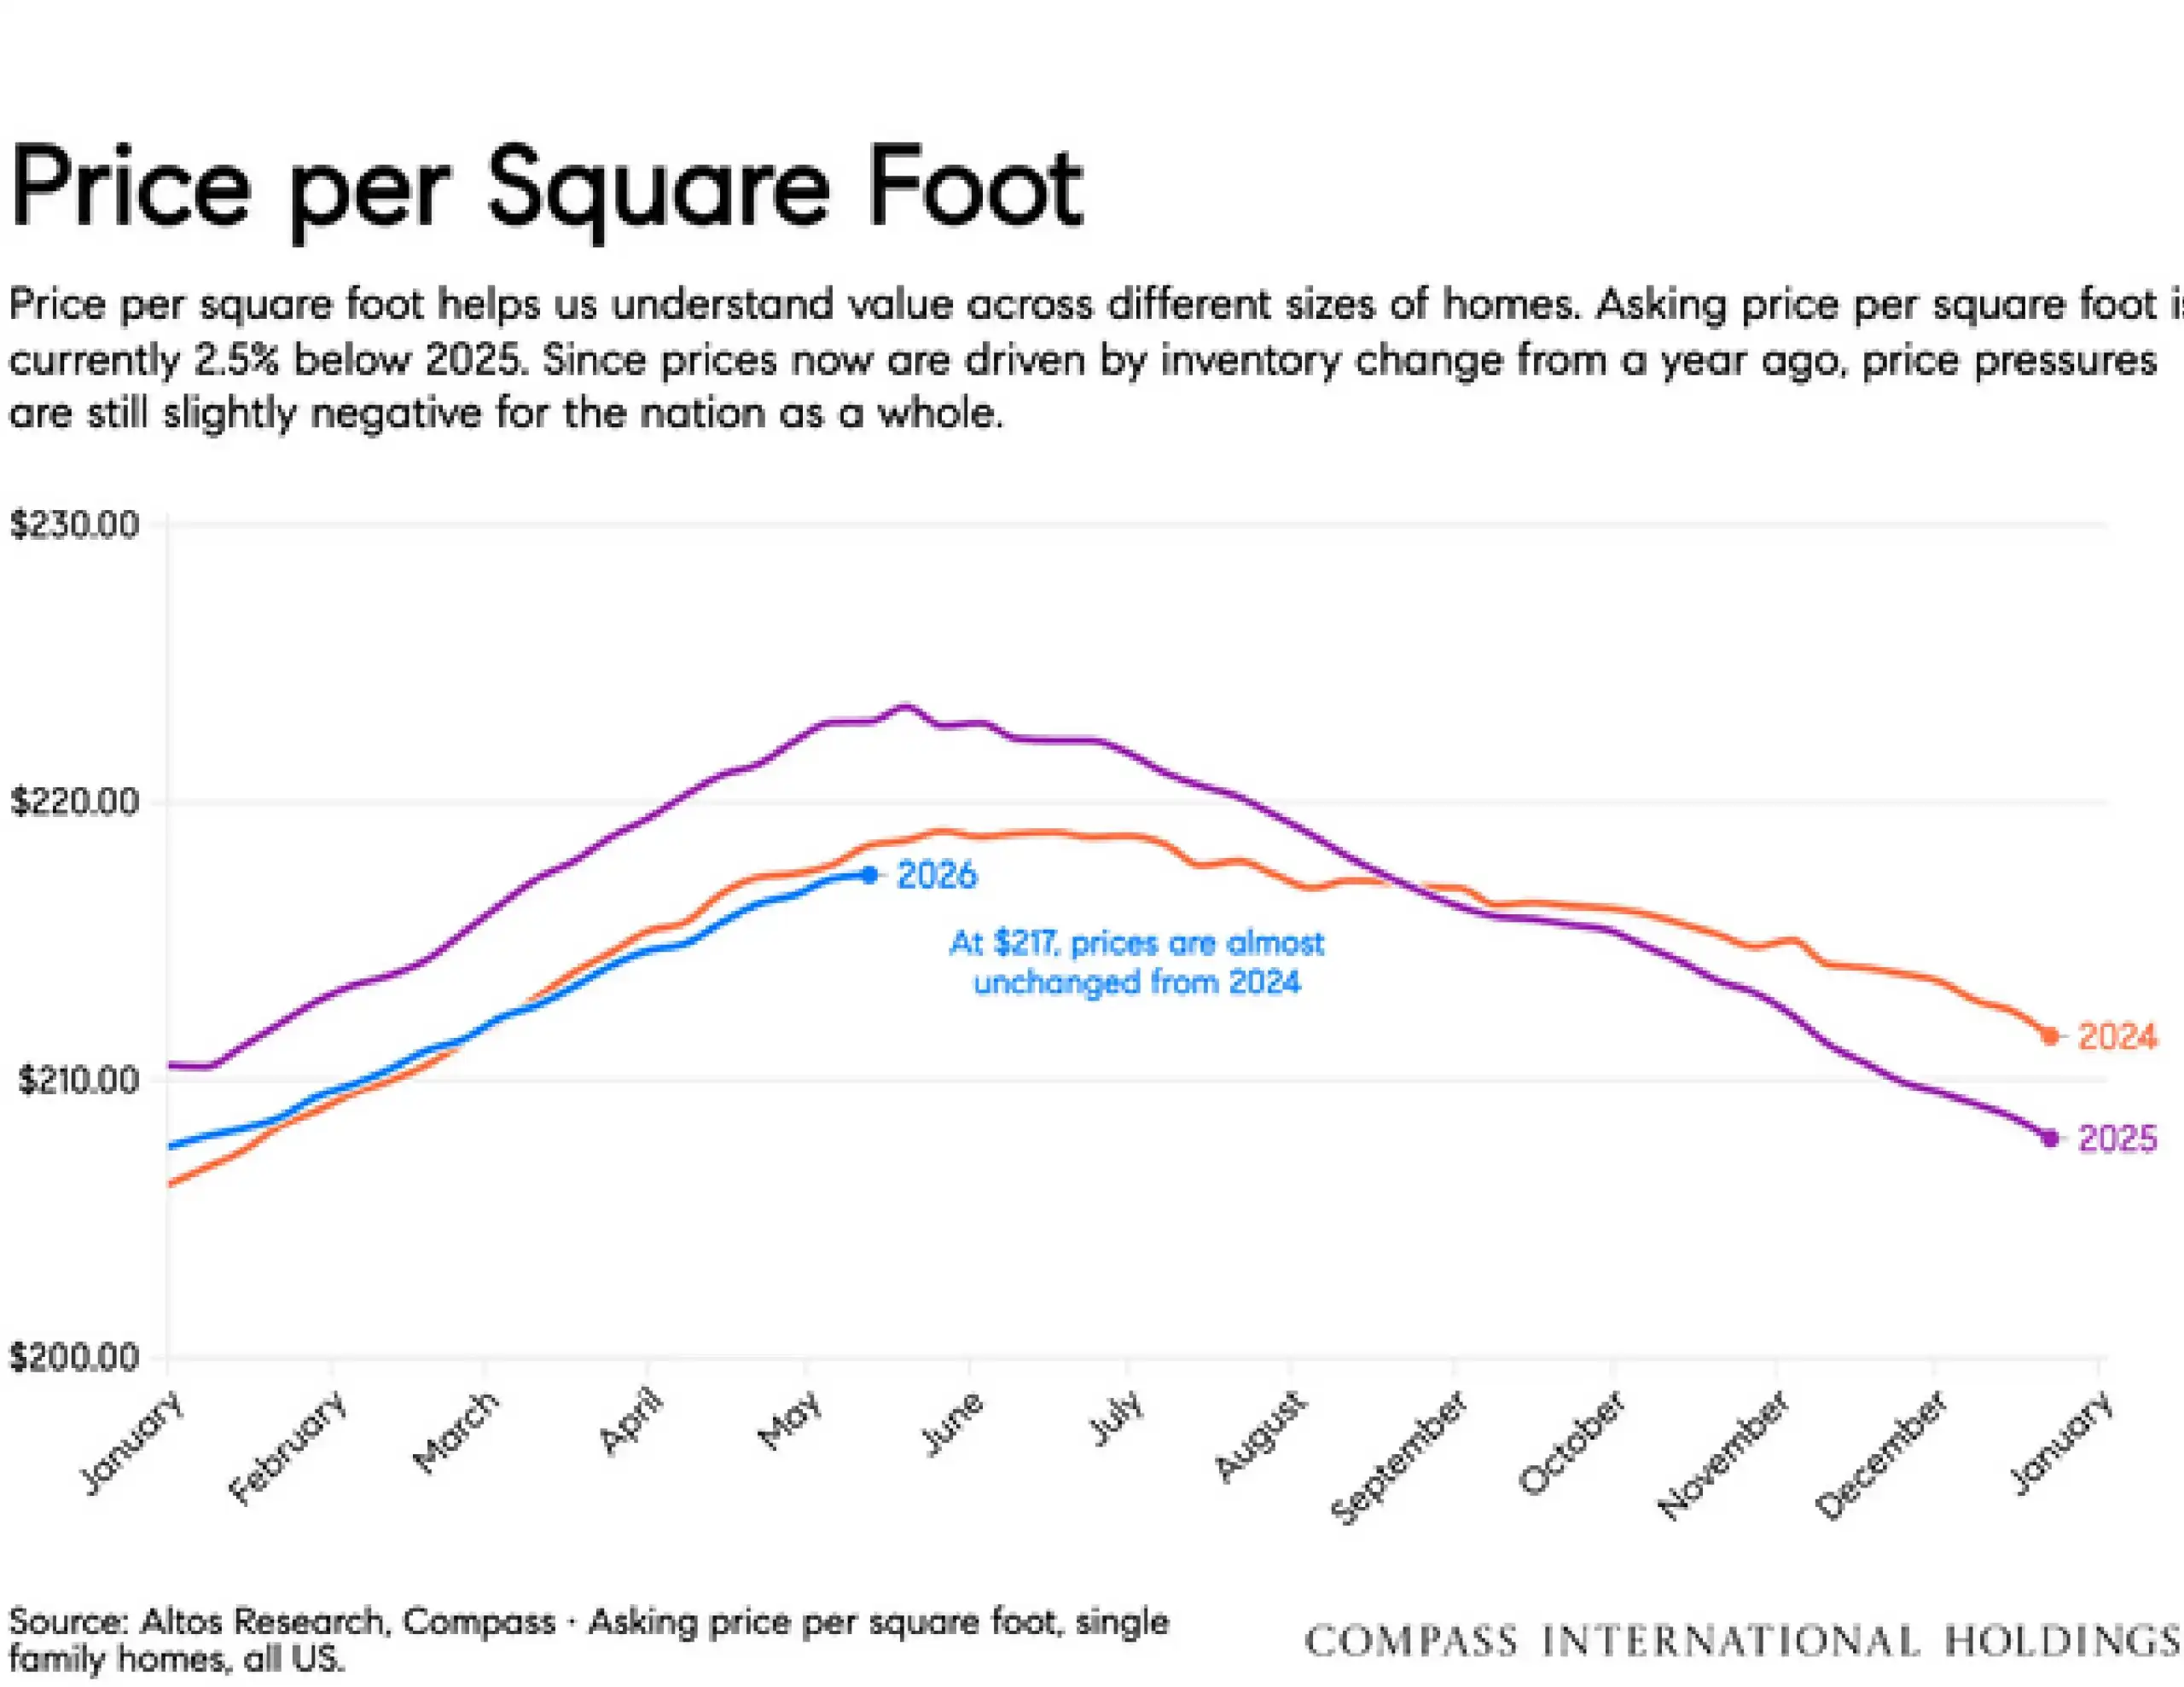
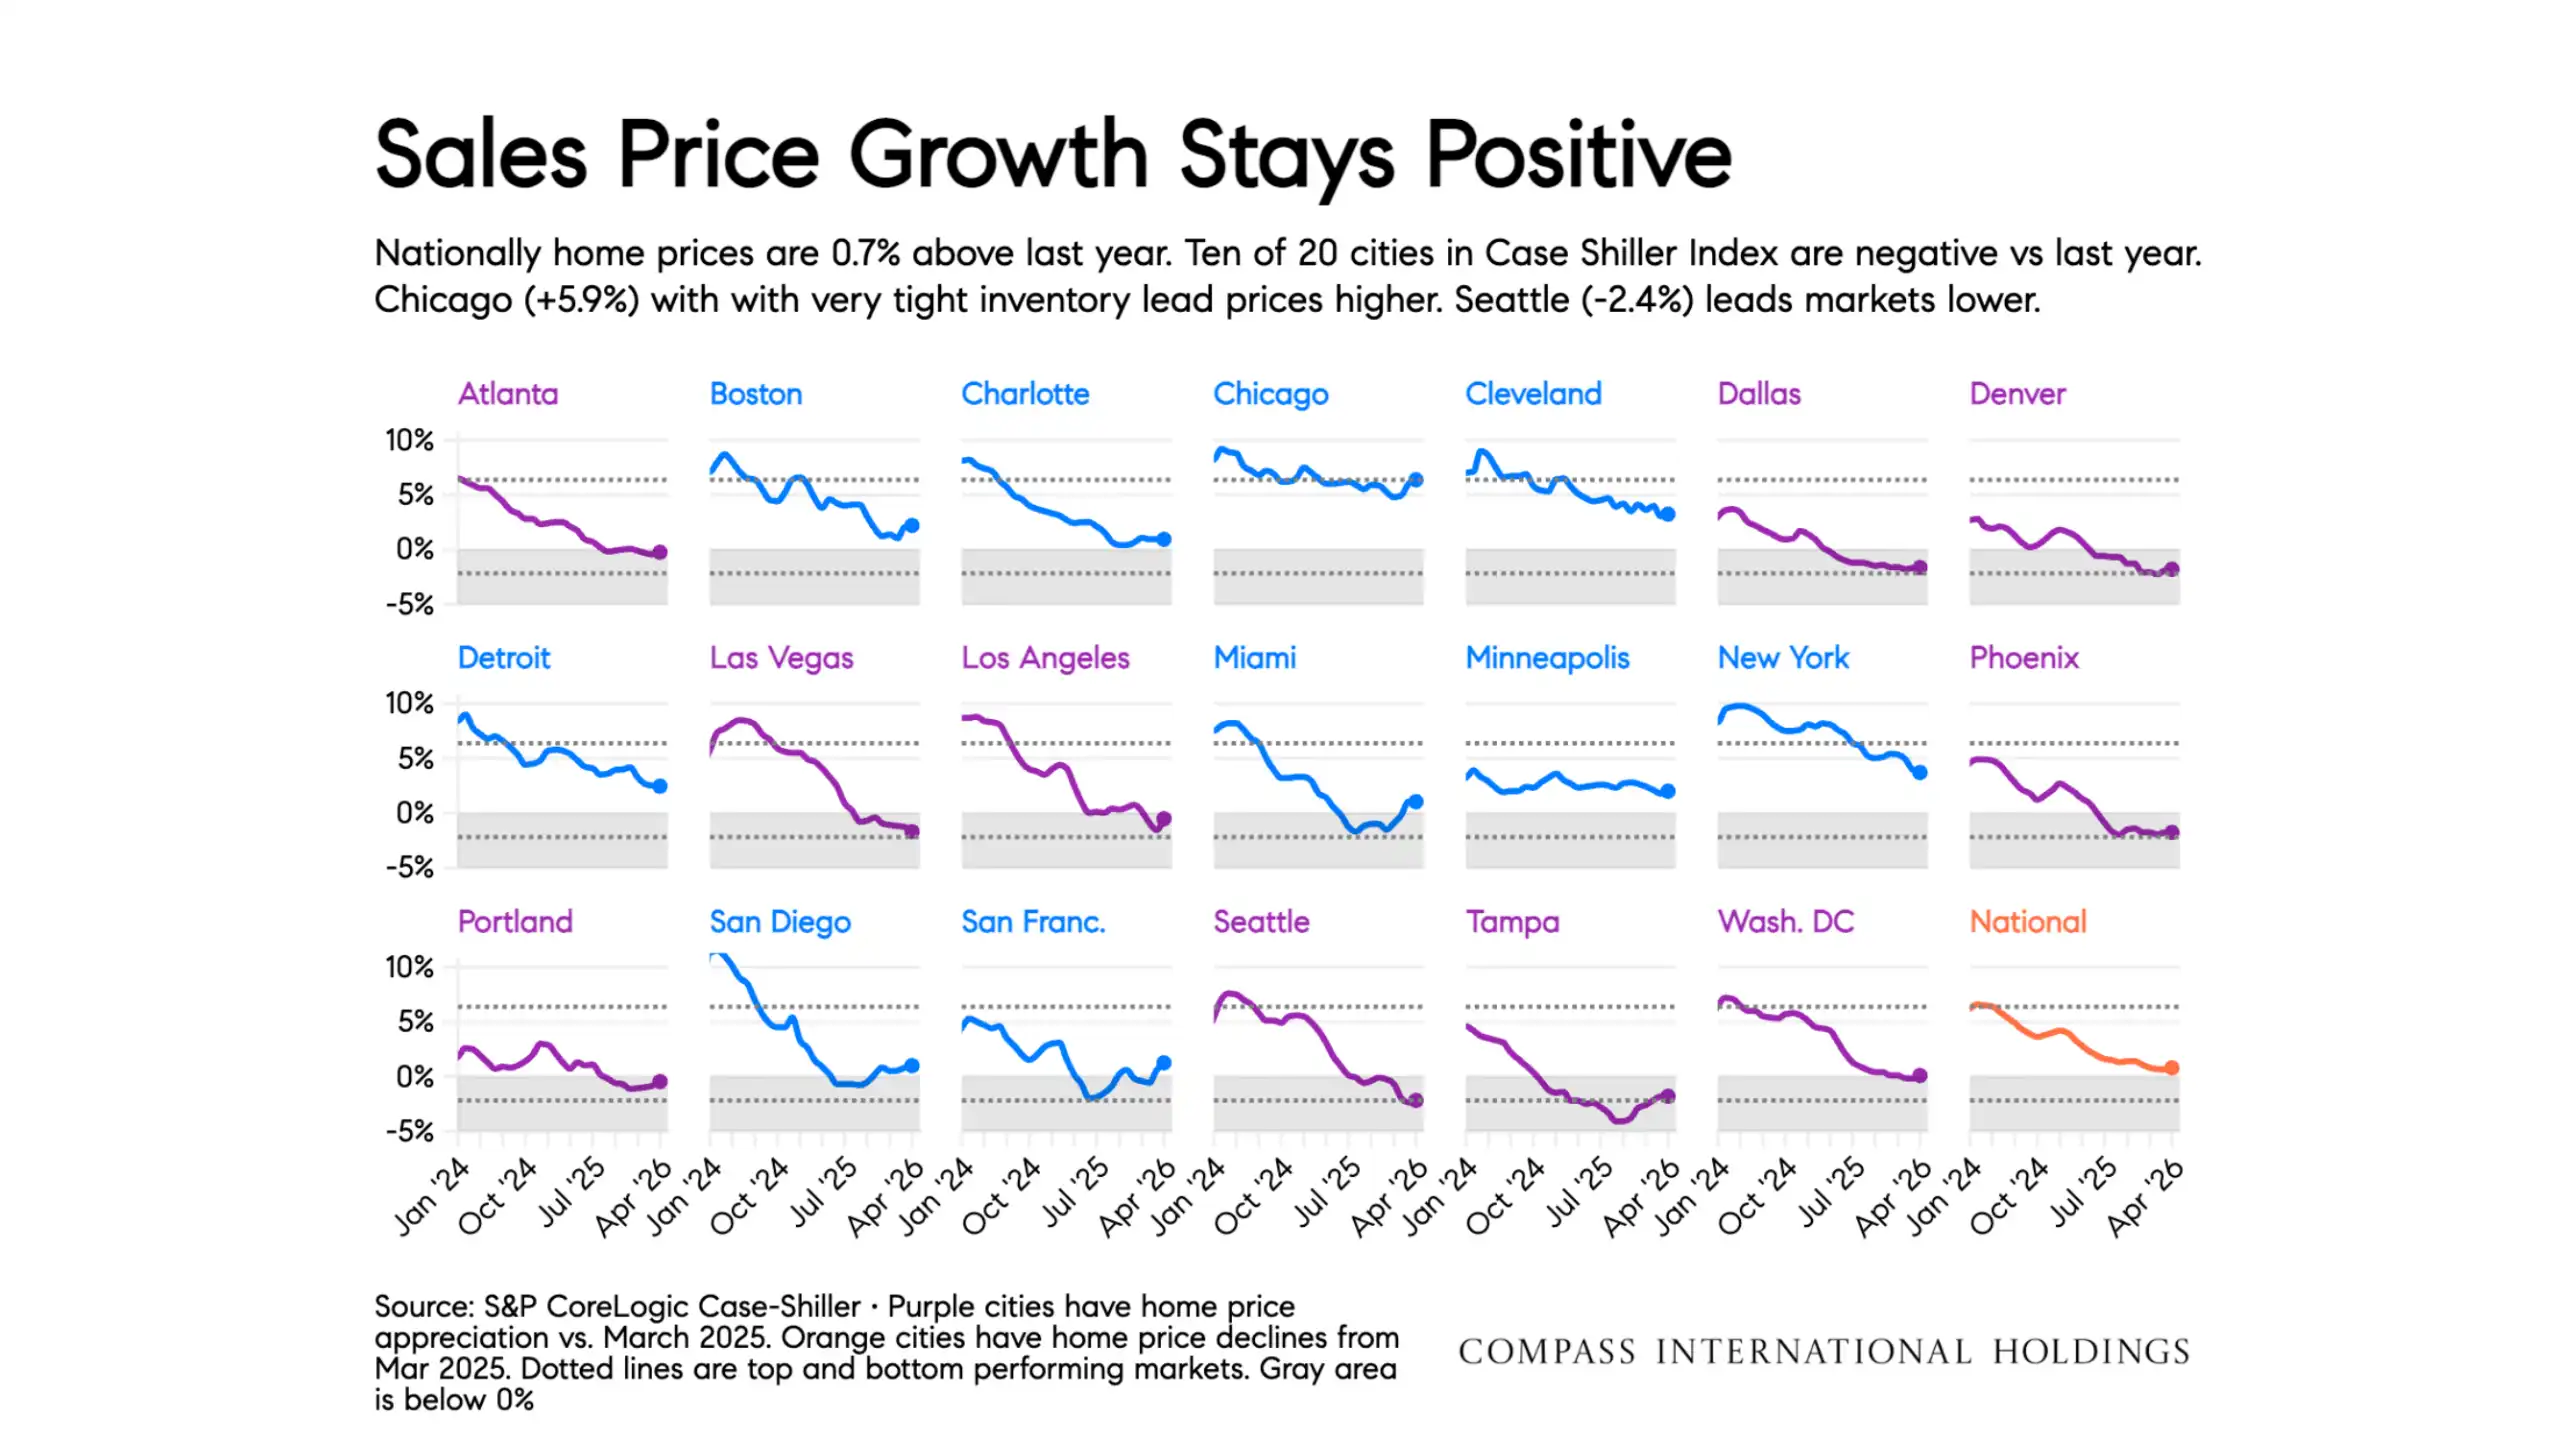
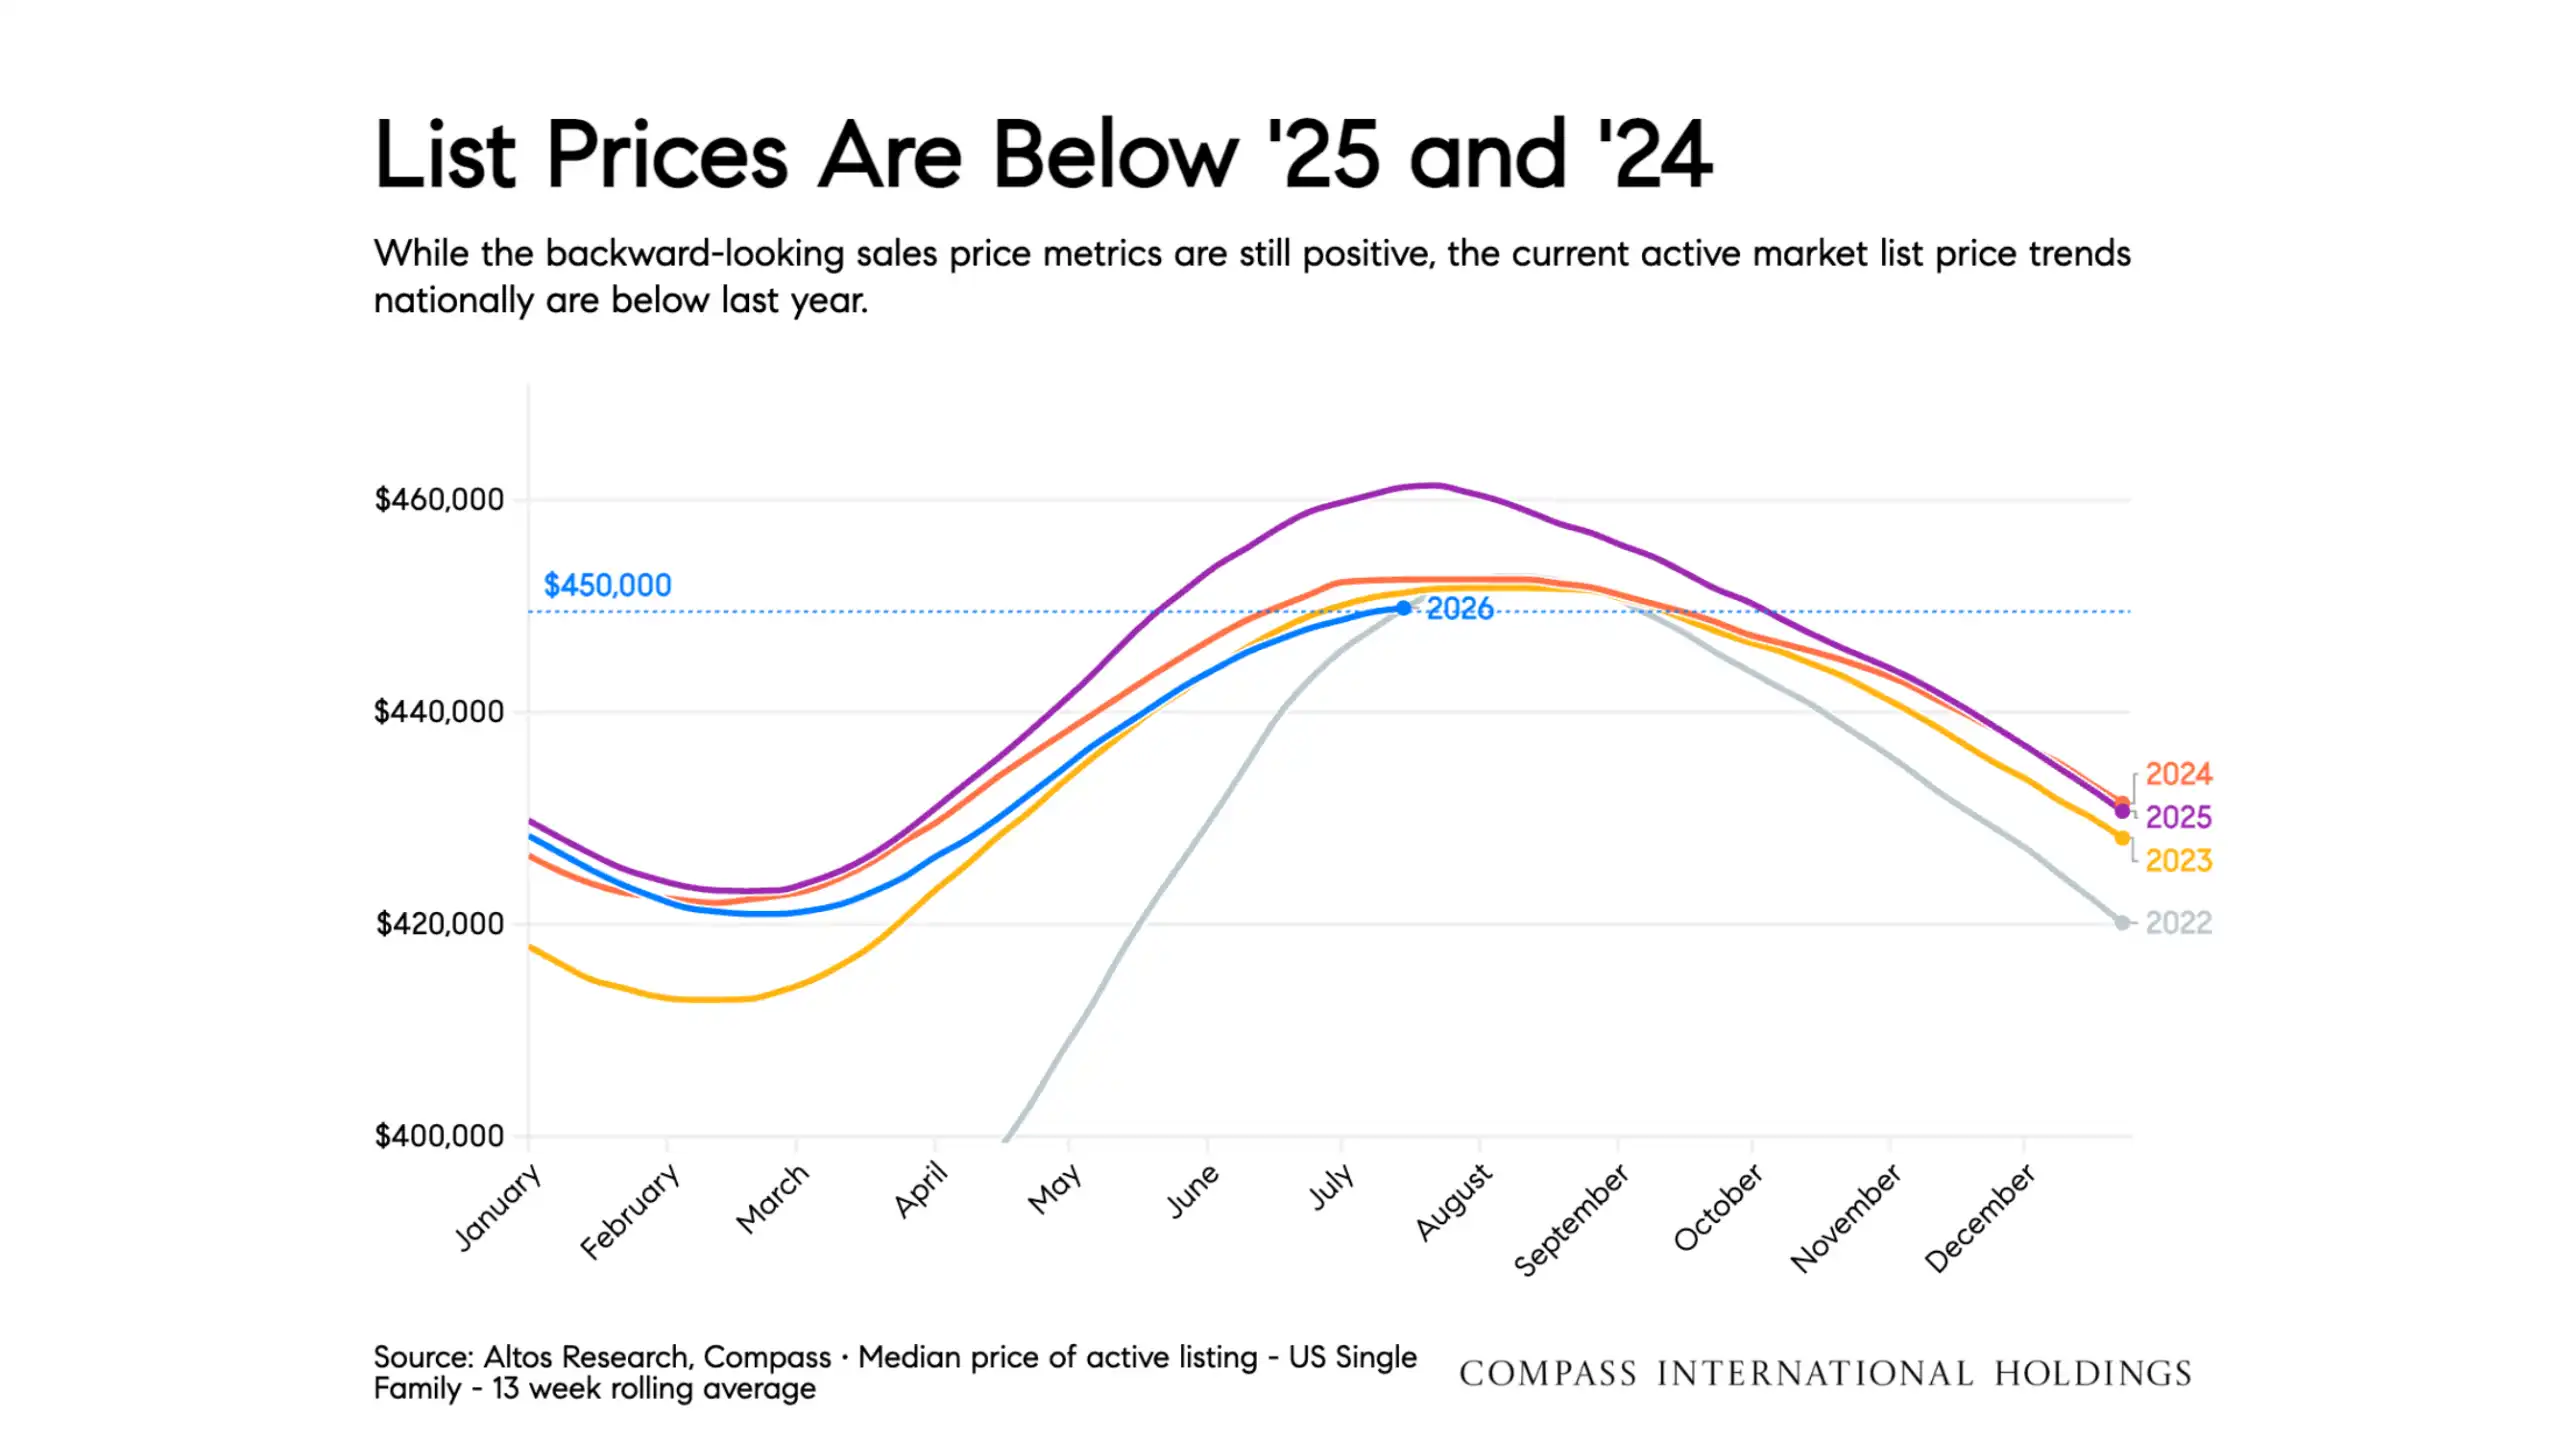
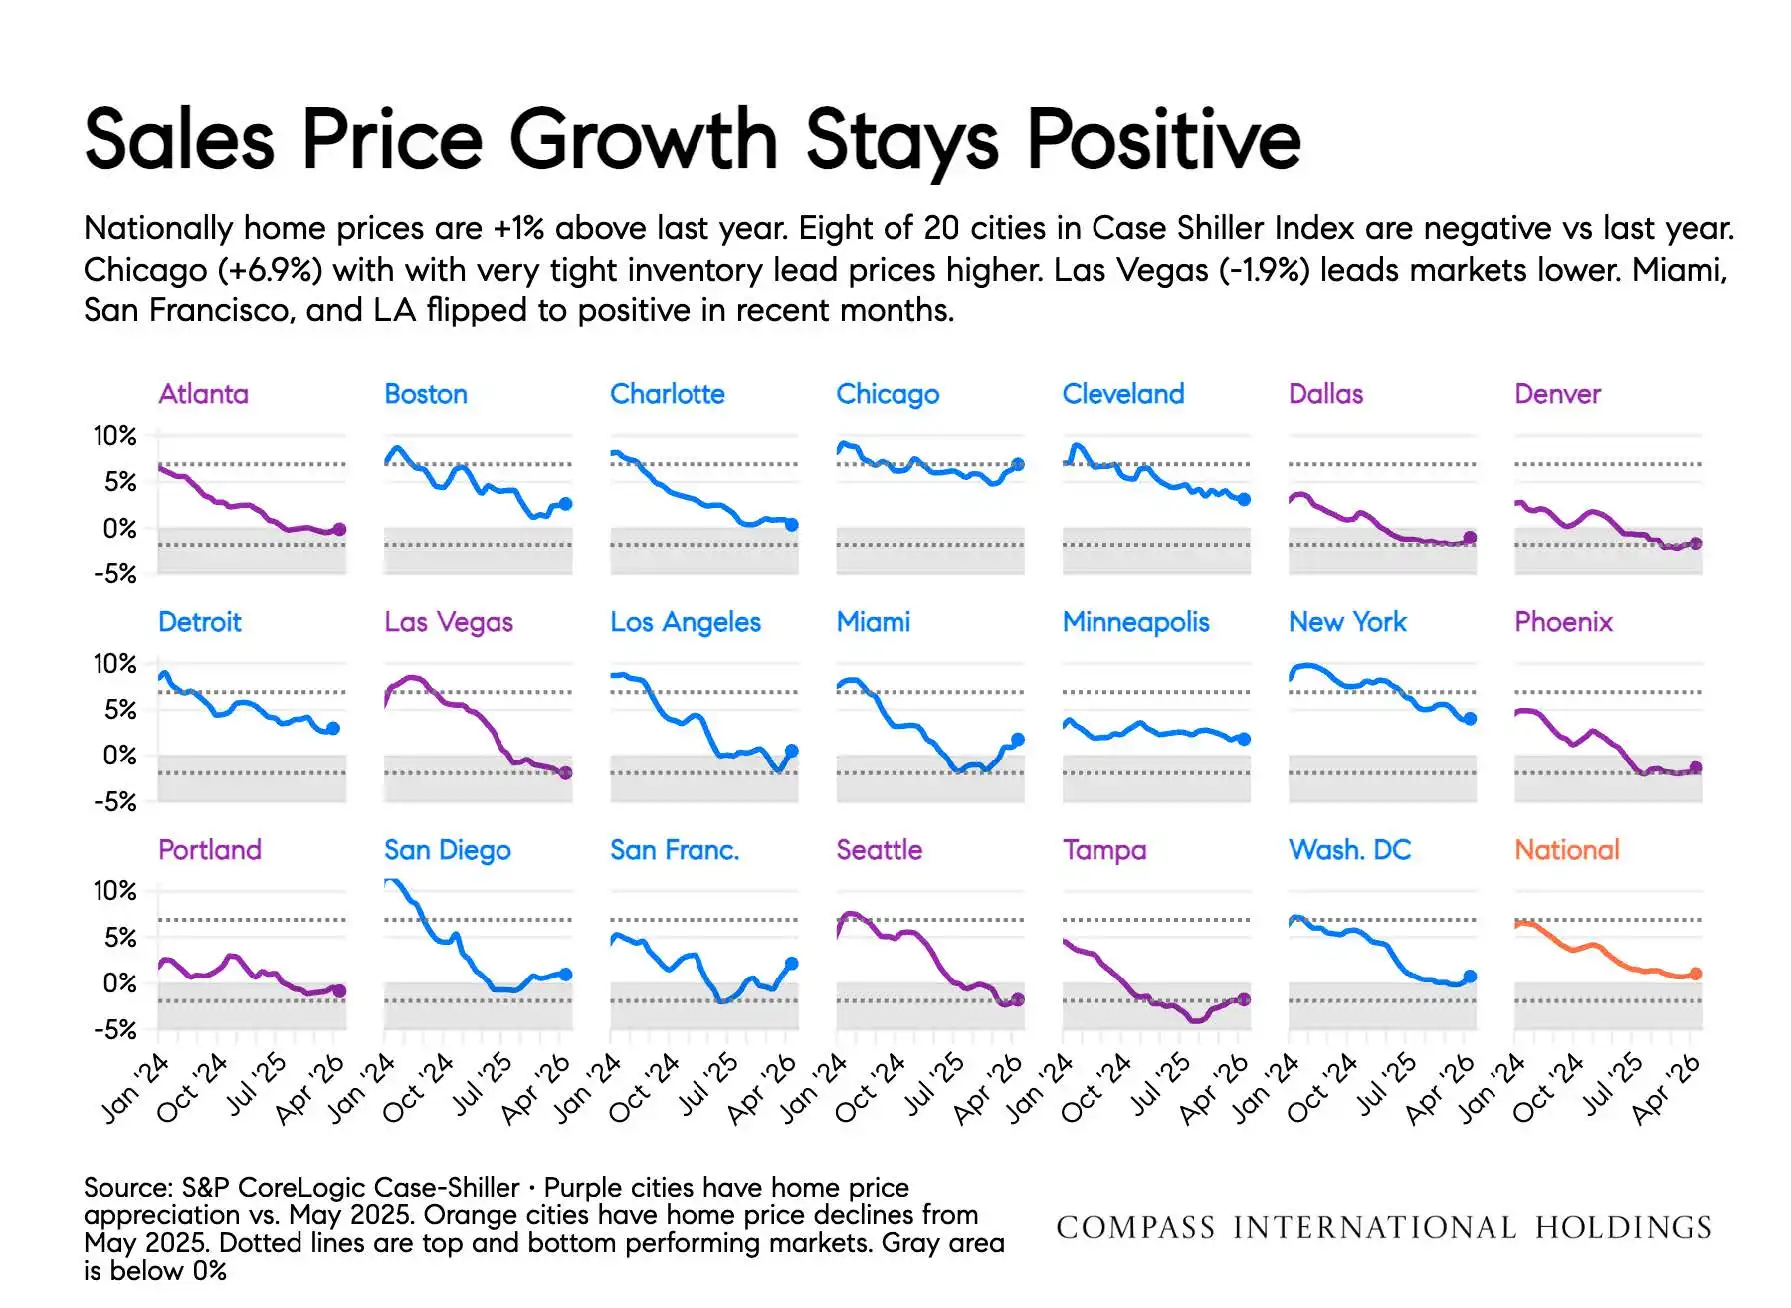
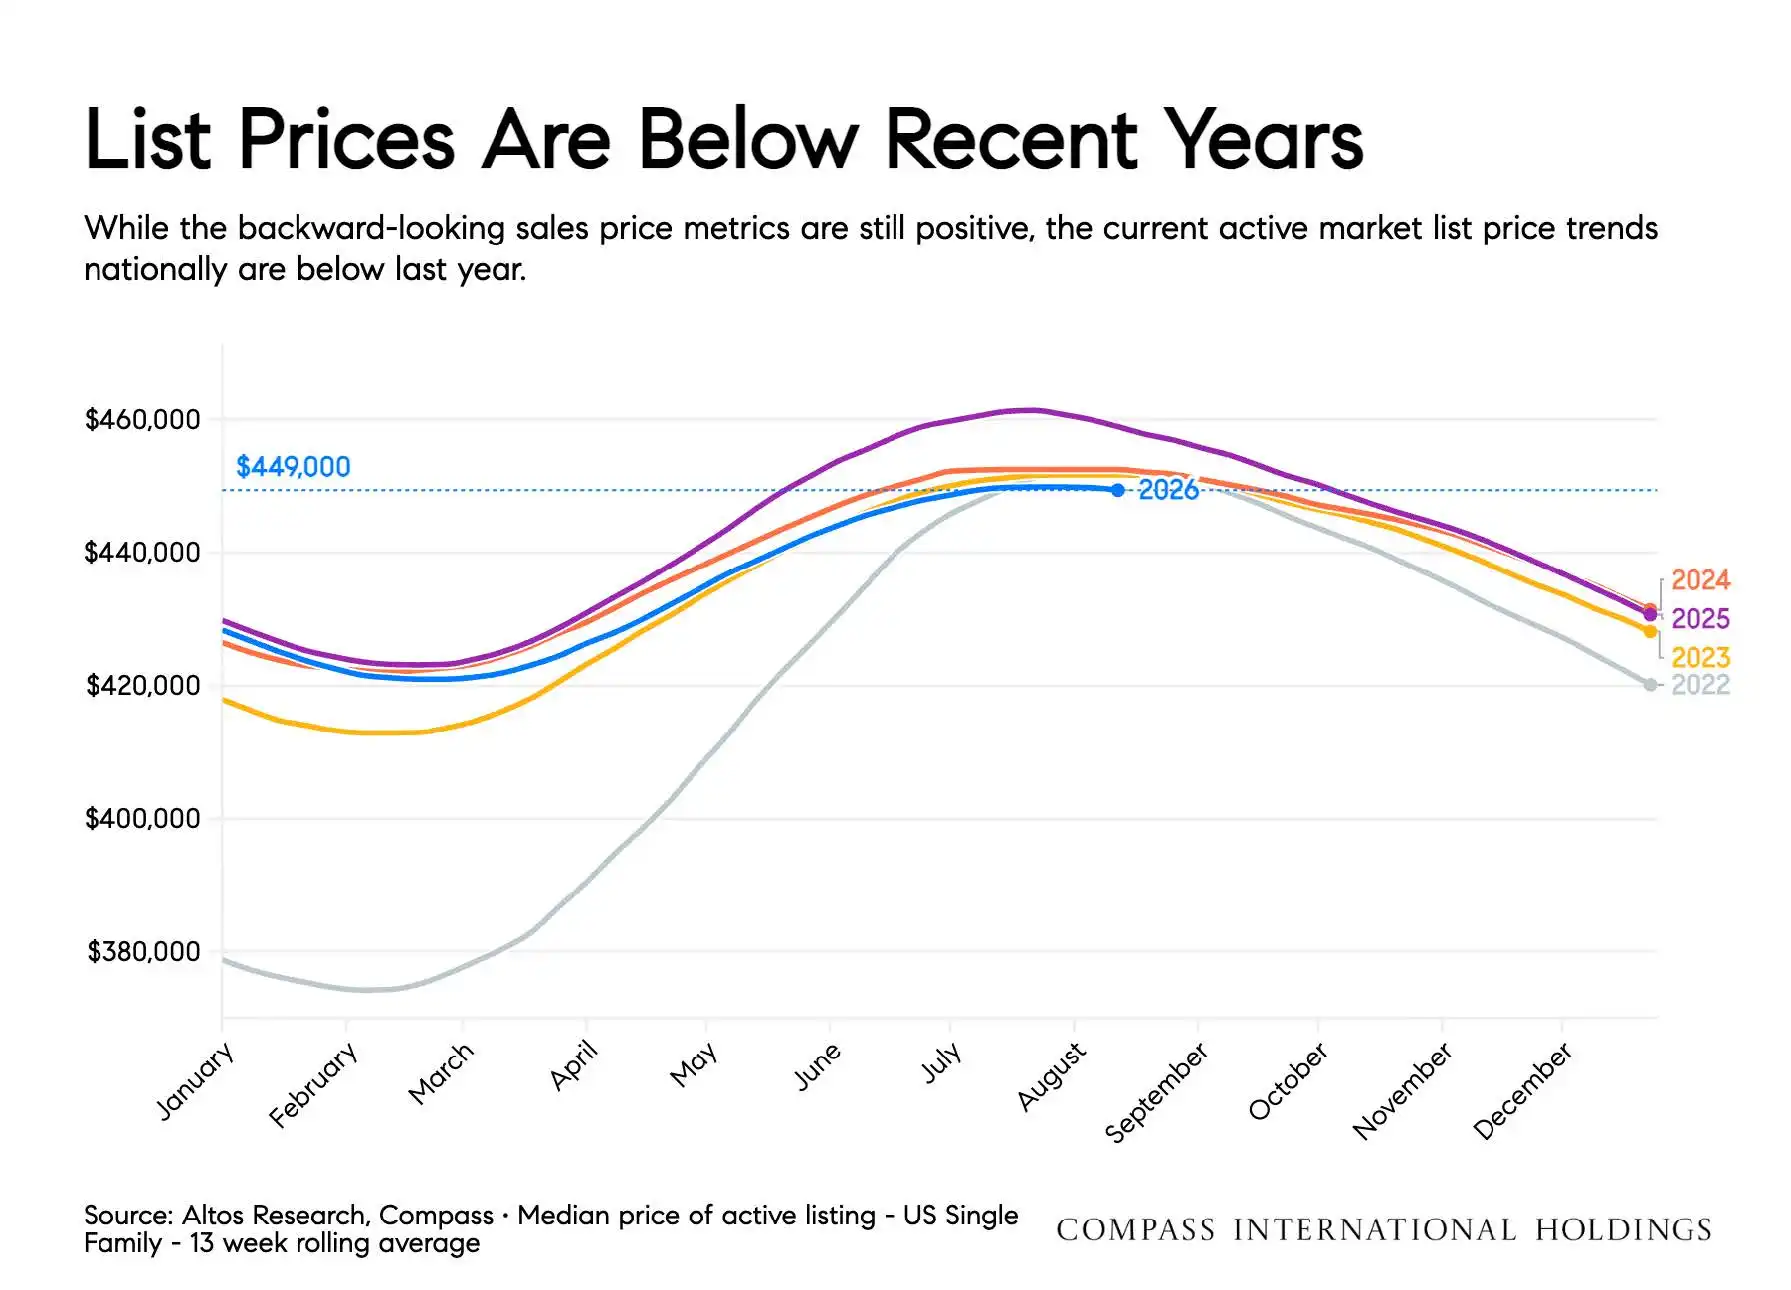
Home prices remained slightly positive nationally, rising approximately 0.7% year over year. However, the national figure masks considerable regional variation, with half of the cities included in the Case-Shiller analysis showing annual price declines. Current list-price trends were also below both 2025 and 2024 levels, suggesting that sellers are responding to more price-sensitive demand even while completed-sale data remains modestly positive. American homeowners remain in a comparatively strong financial position.
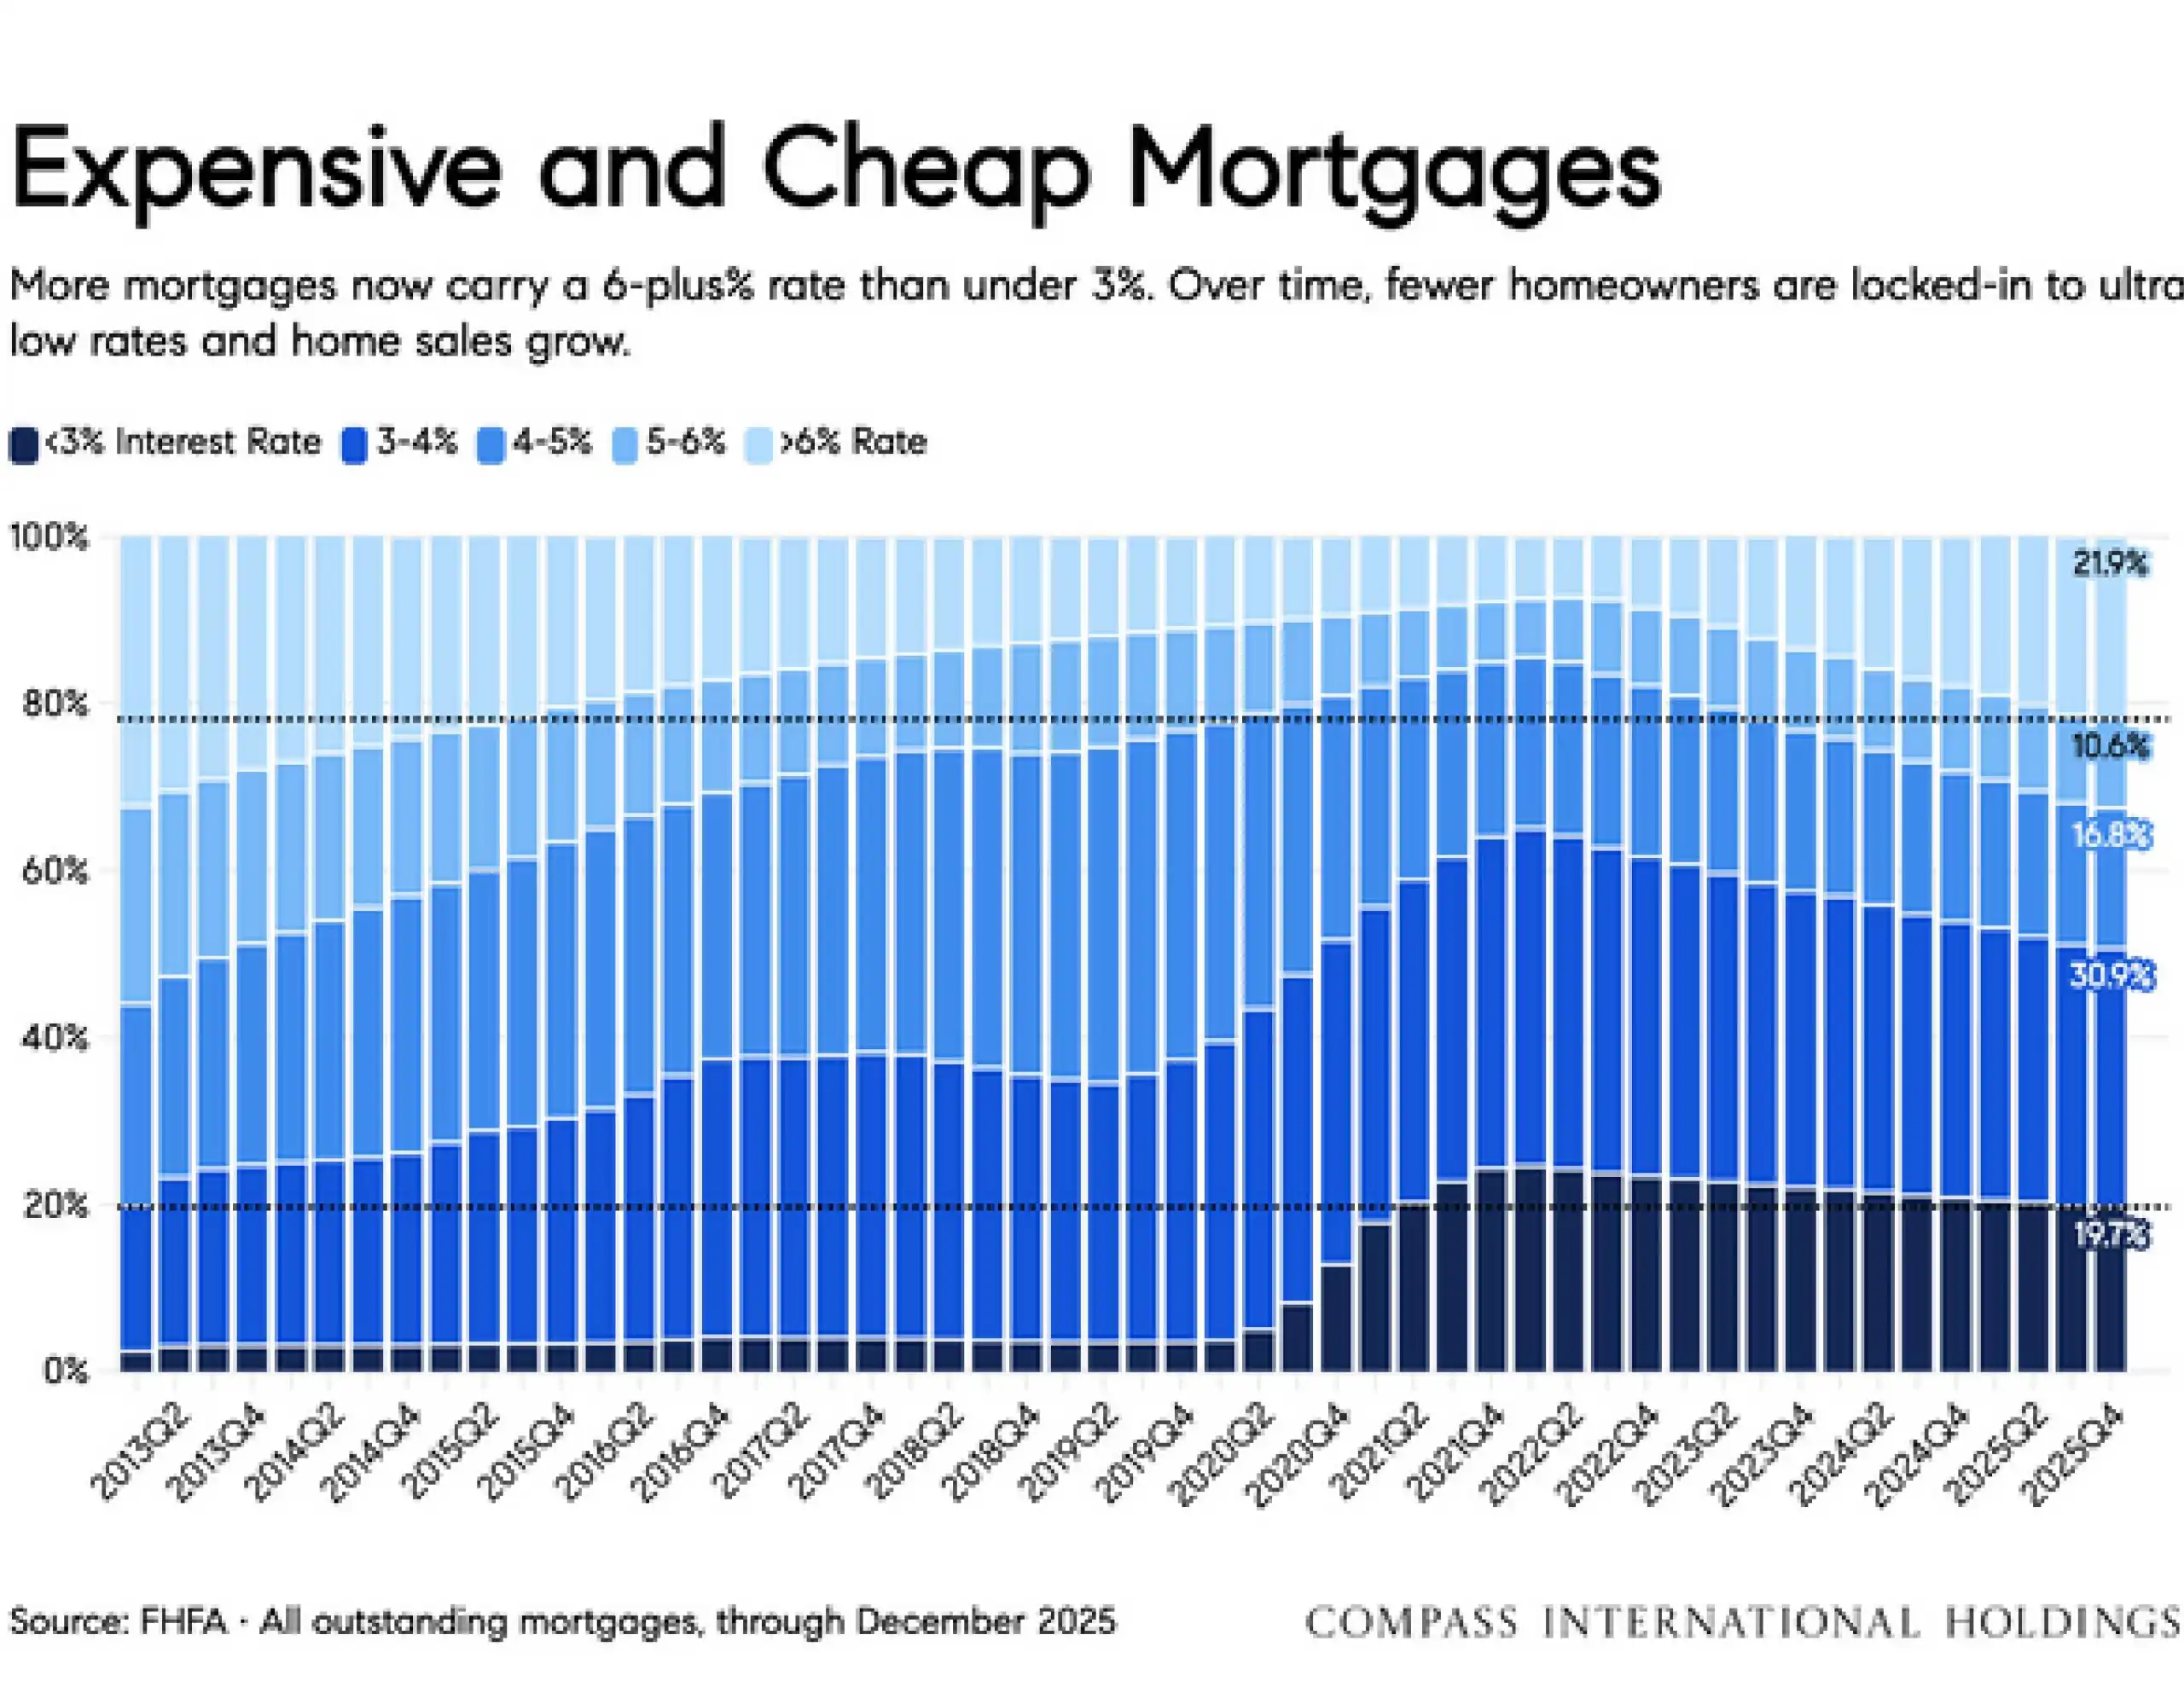
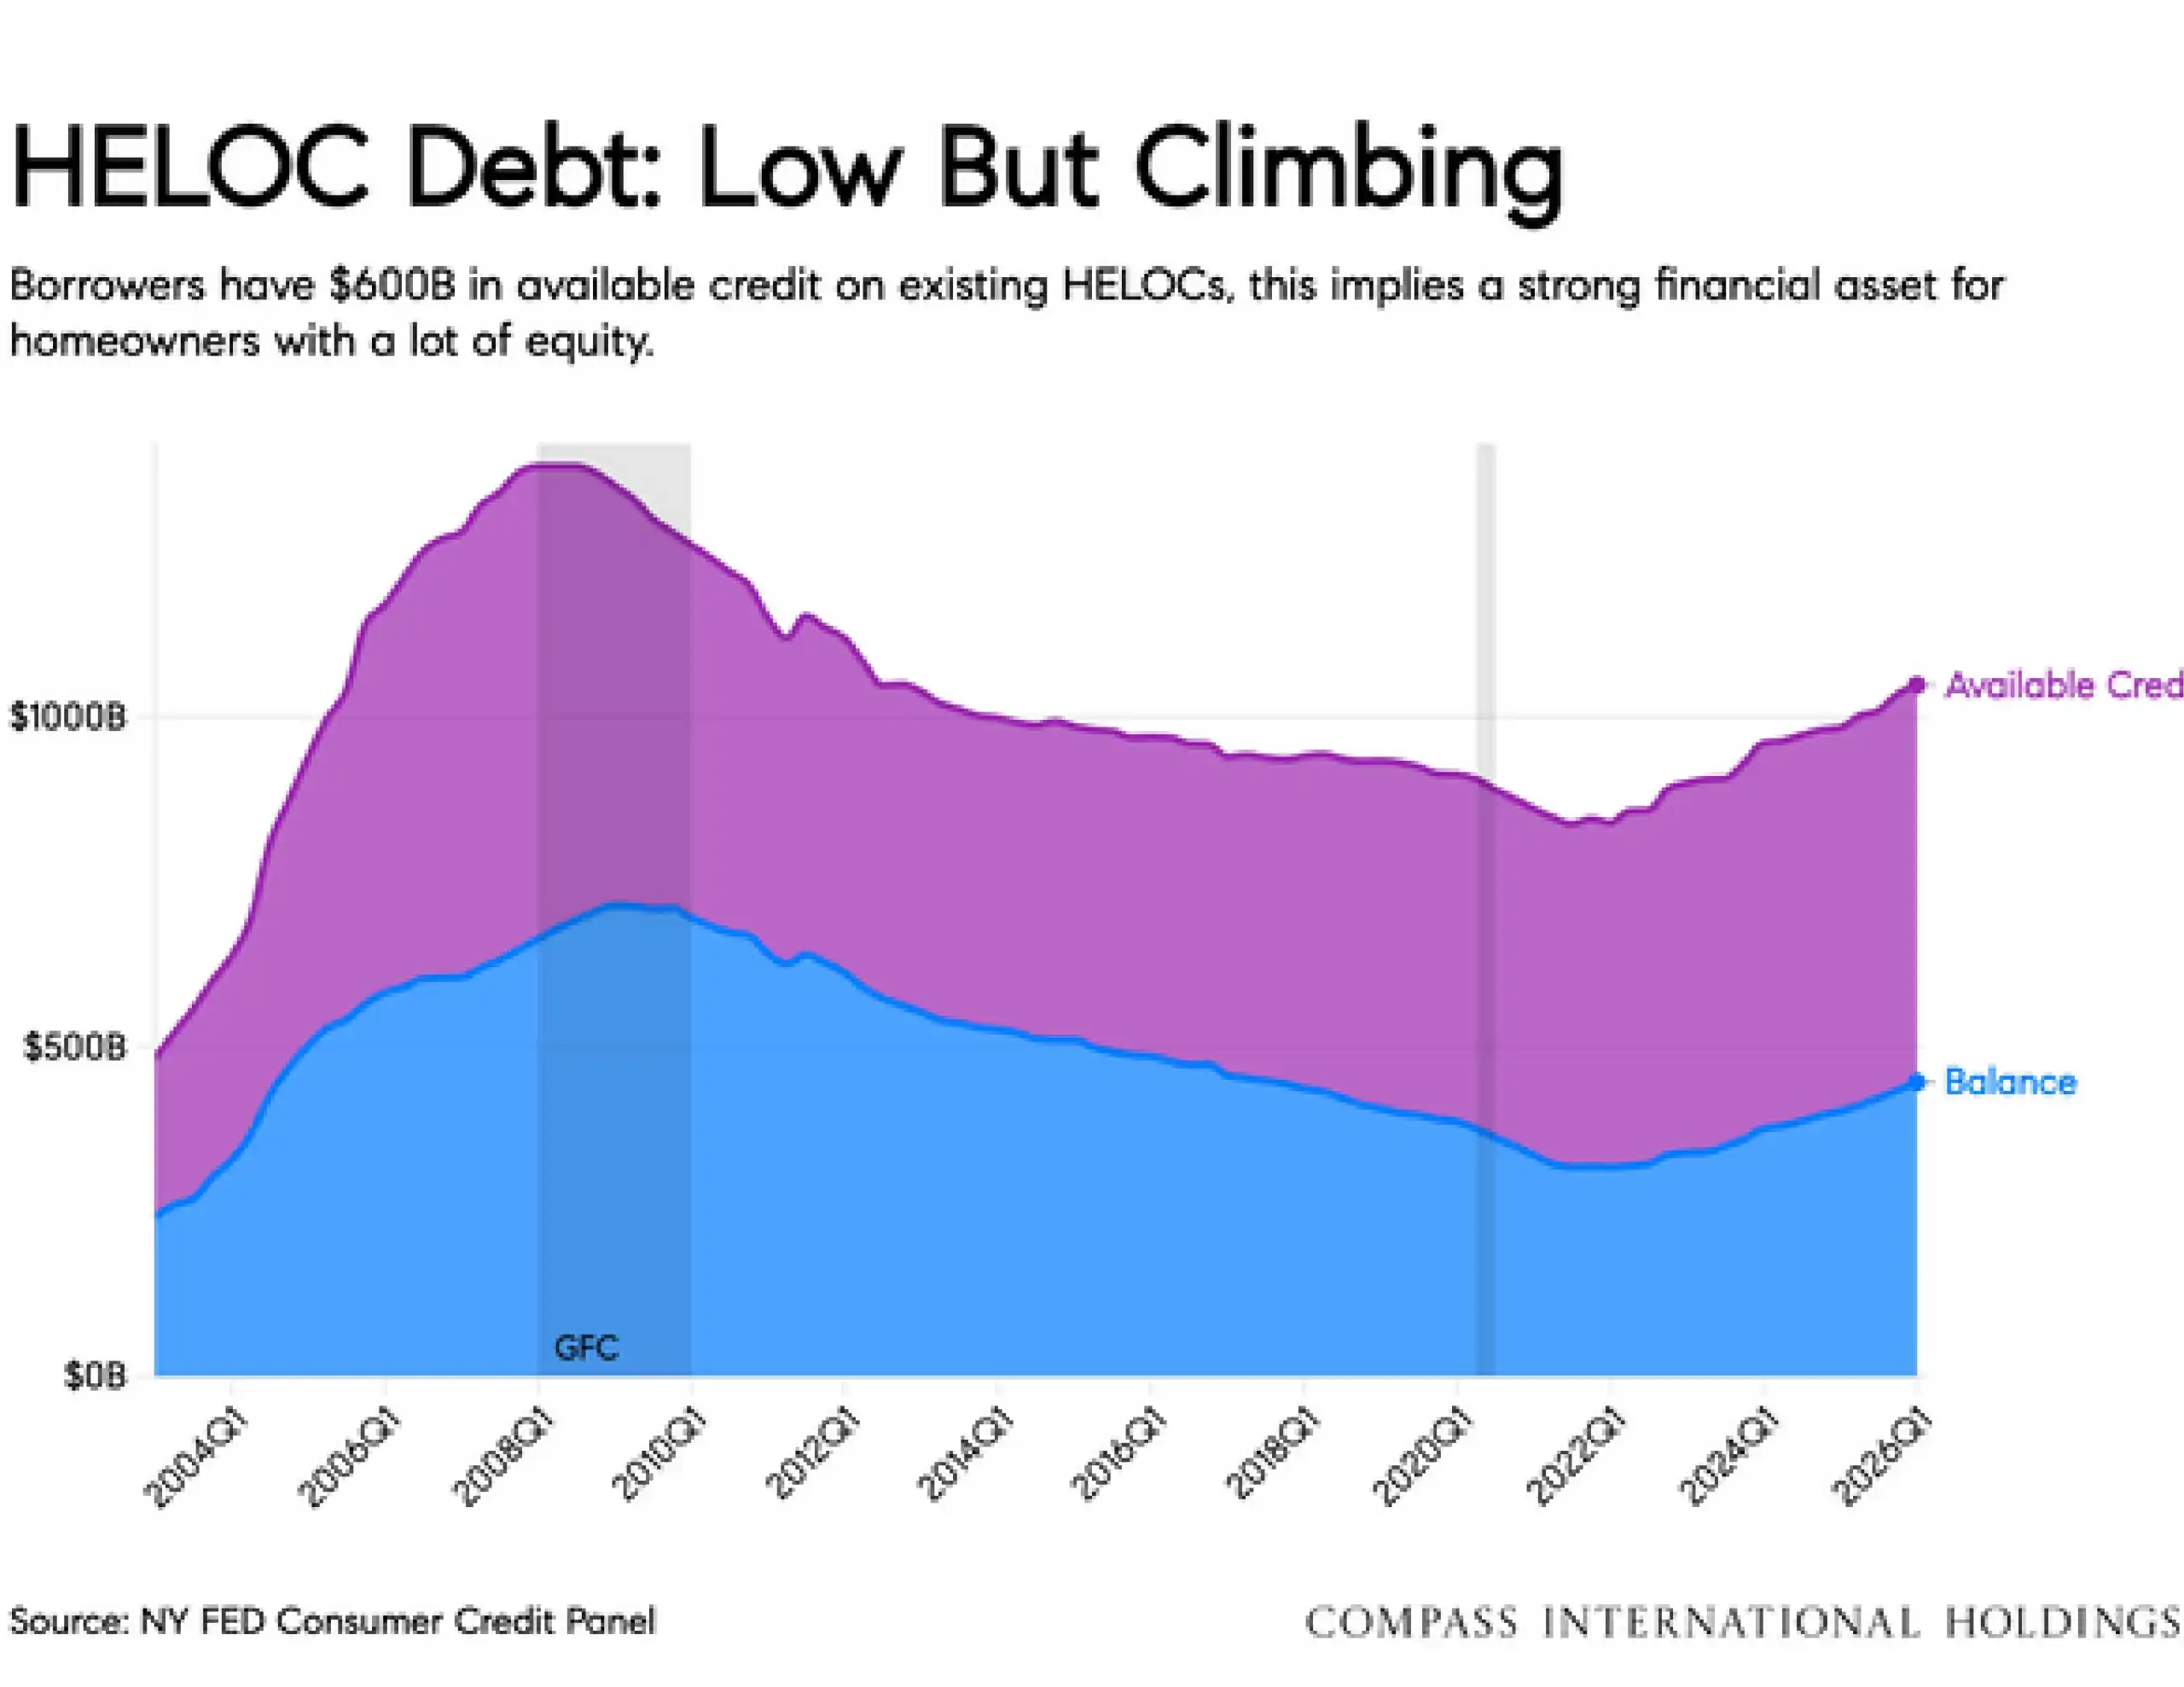
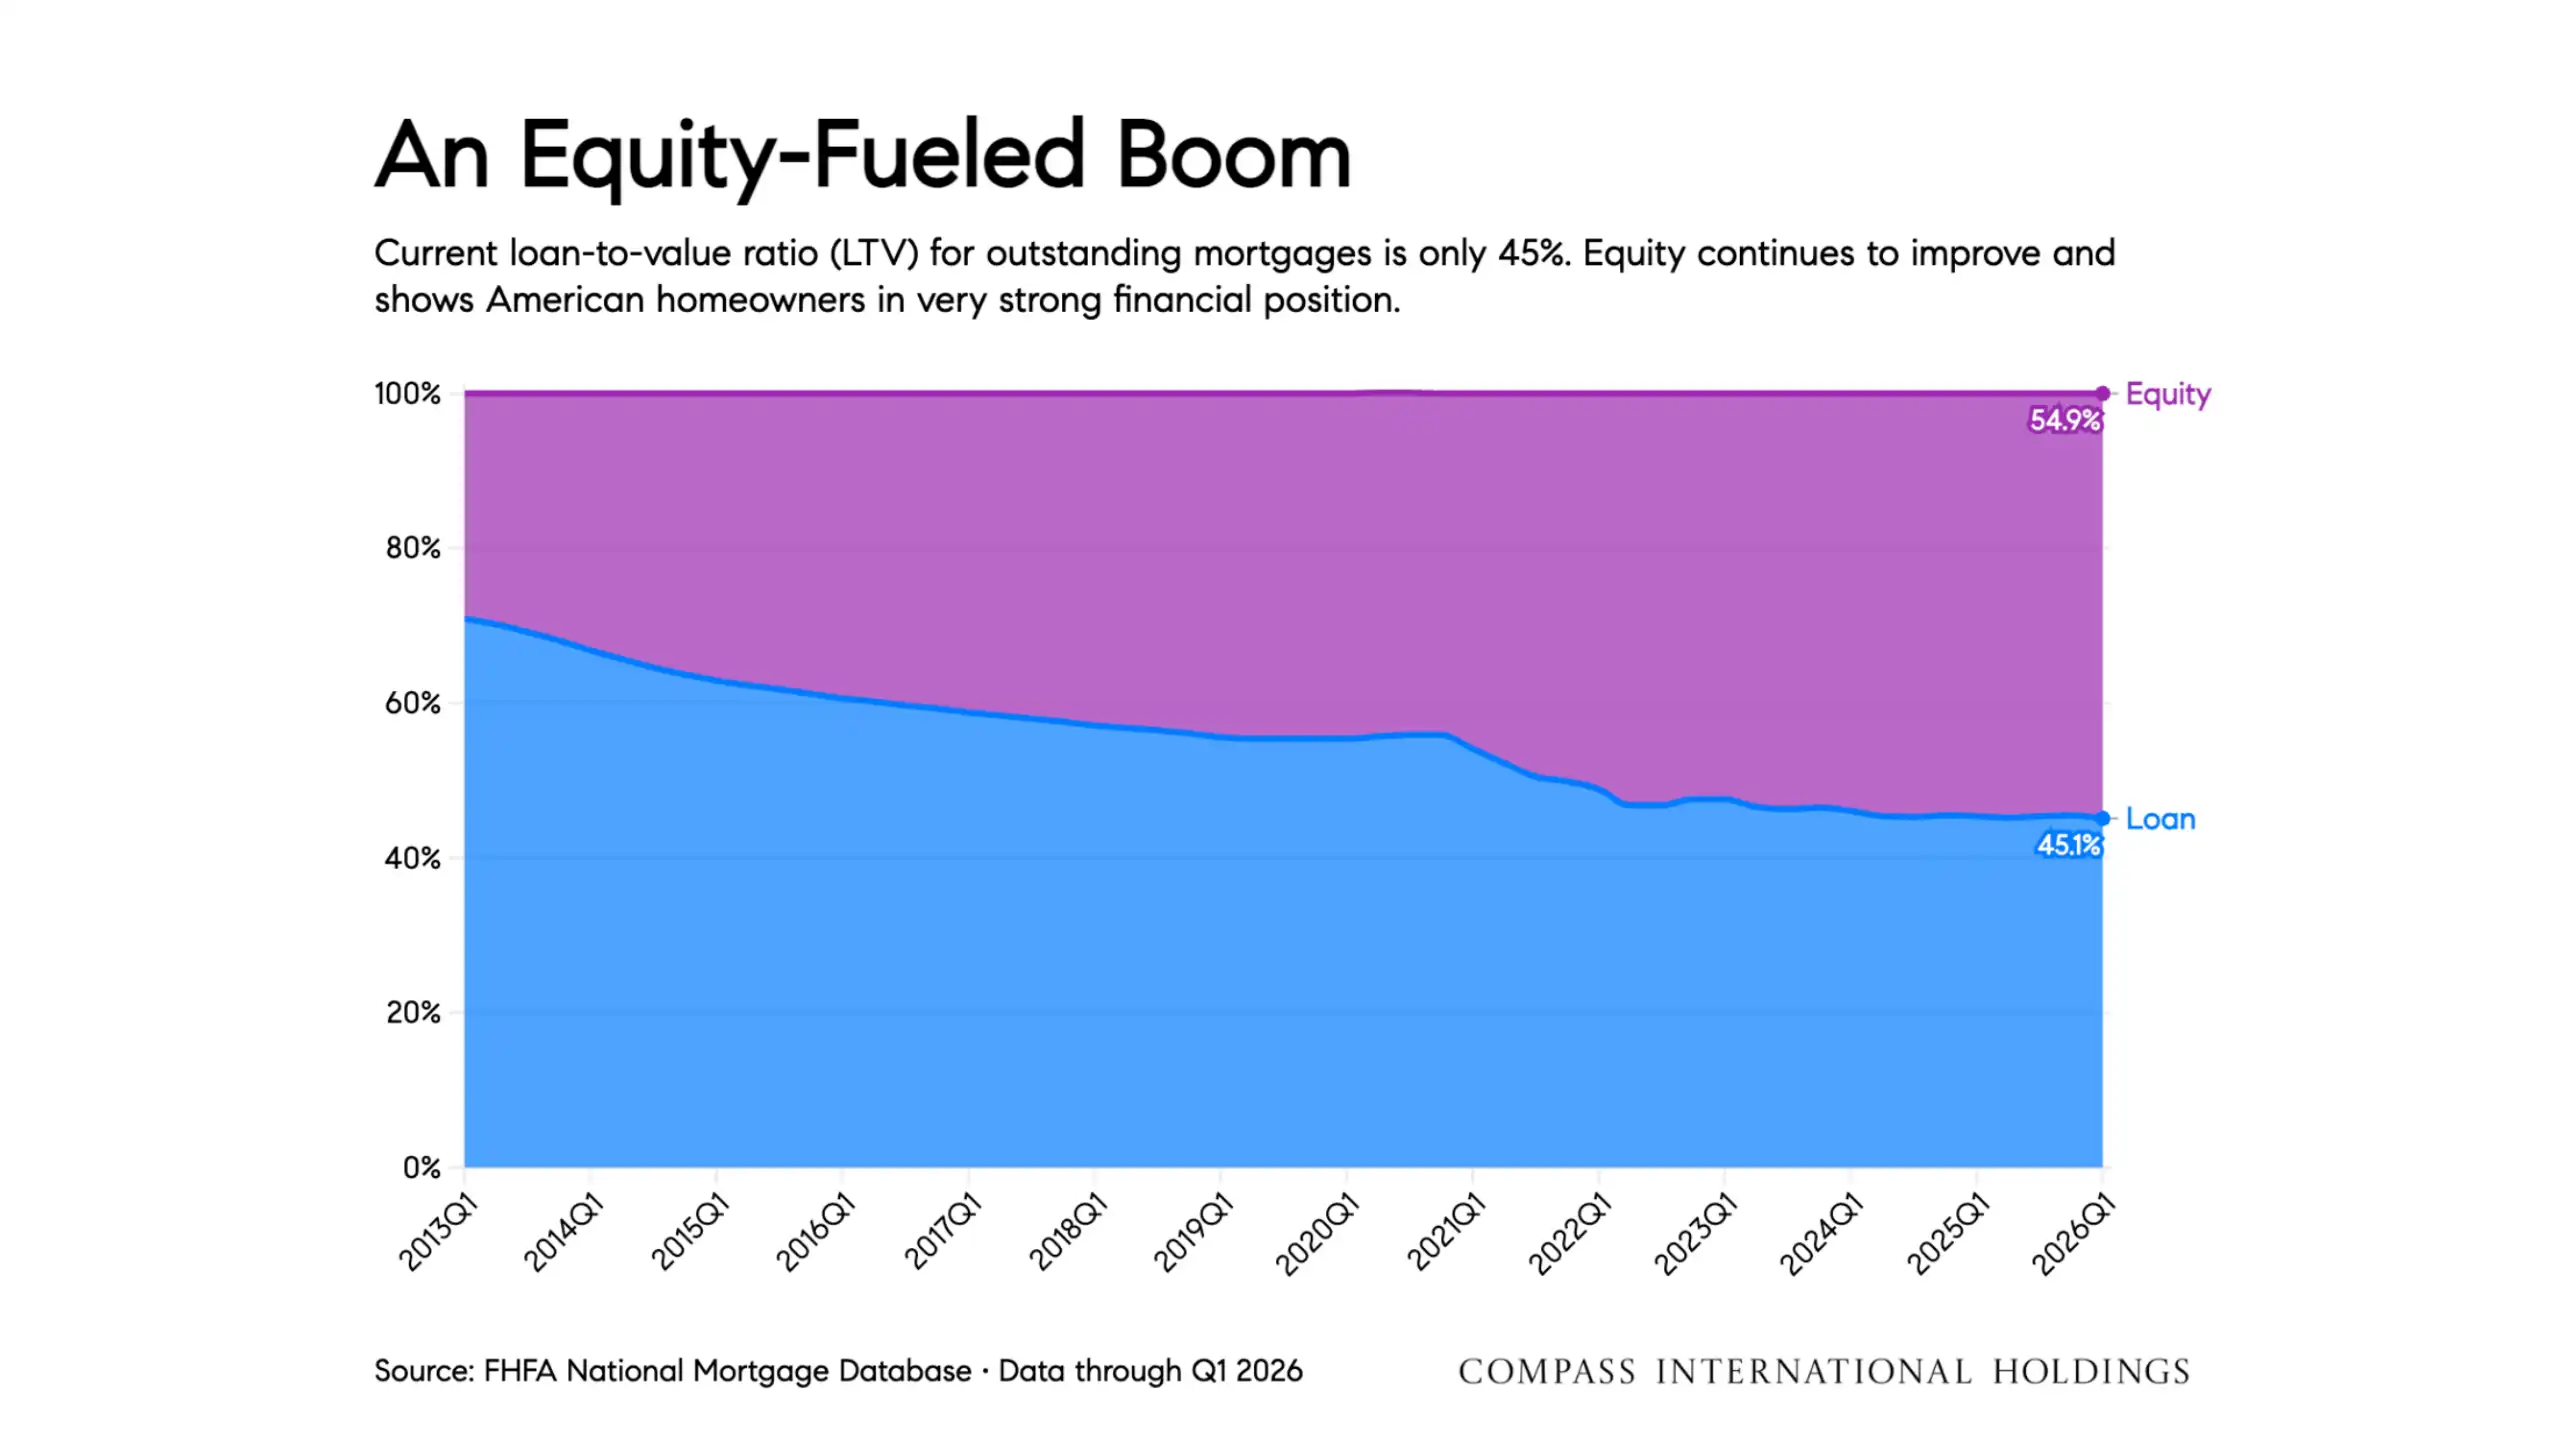
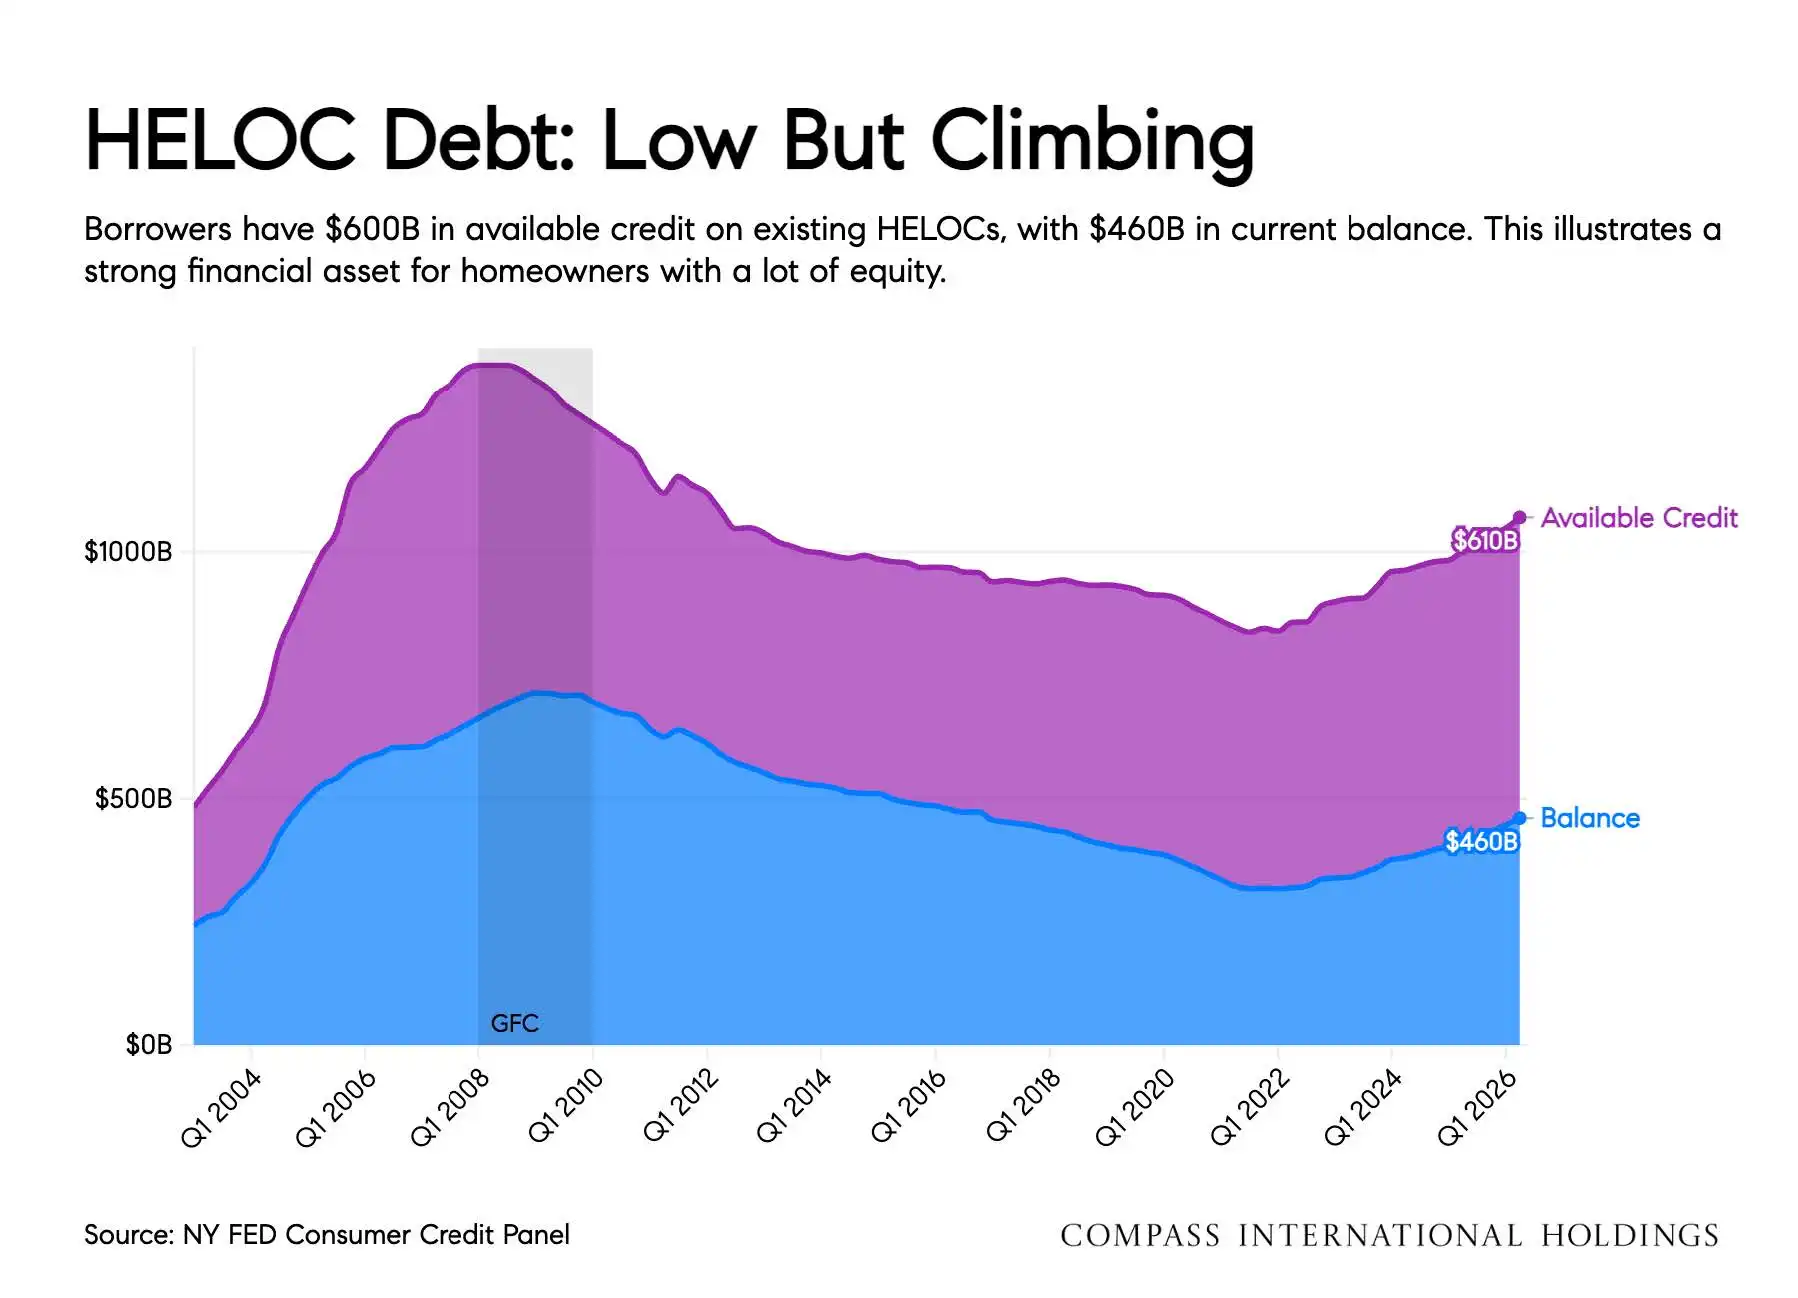
Approximately half of outstanding mortgages carry rates below 4%, overall household debt-service obligations remain relatively low, and homeowners collectively hold substantial equity. The average outstanding mortgage loan-to-value ratio was approximately 45%, leaving homeowners with nearly 55% equity. These conditions help reduce the risk of widespread distressed selling and provide an important foundation of stability for the housing market. The overall picture is not one of a market stopping, but one becoming more selective. Buyers remain active, particularly where property quality, location, pricing, and personal financial strength align. Sellers should expect greater scrutiny from buyers and should pay close attention to condition, presentation, competitive inventory, and pricing strategy.
Here in Jupiter, Palm Beach Gardens, Juno Beach, Tequesta, North Palm Beach, Singer Island, Jupiter Island, and throughout Northern Palm Beach County, local conditions do not always move in step with national averages. Waterfront homes, condominiums, golf communities, luxury properties, and traditional residential neighborhoods each have their own supply-and-demand patterns. Drawing on more than 45 years of combined real estate experience, The Simmonds Team uses national housing data as helpful context, but meaningful guidance comes from understanding local inventory, buyer demand, property condition, neighborhood trends, price point, and lifestyle-specific markets.
Market at a Glance
Mortgage Rates: Rates moved back into the upper 6% range, reaching their highest levels of 2026 and placing renewed pressure on affordability.
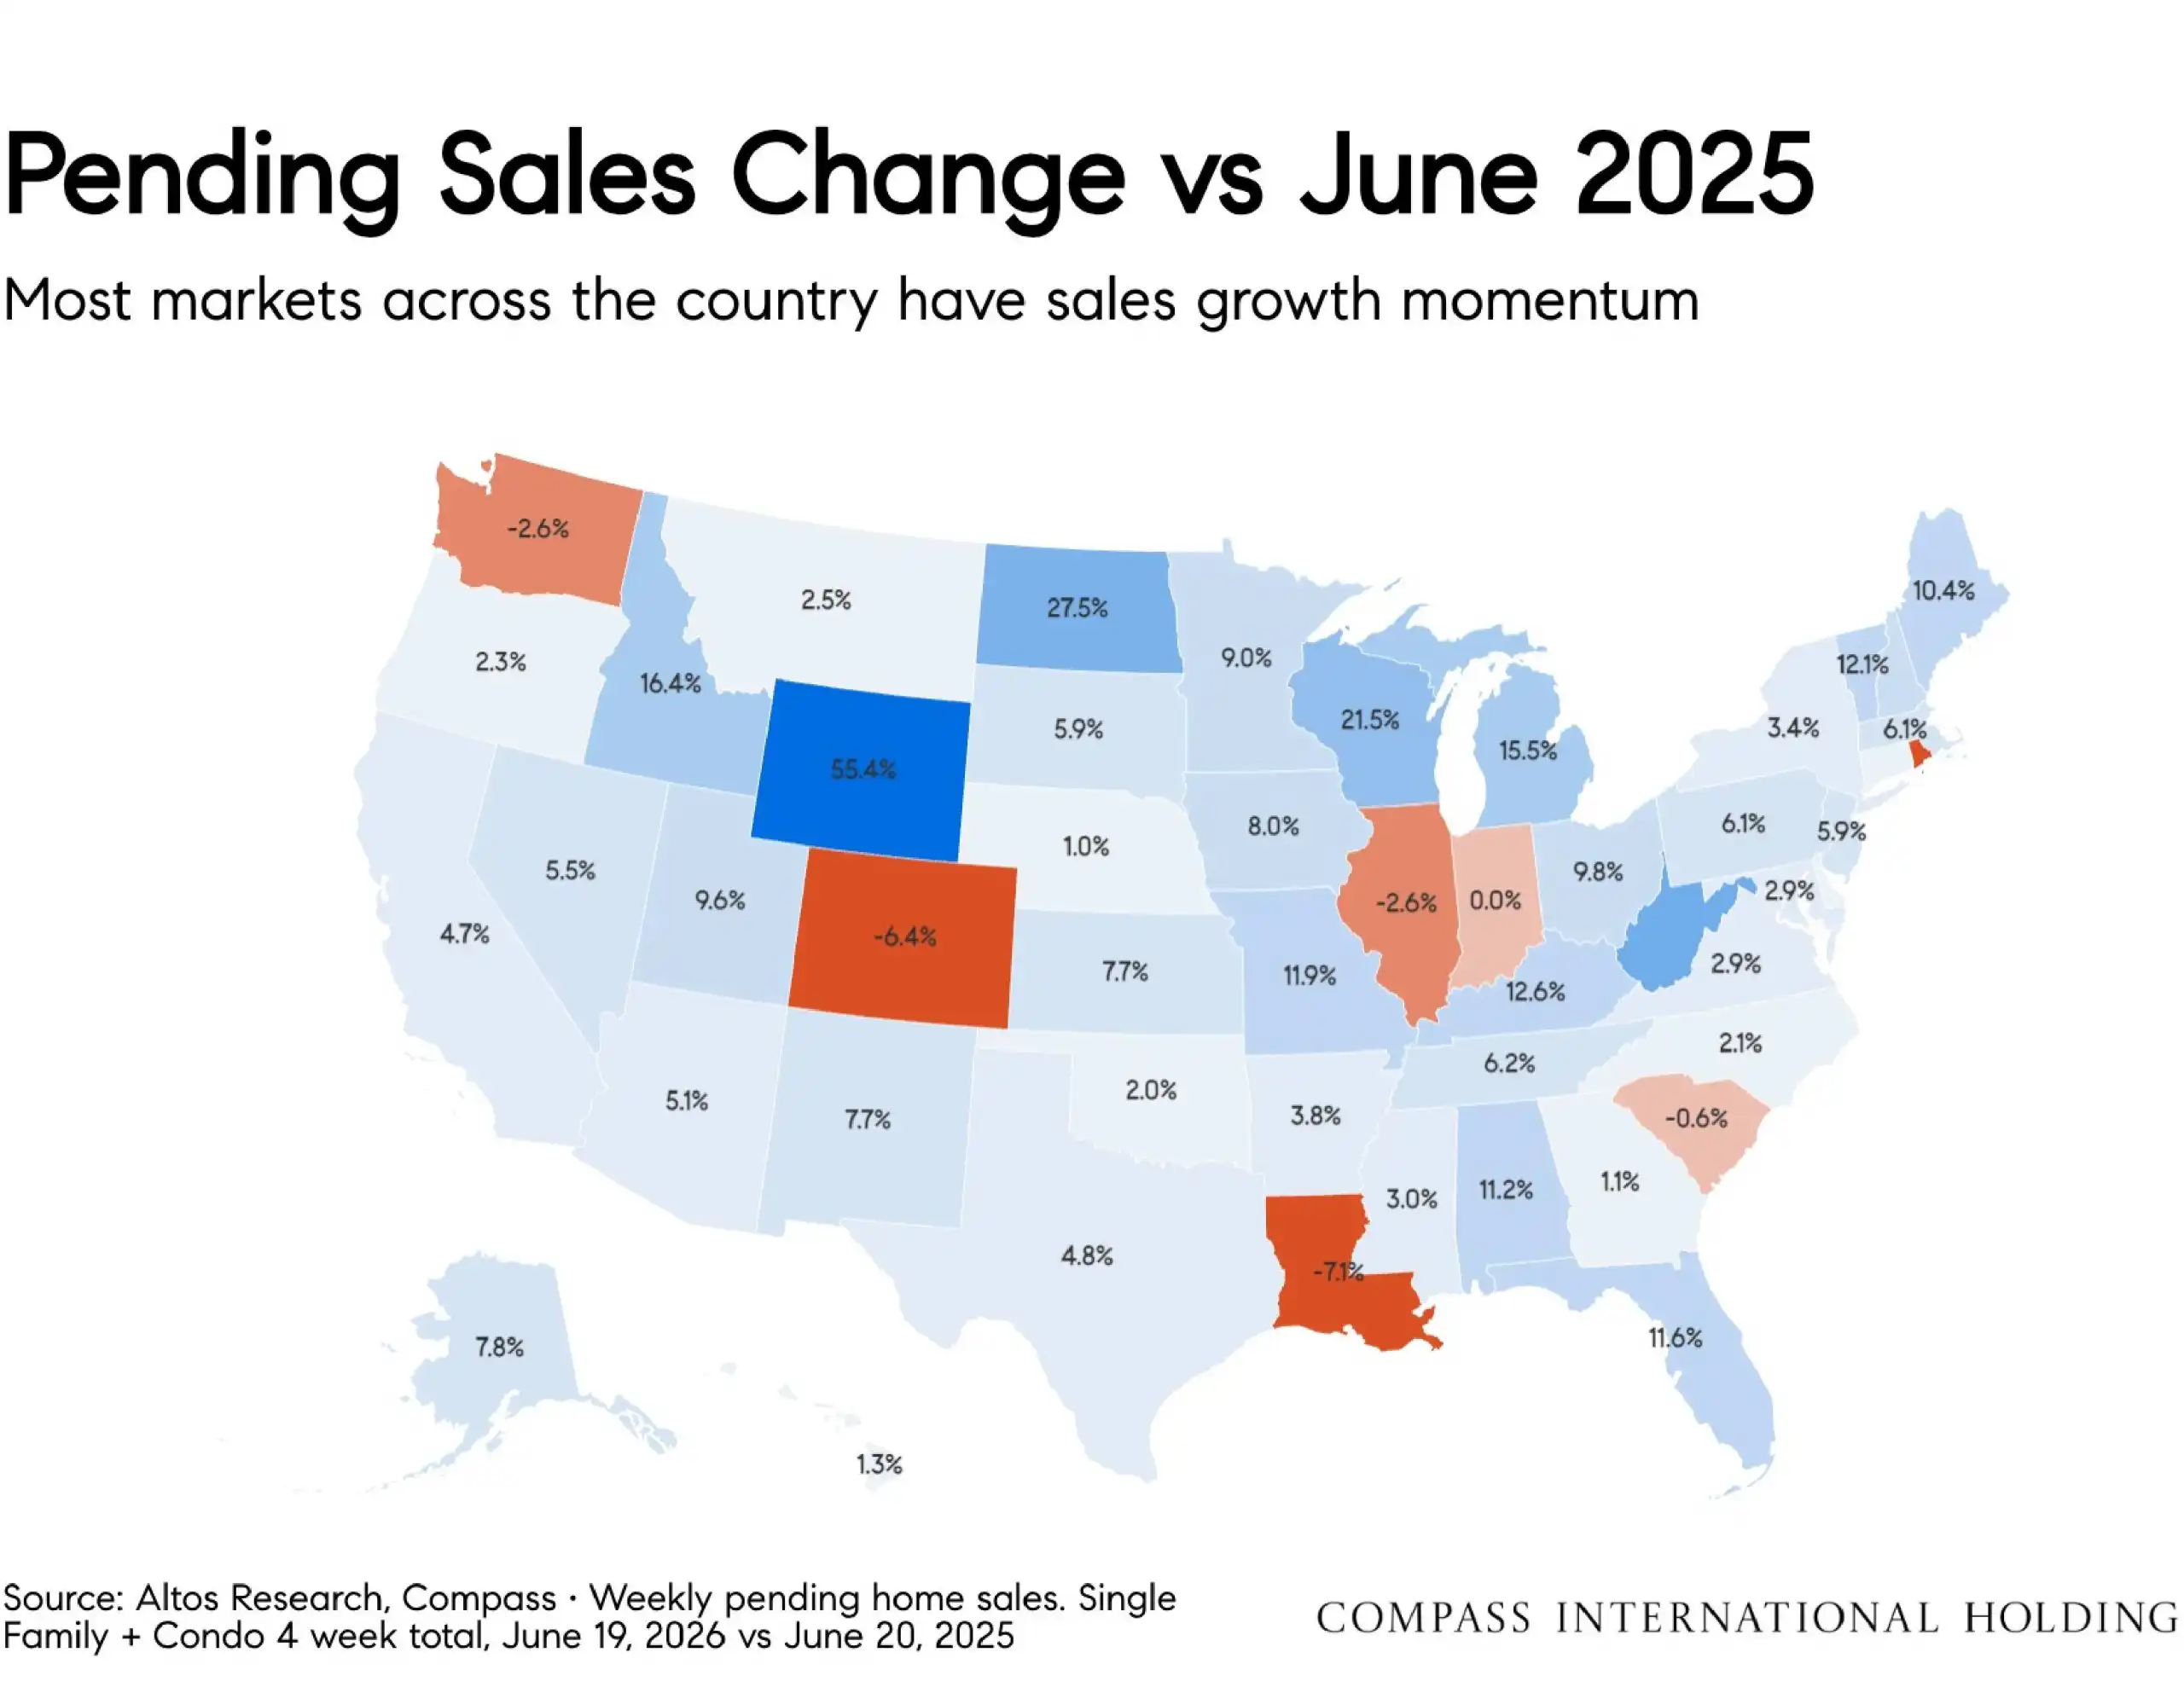
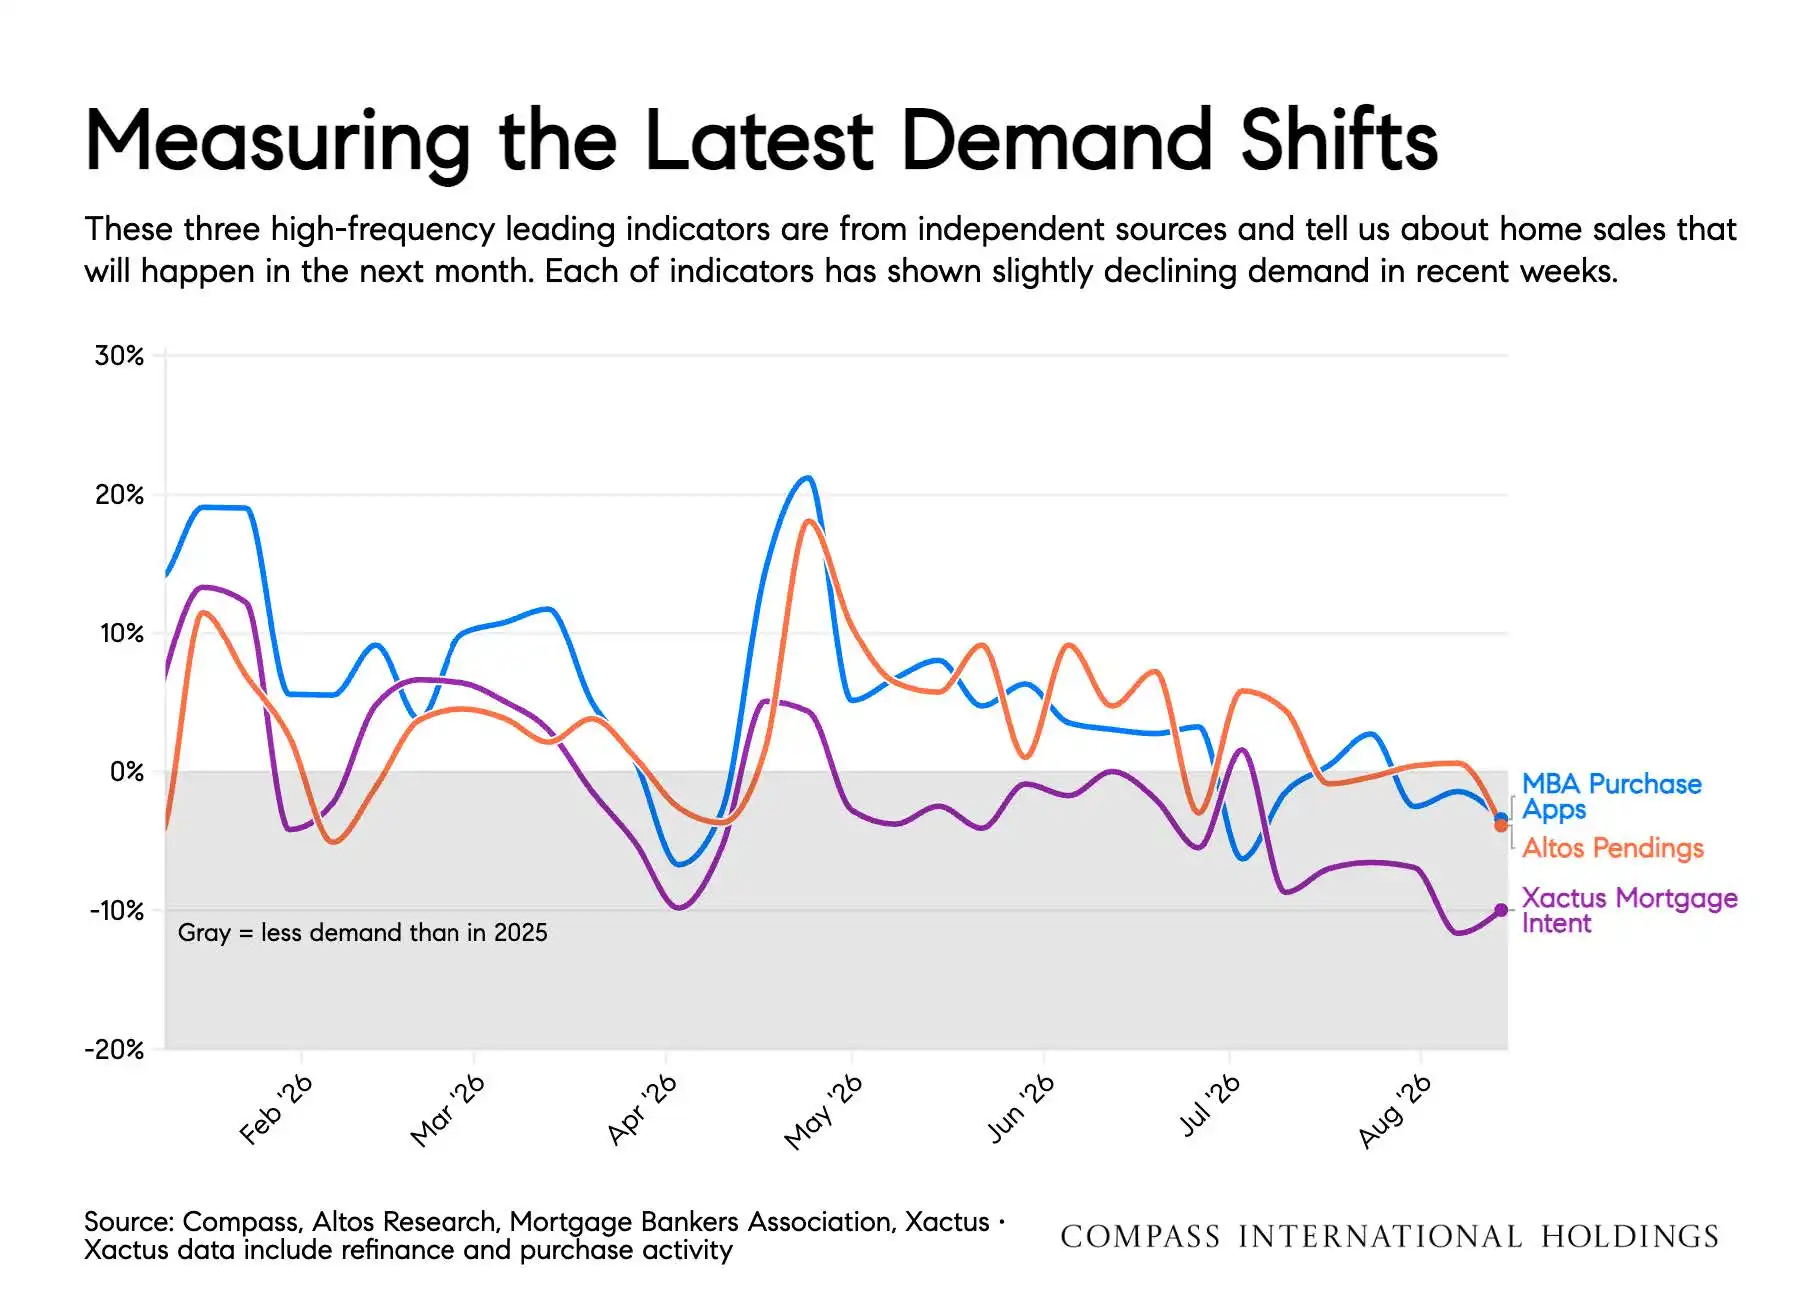
Pending Sales: Mid-July pending sales were approximately 1.4% ahead of 2025, but momentum had weakened from earlier in the year.
Existing-Home Sales: June sales were running at an annualized pace of approximately 4.1 million, slightly above last year but below the report's 2026 forecast.
Employment: Job growth remained modest, but unemployment claims stayed very low, supporting household stability and limiting distressed inventory.
Inventory: National supply was roughly unchanged from 2025 and remained about 10% below 2019 levels.
Home prices: National sales prices were approximately 0.7% higher year over year, although performance varied significantly by market.
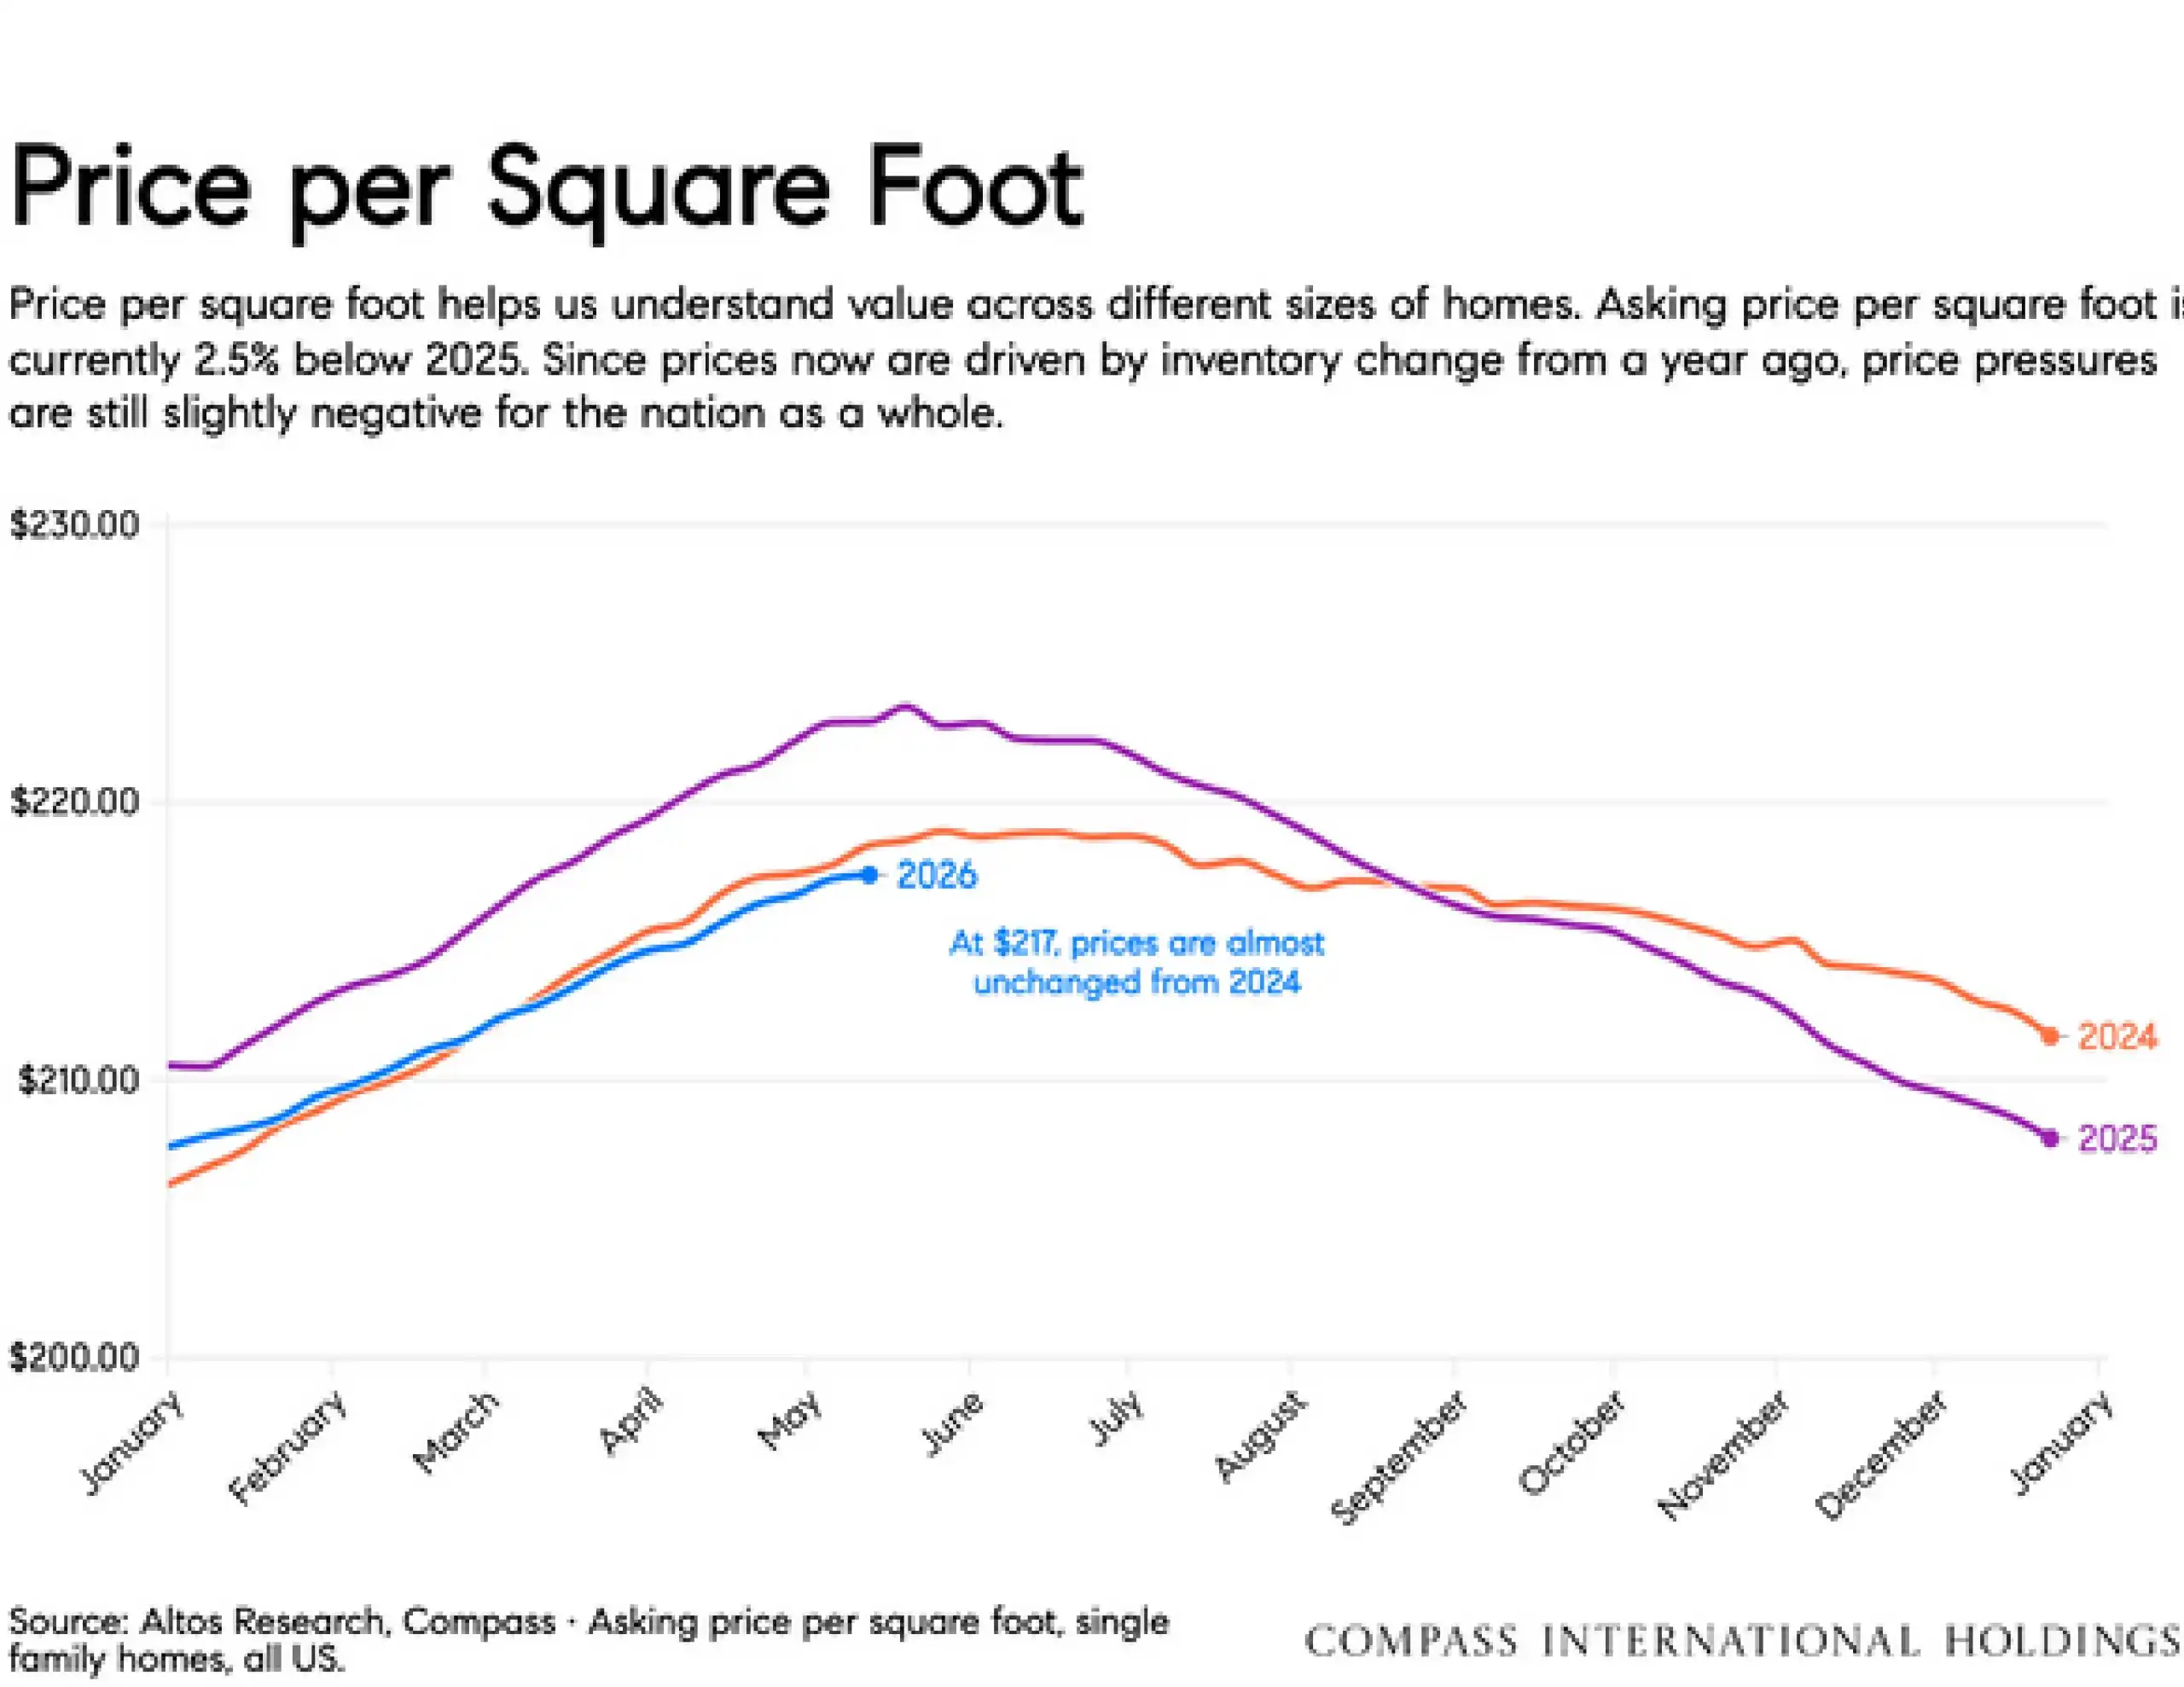
List prices: Active-listing prices were below both 2025 and 2024 levels, reflecting more cautious buyer demand and greater pricing sensitivity.
Homeowner equity: Homeowners remained in a strong financial position, with outstanding mortgages averaging approximately 45% loan-to-value.
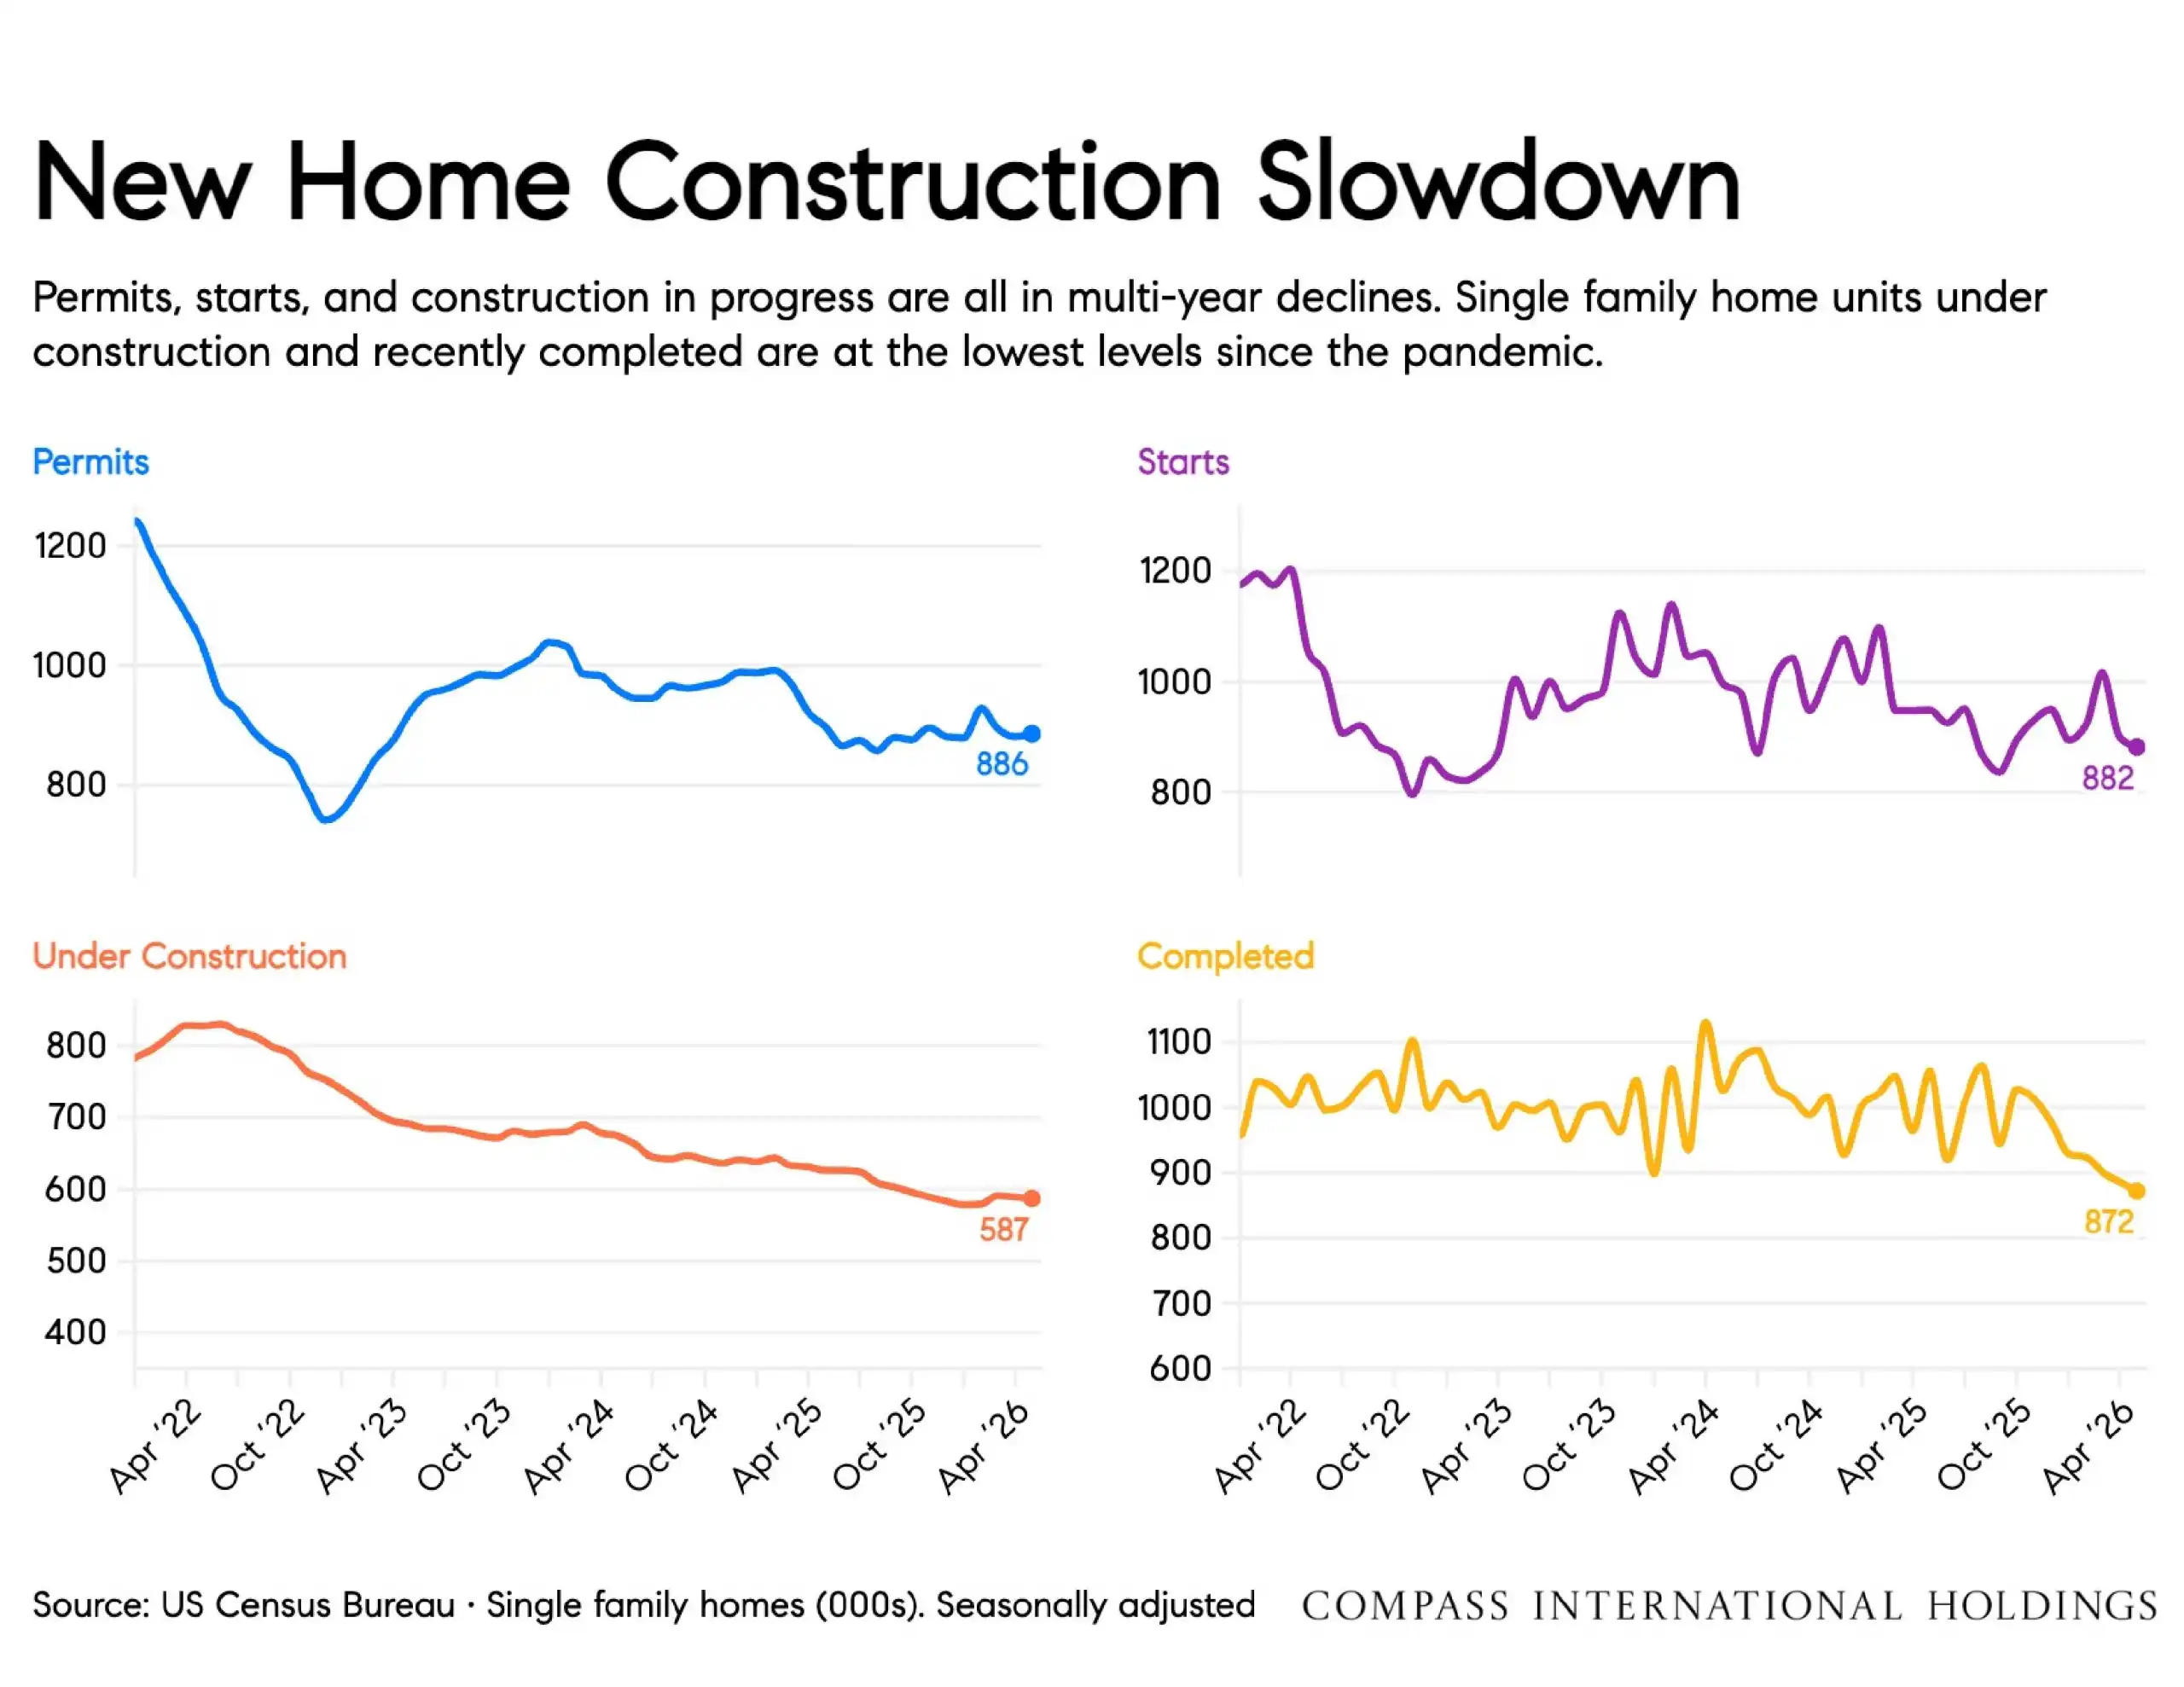
New construction: Single-family permits, starts, homes under construction, and completed homes were all showing multi-year slowdowns.
Overall direction: The market continues to move forward, but higher rates are creating a more selective environment in which local conditions, property quality, and pricing strategy matter more.
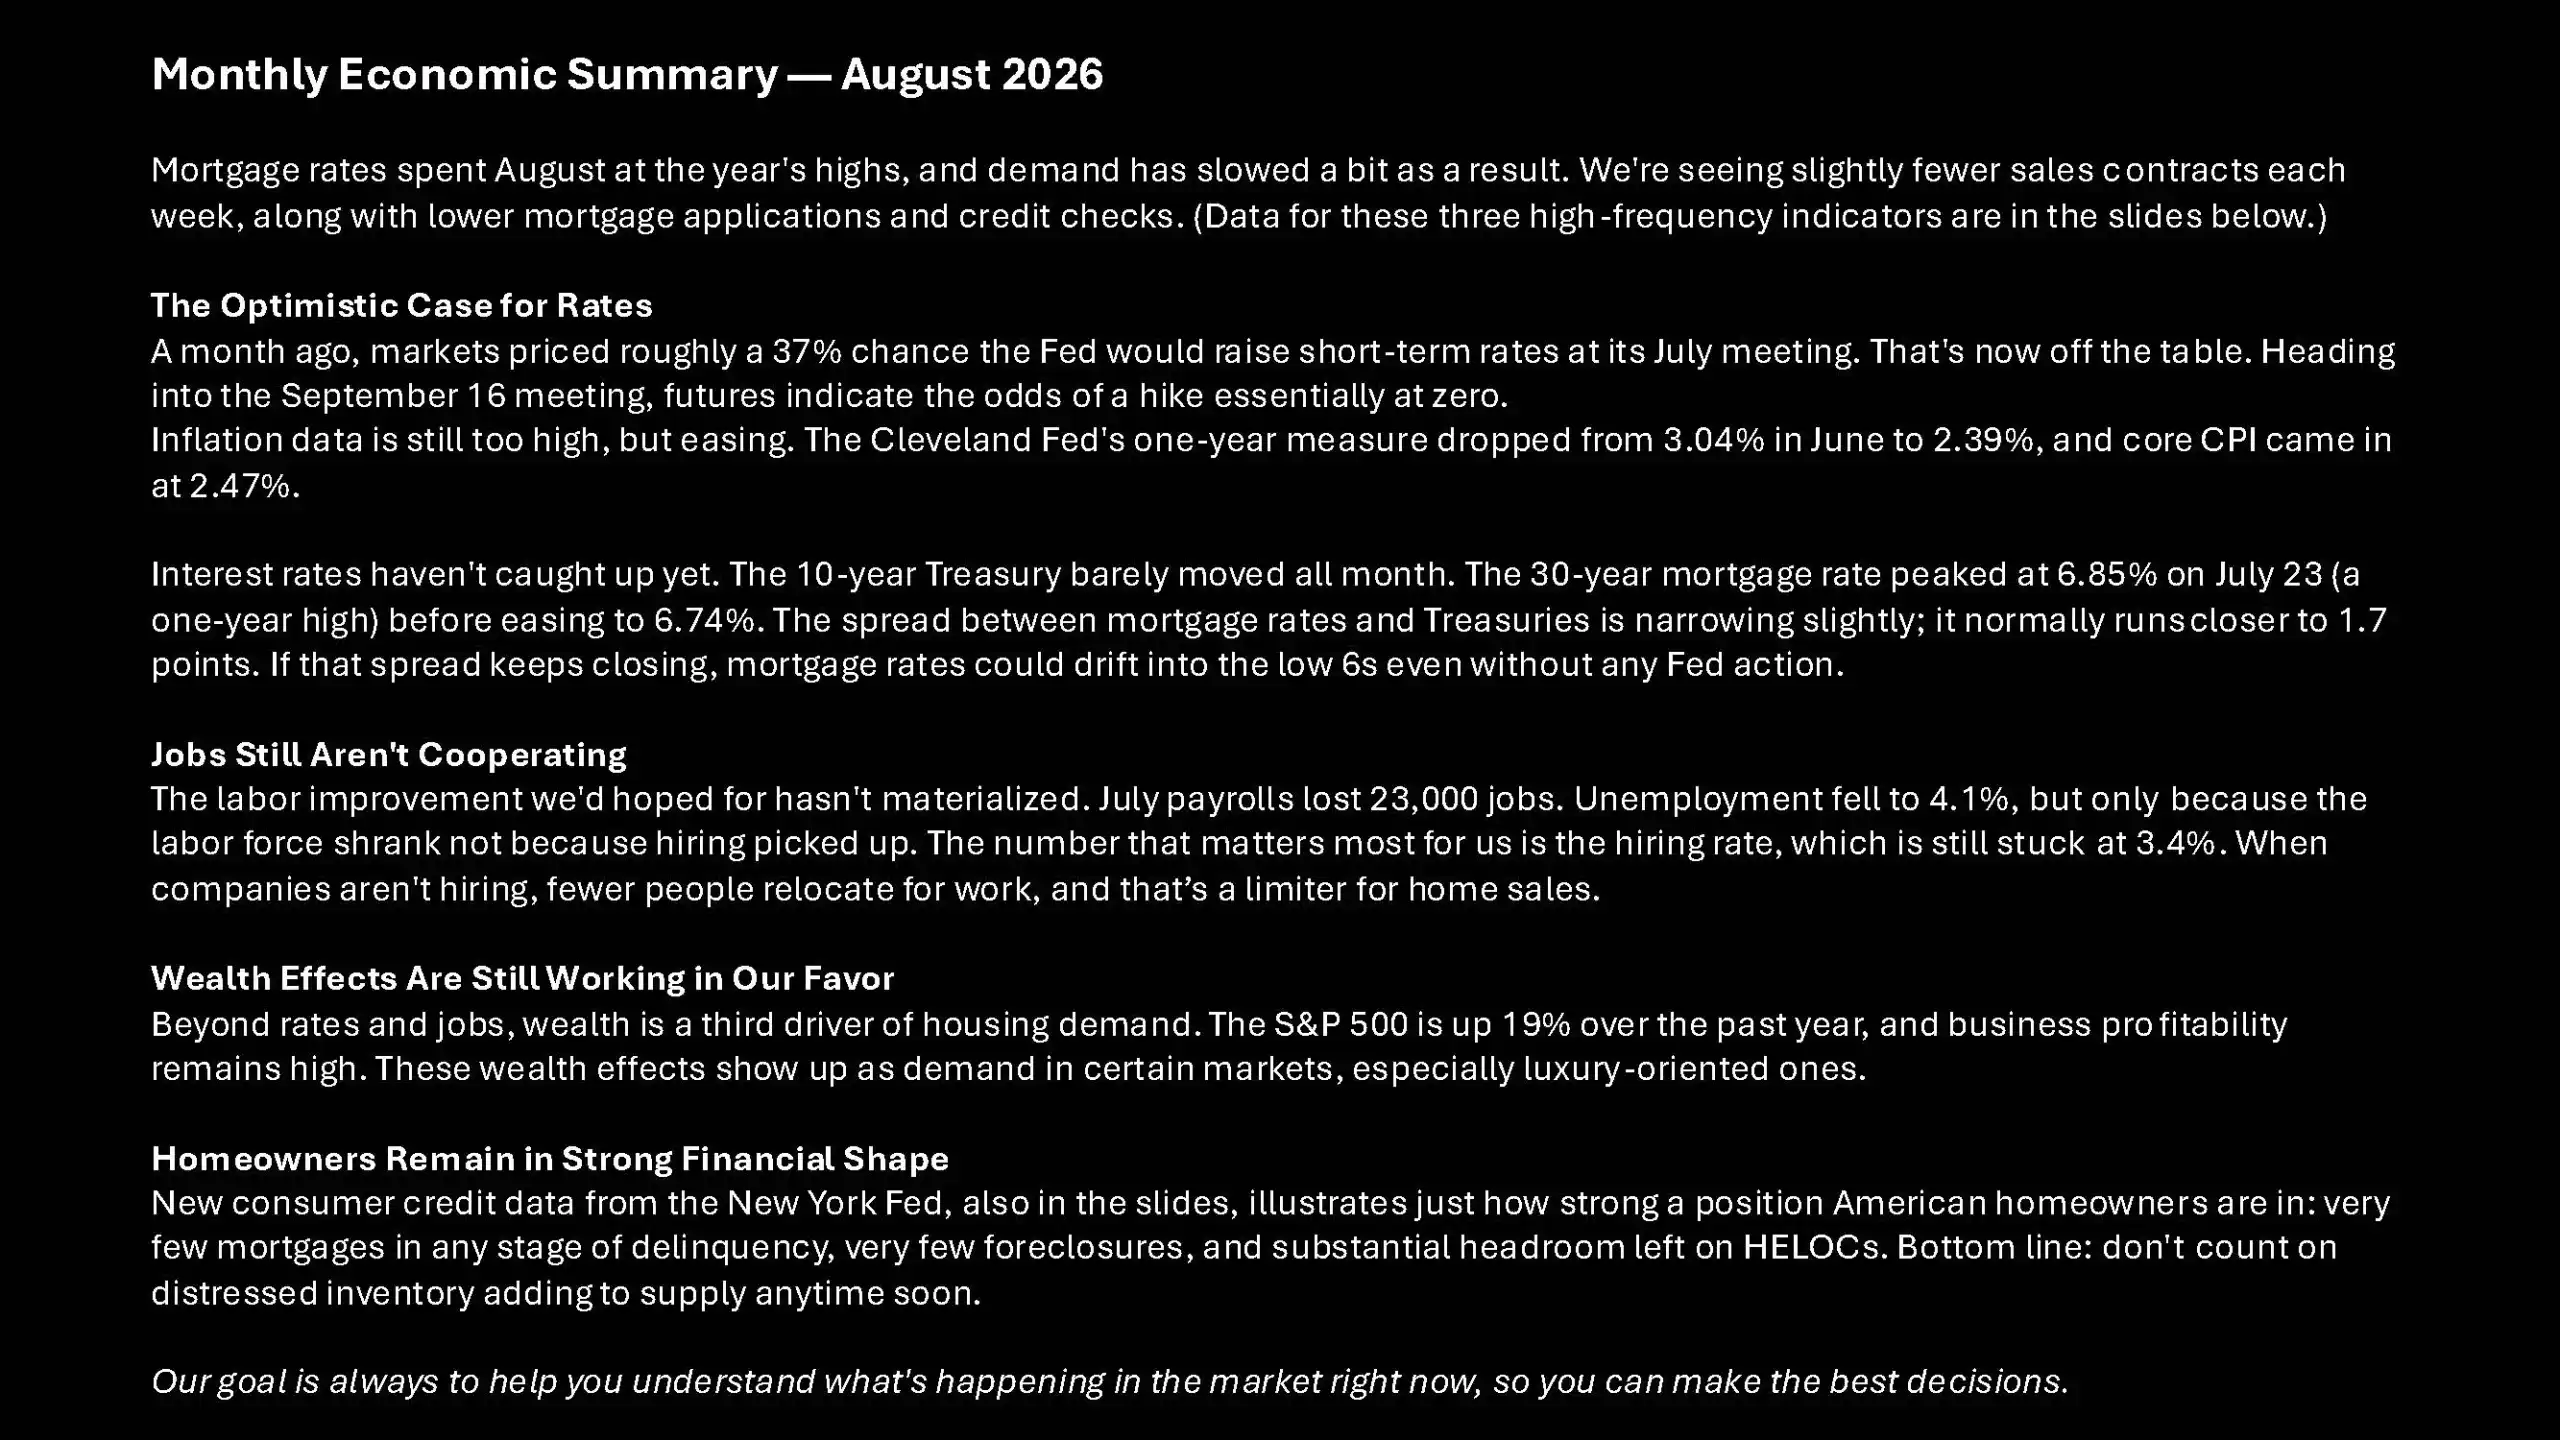
The national housing market remained active in August, but elevated mortgage rates and slower hiring continued to influence buyer demand. Mortgage rates stayed near their highest levels of the year, contributing to slightly fewer pending sales, fewer mortgage applications, and softer home-buying activity in recent weeks.
According to the August 2026 Compass National Insights Report, the average 30-year mortgage rate reached 6.85% in late July before easing to approximately 6.74%. Inflation has shown signs of moderating, which may eventually create room for lower borrowing costs, though mortgage rates had not yet meaningfully responded.
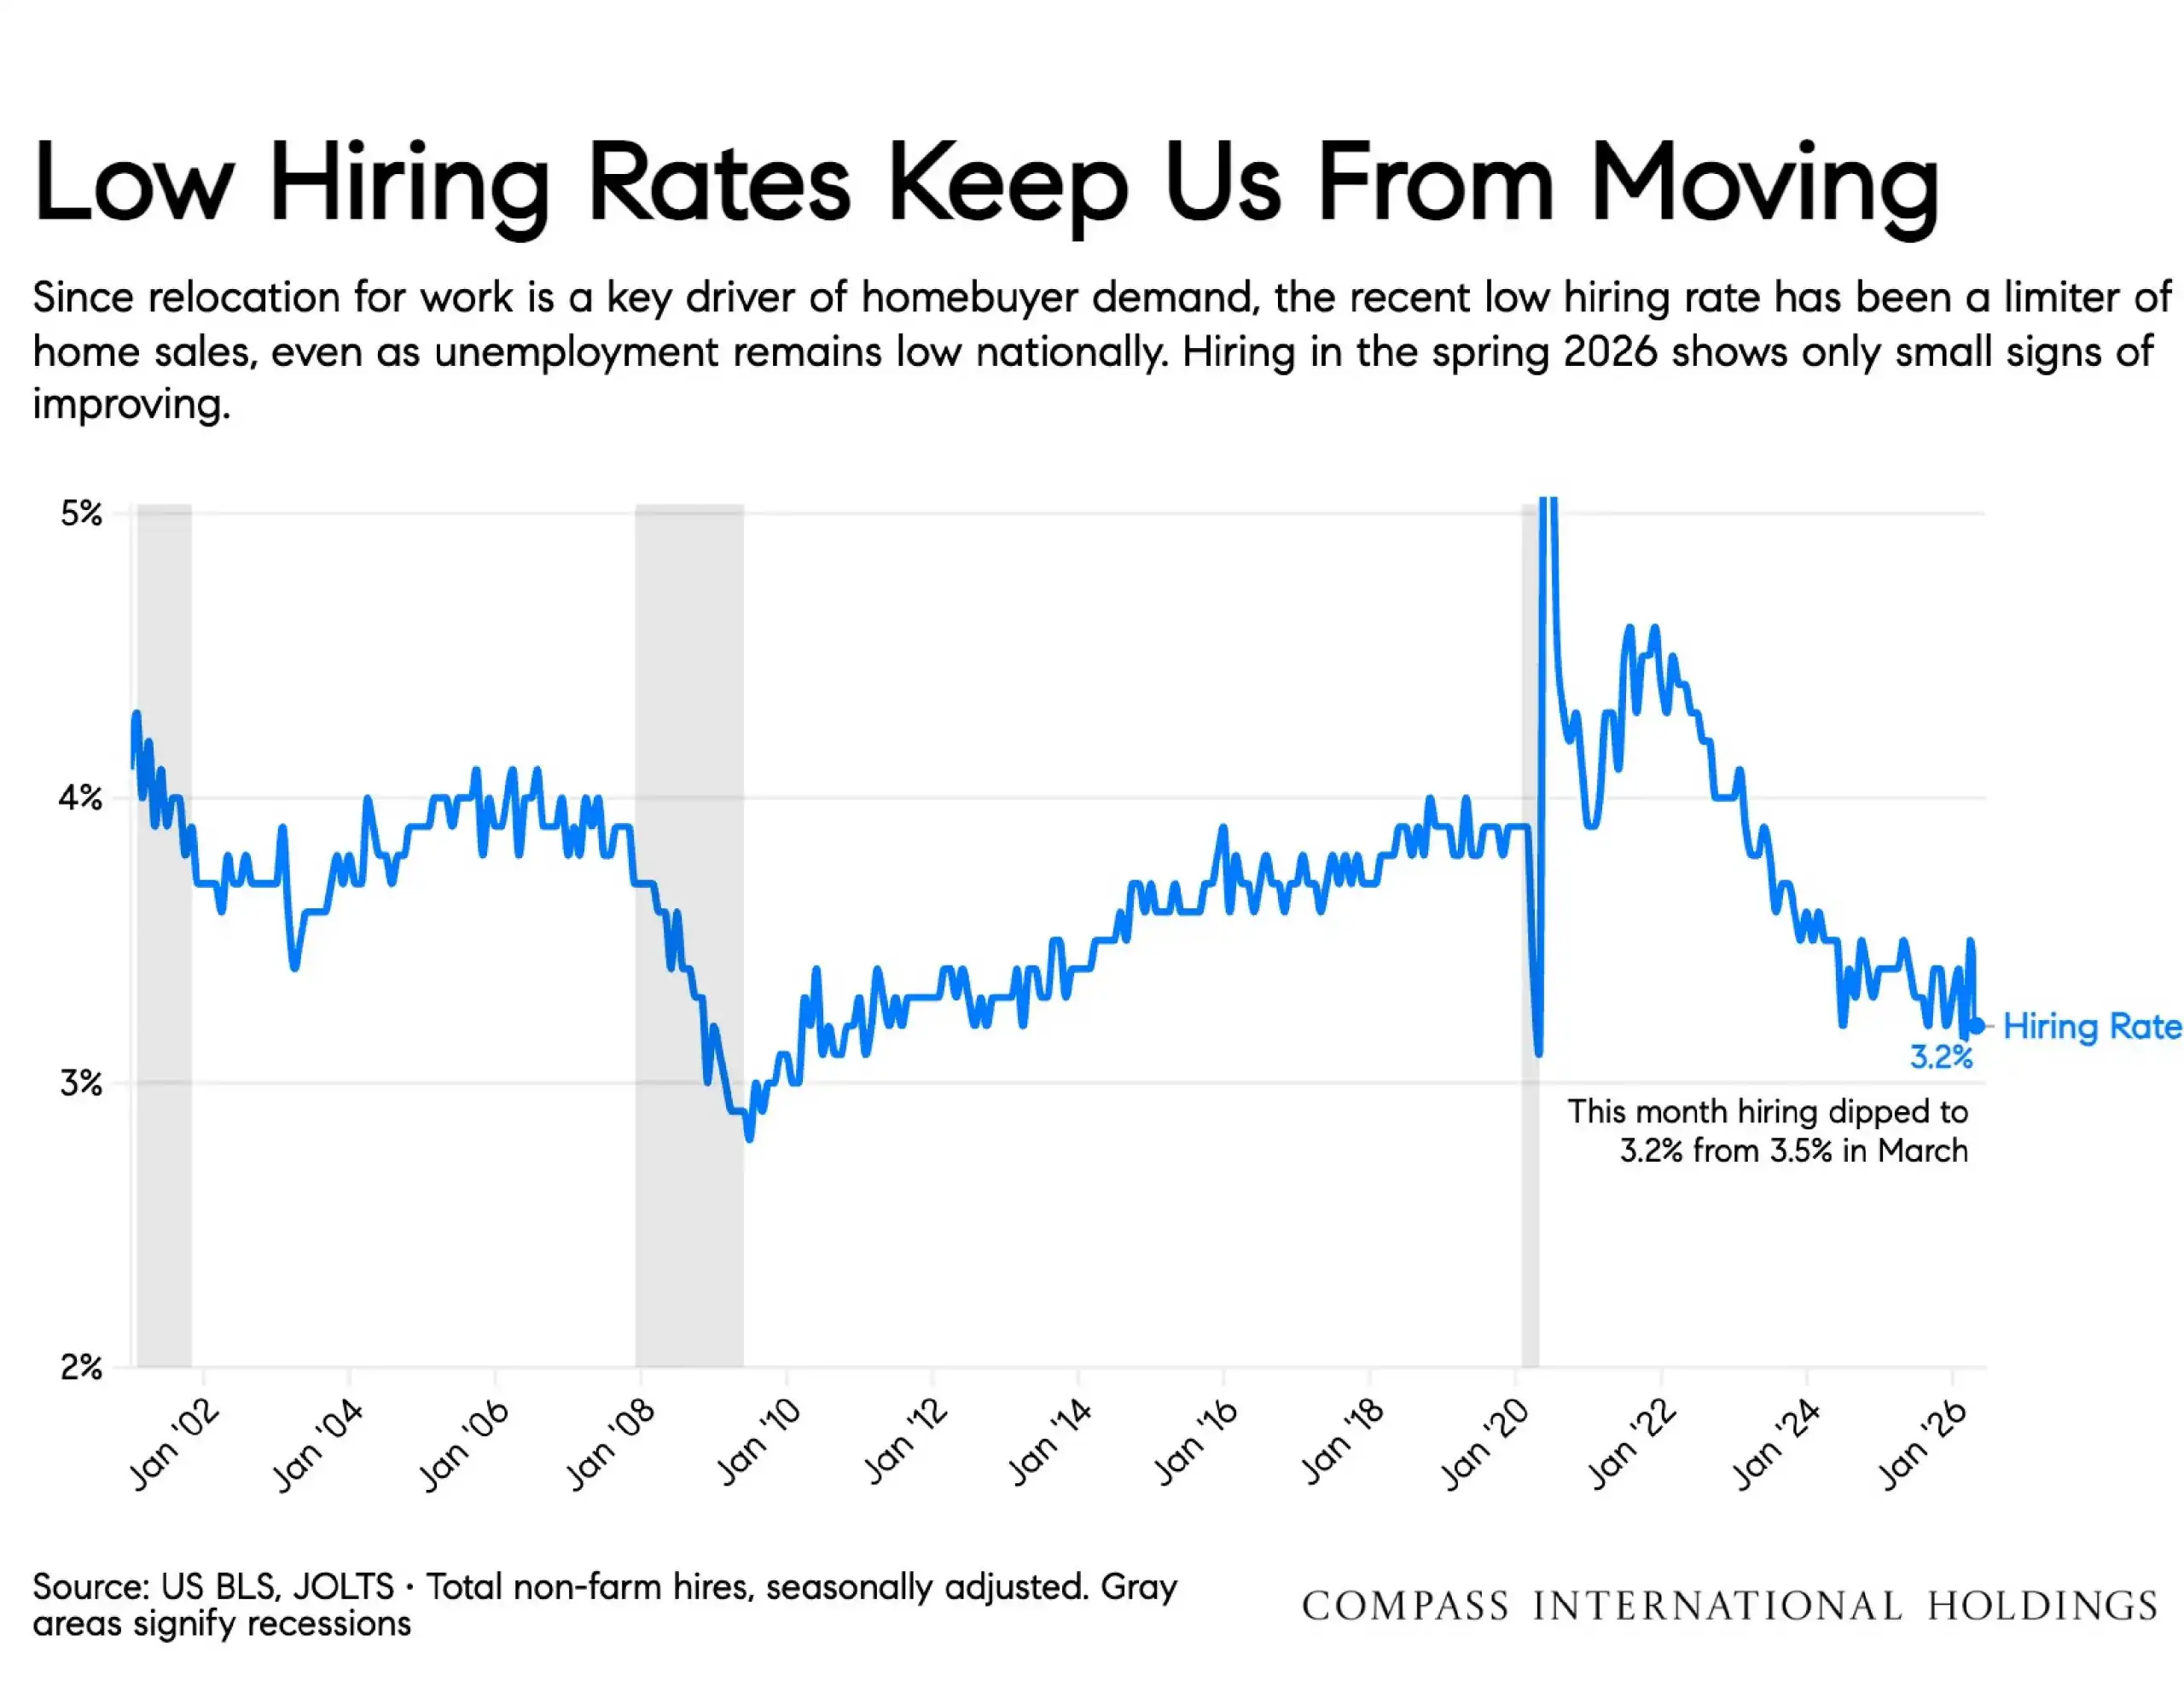
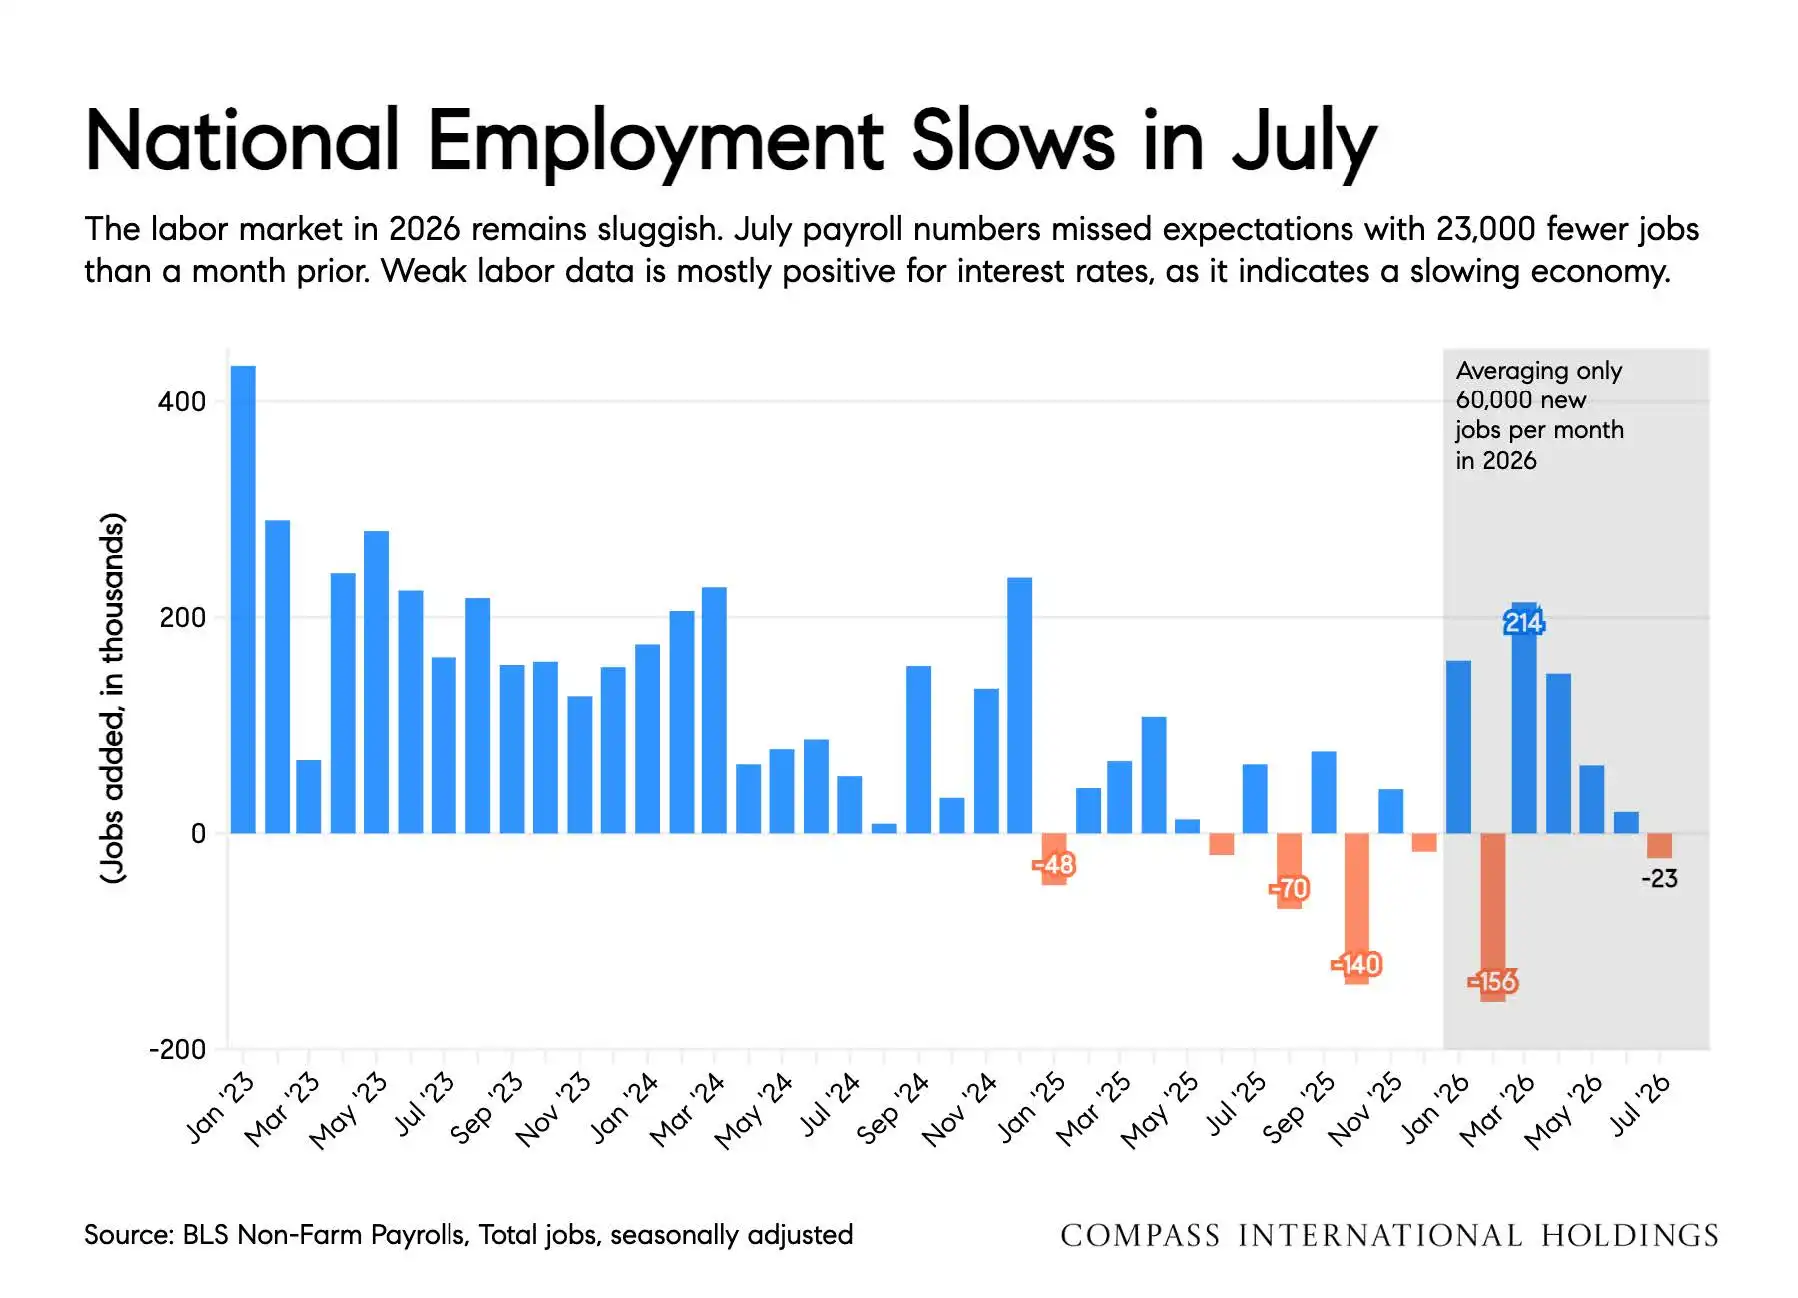
The labor market also presented a mixed picture. Job creation slowed and the national hiring rate remained subdued, while unemployment and initial jobless claims stayed relatively low — a "low hire, low fire" environment where companies are hiring cautiously but widespread job losses are not currently creating financial distress among homeowners.
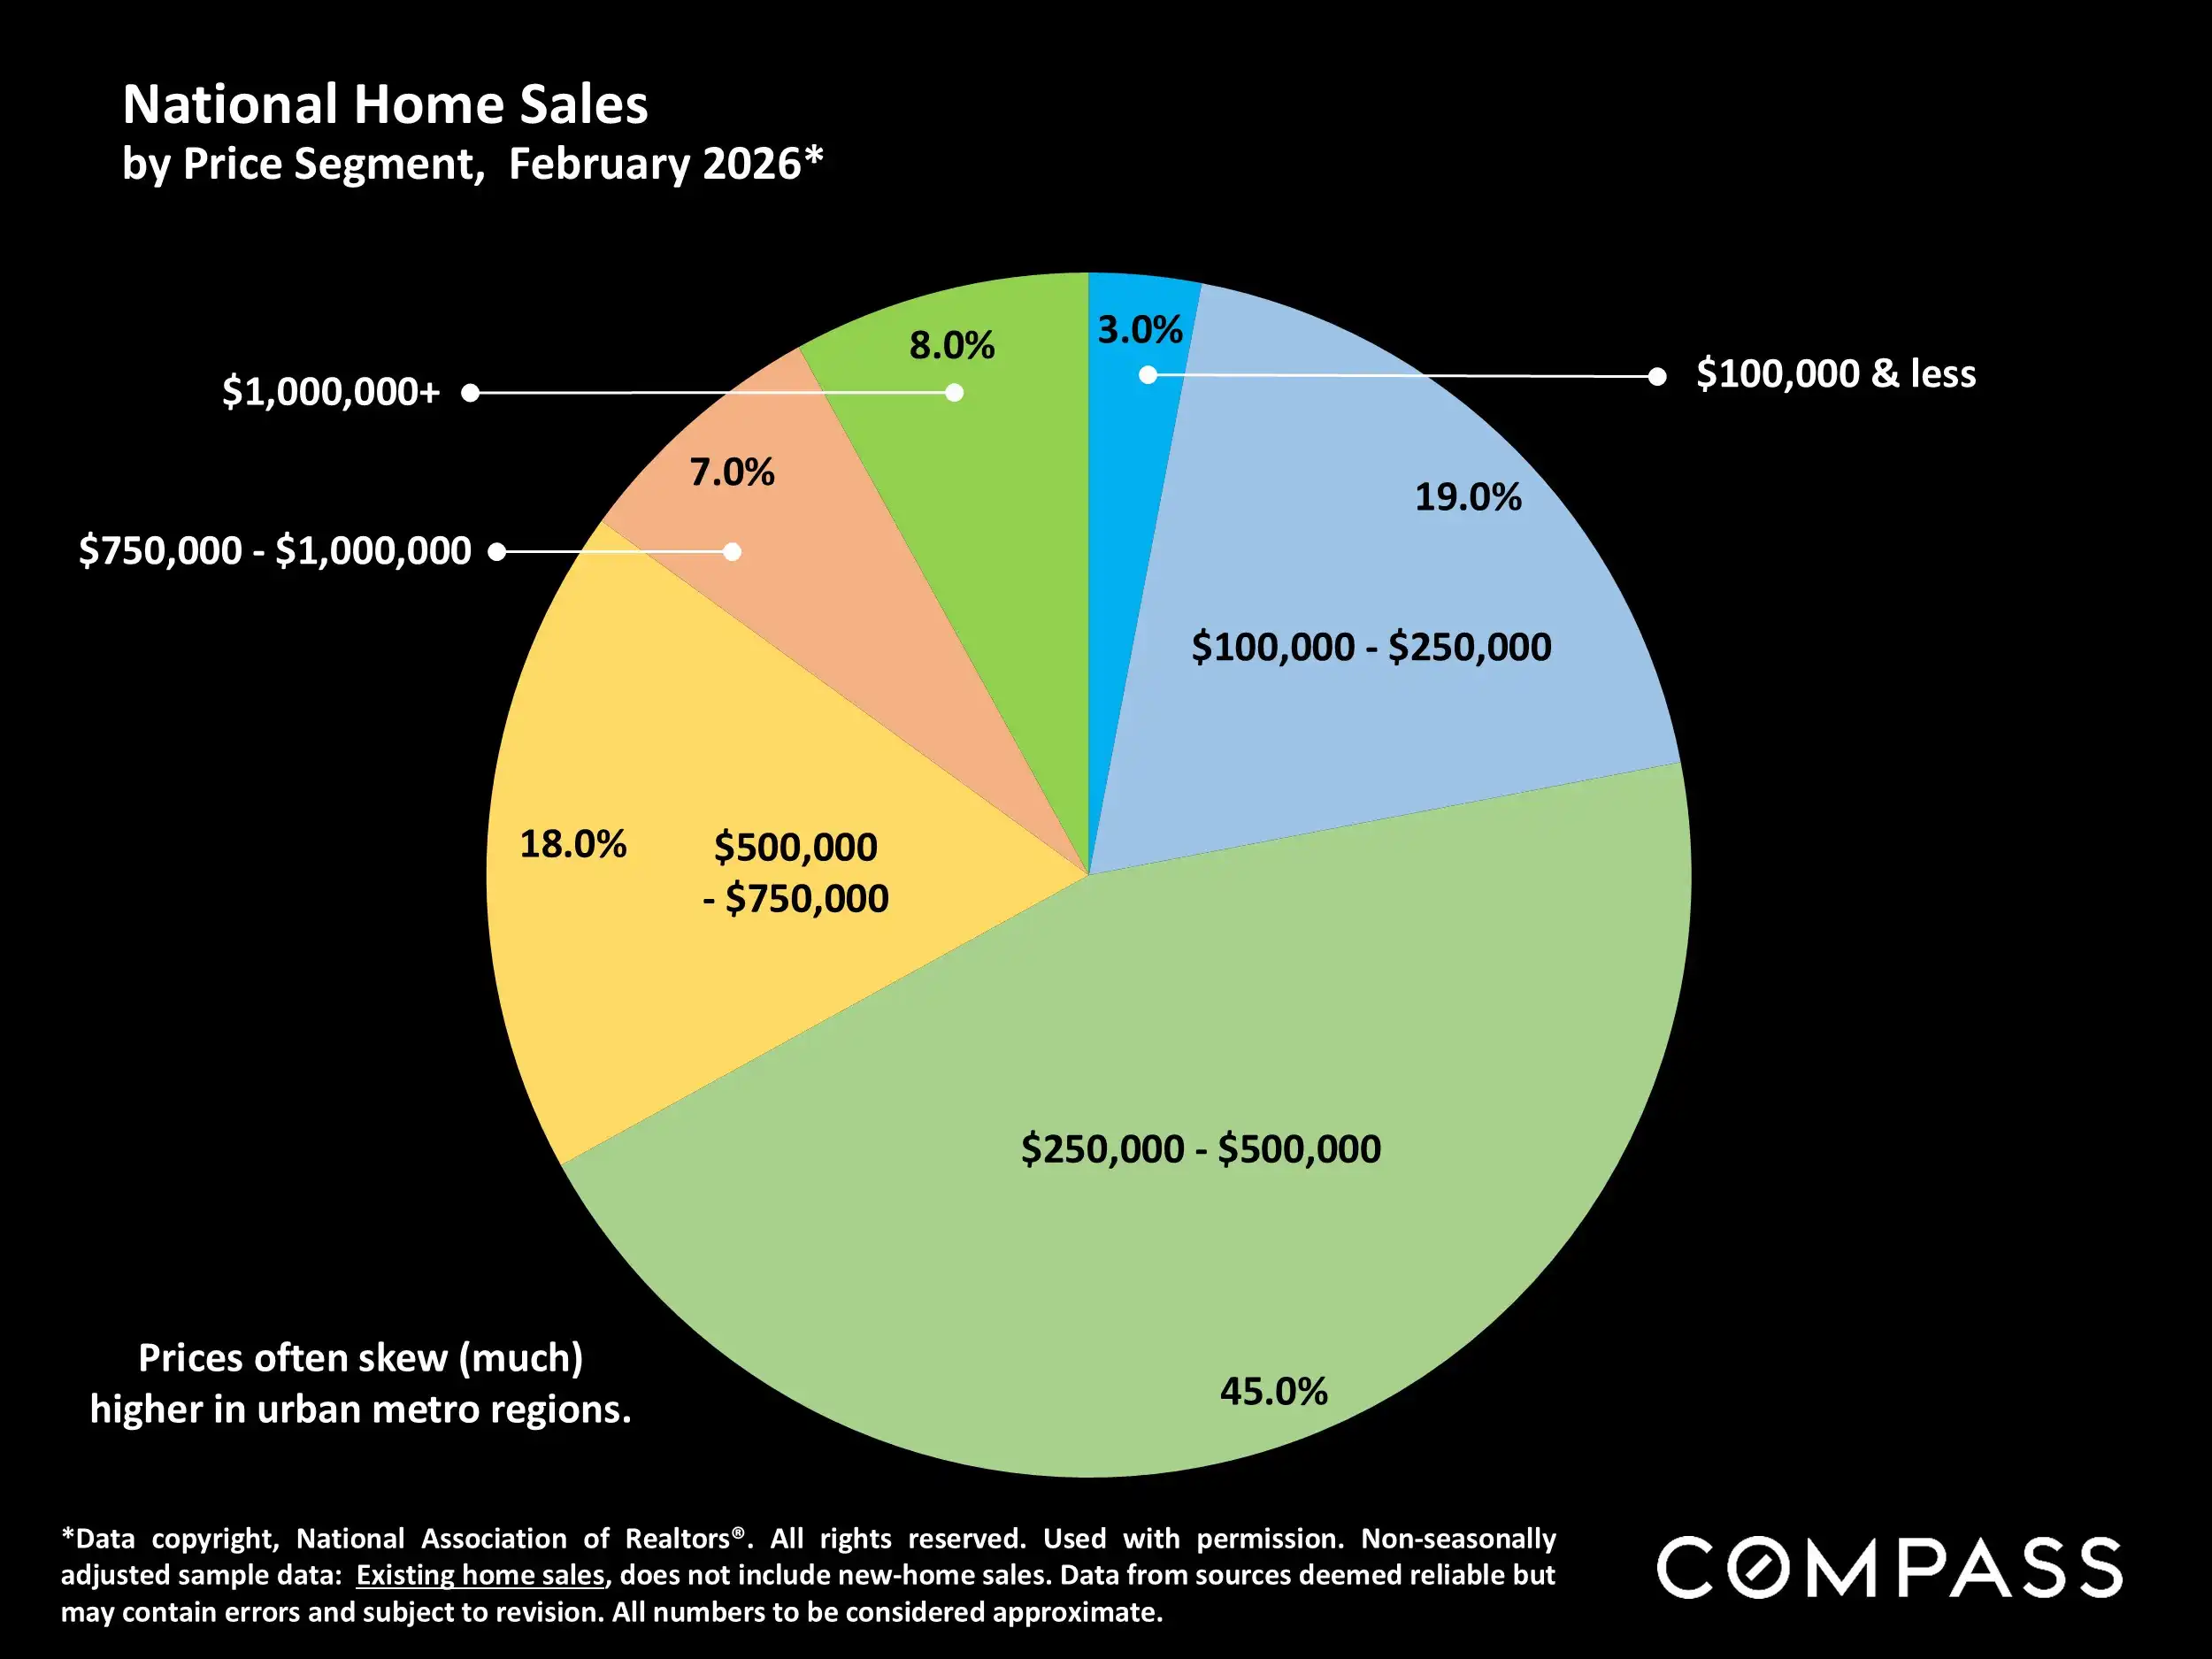
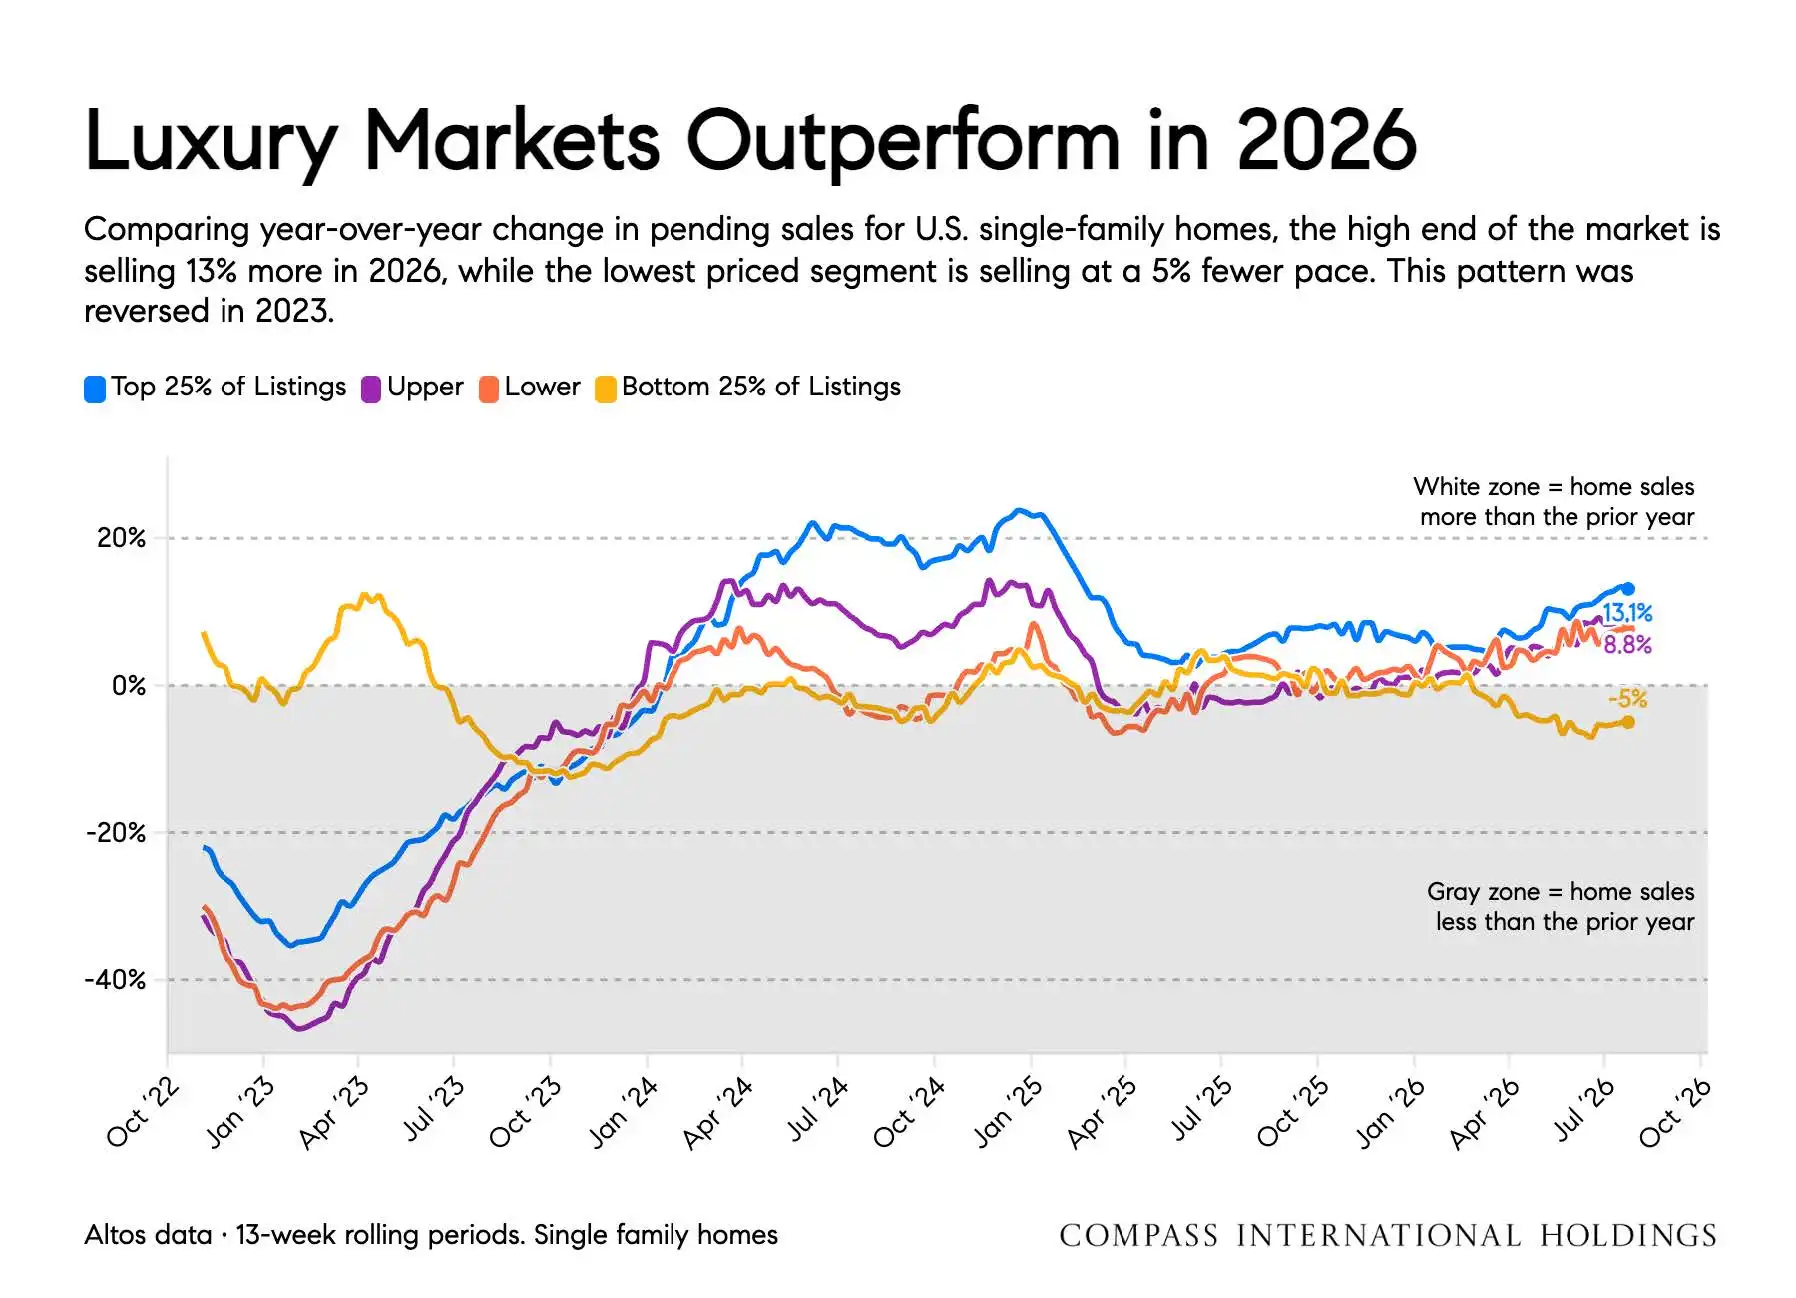
The slowdown has not been evenly distributed. Higher-priced homes continued to outperform more affordable segments nationally, with pending sales among the top 25% of single-family listings running about 13% higher than a year ago, while activity in the lowest-priced segment was roughly 5% lower. Existing-home sales remained near the restrained pace that has characterized the market since 2023, with July sales running at an annualized pace just below 4.1 million.
National housing inventory was roughly unchanged from 2025 and remained approximately 10% below 2019 levels. Home prices continued to vary substantially by region — nationally about 1% higher than a year earlier, though eight of the 20 metro areas in the S&P CoreLogic Case-Shiller Index reported year-over-year declines. Active-listing prices were softer than in recent years, suggesting pricing strategy, condition, and buyer expectations are becoming increasingly important.
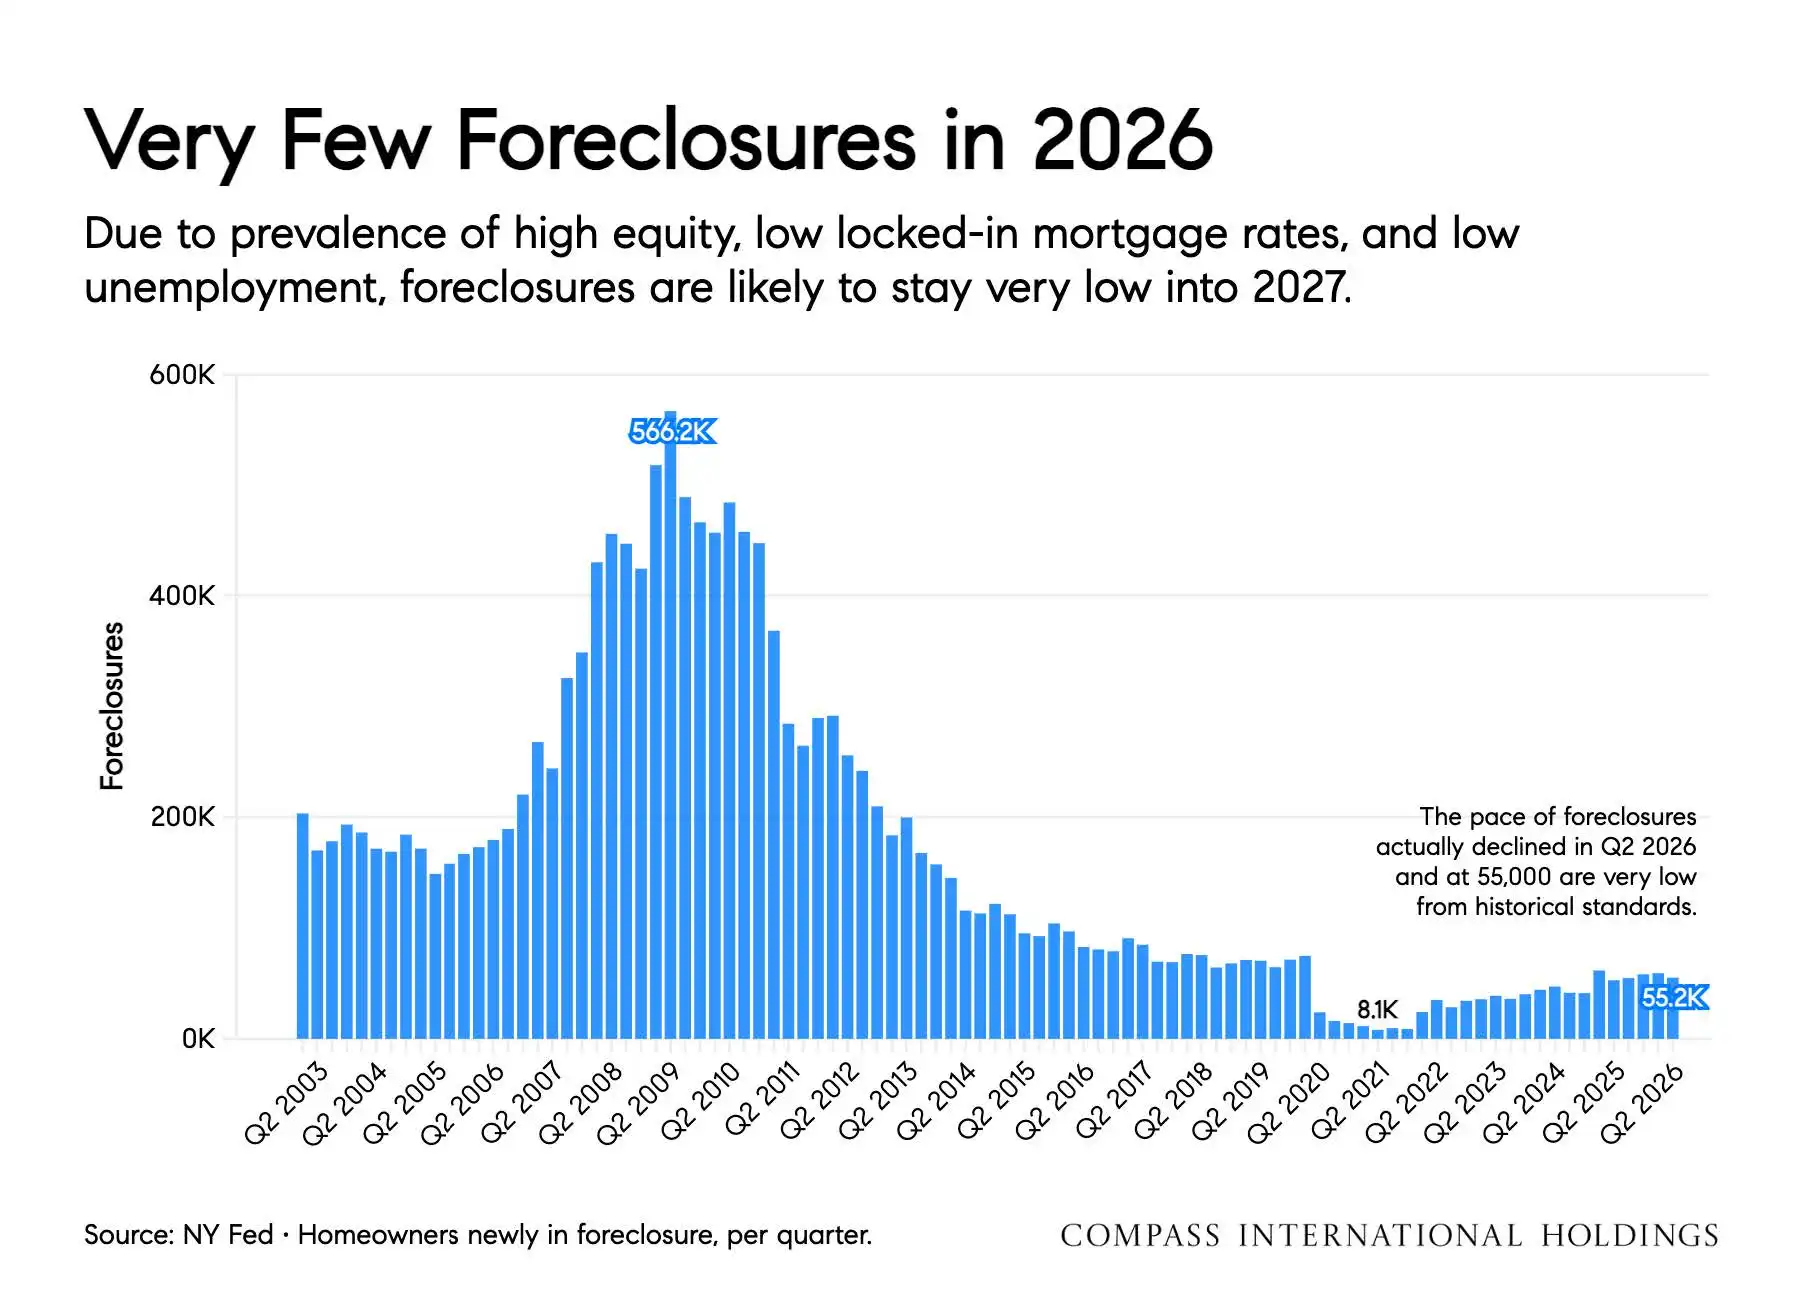
Homeowners overall remained in a strong financial position, with mortgage delinquencies and foreclosure activity staying historically low. August's data point to a housing market moving more selectively rather than experiencing broad weakness — buyers are responding carefully to borrowing costs, while sellers are competing for attention in a market where pricing and presentation matter.
Here in Jupiter, Palm Beach Gardens, Juno Beach, Tequesta, North Palm Beach, Singer Island, Jupiter Island, and throughout Northern Palm Beach County, local conditions do not always move in step with national averages. Waterfront homes, condominiums, golf communities, luxury properties, and traditional residential neighborhoods each have their own supply-and-demand patterns. The Simmonds Team uses national data as helpful context, but meaningful guidance comes from understanding local inventory, buyer demand, property condition, and neighborhood-specific trends.
Market at a Glance
Mortgage Rates: Rates remained near their highest levels of the year, limiting affordability and slowing some buyer activity.
Pending Sales: Pending home sales were approximately 1% below the same four-week period in 2025.
Existing-Home Sales: Sales remained near a 4.1 million annualized pace, slightly ahead of last year but below forecast.
Price Segments: Higher-priced homes continued to outperform lower-priced market segments nationally.
Inventory: National housing inventory was roughly unchanged from 2025 and remained below 2019 levels.
Home Prices: National home prices were approximately 1% higher year over year, although performance varied considerably by market.
List Prices: Active-listing prices were below recent-year levels, signaling more price-sensitive conditions.
Mortgage Delinquency: Mortgage delinquencies and foreclosures remained at historically low levels.
Homeowner Equity: Homeowner equity and generally stable employment continued to support the housing market.








Local Guidance for Today's Market
Whether you are buying, selling, or simply trying to understand where the market may be heading, John and Amy Simmonds can help you interpret the data through a local lens. With more than 45+ years of combined real estate experience and deep knowledge of Jupiter and Northern Palm Beach County, The Simmonds Team provides clear, practical guidance for today's market.
Disclaimer: This summary is based on the Month 2026 Compass National Real Estate Insights report and reflects national housing market trends. Real estate conditions vary significantly by local market, property type, price point, and timing. Buyers and sellers should consult a local real estate advisor for guidance specific to their situation.
Want a local read on these numbers?
National data is a starting point. For an analysis tailored to Jupiter, Palm Beach Gardens, and the Treasure Coast, our team is one call away.
Social Cookies
Social Cookies are used to enable you to share pages and content you find interesting throughout the website through third-party social networking or other websites (including, potentially for advertising purposes related to social networking).